Vasco Grilo🔸
Bio
Participation4
I am a generalist quantitative researcher. I am open to volunteering and paid work. I welcome suggestions for posts. You can give me feedback here (anonymously or not).
How others can help me
I am open to volunteering and paid work (I usually ask for 20 $/h). I welcome suggestions for posts. You can give me feedback here (anonymously or not).
How I can help others
I can help with career advice, prioritisation, and quantitative analyses.
Posts 229
Comments2873
Topic contributions40
Thanks, Joseph. The post is a bit in the spirit of Cunningham's Law. "The best way to get the right answer on the Internet is not to ask a question; it's to post the wrong answer", although I do ask a question in the title.
Hi Jim.
I am not confident I am aligned with RP in terms of which projects to fund. However, my commitment was just for them to scope out projects. Based on their research agenda on valuing impacts across species, I think it is likely I would find some sufficiently promising for me to fund them.
My commitment was also related to decreasing uncertainty about individual (expected hedonistic) welfare per unit time. I would not want RP to scope out projects addressing non-hedonistic considerations.
Great post, titotal.
This toy model does not prove that all speculative causes are better than grounded ones: you can be extremely certain about how many lives you will save by buying yourself an Xbox (0), but that does not mean it is a better use of funds than buying malaria vaccines for people in extreme poverty.
I think you meant "all grounded causes are better than speculative ones".
So, how to we correct for the optimizers curse? In this article I will show the solution from the original optimisers curse paper by Smith and Winkler. This solution has been discussed before, but I was unable to find anyone actually implementing it in a toy model. This is surprising, because the math involved is actually incredibly simple.
Here is the equation from the original paper:
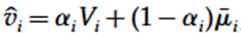
This is basically a direct application of inverse-variance weighting to the prior and estimated cost-effectiveness. "EV of the posterior cost-effectiveness" = ("EV of the estimated cost-effectiveness"/"variance of the estimated cost-effectiveness" + "EV of the prior cost-effectiveness"/"variance of the prior cost-effectiveness")/(1/"variance of the estimated cost-effectiveness" + 1/"variance of the prior cost-effectiveness").
I found barely any discussion of the topic by any other group, which is concerning, because I expect the problem to be significantly worse for charitable interventions that are based on more speculative evidence. For example, I think this should be highly important for something like Rethink priorities cross cause cost effectiveness model, but I was unable to find any discussion of it there.
Does anyone use this model to decide what to fund? I would say the ranking of its cost-effectiveness estimates is quite close to random.
Thanks for the interesting post, Aaron. It reminded me of the Pain Atlas Project from the Welfare Footprint Institute (WFI). I shared your post with Wladimir Alonso, and Cynthia Schuck-Paim from WFI.
Thanks for the great post, Matt.
The greatest plant scientist developed disease-resistant wheat varieties that are credited with saving over a billion lives from famine.
Toby Ord estimated Norman Borlaug saved "tens to hundreds of millions" of lives.
Other than a few exceptions (Fred Hollows, who enabled millions of cataract surgeries across the developing world, or Viktor Zhdanov, who drove the WHO smallpox eradication campaign), there are rarely stories of altruistic do-gooders with Jiro’s work ethic. And when they do exist, they are much less famous, leading to fewer memes to shape young people’s own ambitions.
Altruistic do-gooders are a tiny fraction of the population. So very ambitious altruistic do-gooders should be expected to be a tiny fraction of very ambitious people.
Thanks for the post, Matthew! Very funny and heart-warming.
I estimate that when someone experiences profound love, their increased wellbeing leads to approximately 2.3 % (= 50 additional kcal consumed per day * 0.046 % per kcal) additional food consumption. Multiplying this by the roughly 4.71*10^13 soil nematodes affected per kcal of food production (from my back-of-the-envelope calculations based on van den Hoogen et al. (2019)), I get approximately 1.08*10^12 affected nematode-years per year of experiencing love. Conditional on my preferred exponent of the number of neurons of 0.7, and assuming the welfare range of a nematode is 10^-6 as a fraction of that of humans, the welfare effects on soil animals could be 1.08*10^6 nematode-equivalent quality-adjusted life years (QALYs) per year of love experience.
Very interesting Fermi estimate. I was actually wondering about how many nematode-years were affected by 1 kcal just a few days ago, although not in the context of love. Claude's numbers are quite off. Here is my version. Rice requires 0.00164 m^2-years per kcal. I very roughly estimate crops have 1.33 M soil nematodes per m^2, and other biomes besides pasture, and deserts and xeric shrublands have 1.72 M to 9.31 M soil nematodes per m^2. So I calculate increasing the area of crops by 1 m^2-year decreases 390 k (= (1.72 - 1.33)*10^6) to 7.98 M soil-nematode-years (= (9.31 - 1.33)*10^6). I am very uncertain about whether increasing cropland increases or decreases soil-nematodes-years. So my actual takeaway is more that increasing the area of crops by 1 m^2-year increases or decreases 390 k to 7.98 M soil-nematode-years. As a result, I calculate 1 kcal of rice increases or decreases 640 (= 0.00164*390*10^3) to 13.1 k soil-nematode-years (= 0.00164*7.98*10^6). In words, a few thousands of soil-nematode-years per kcal of rice.
For Claude's assumption that profound love increases energy intake by 50 kcal/profound-love-day, and this being satisfied by consuming rice, I get a change of 32.0 k (= 640*50) to 655 k soil-nematode-years per profound-love-day (= 13.1*10^3*50), or 11.7 M (= 32.0*10^3*365.25) to 239 M soil-nematode-years per profound-love-year (= 655*10^3*365.25). In words, tens of thousands to hundreds of thousands of soil-nematode-years per profound-love-day.
Claude estimated 1.08 trillion soil-nematode-years per profound-love-year, 4.52 k (= 1.08*10^12/(239*10^6)) times my upper bound. I wonder how Claude can get these relatively simple calculations so off.
Thanks for the great post, Sofia. I would just focus on increasing animal welfare instead of ending factory farming. I think more happiness and less suffering are necessarily good (all else equal), whereas I do not see large scale intensive animal farming as necessarily bad. I estimate slower growth broilers, and hens in cage-free aviaries have negative, but close to neutral lives.
Thanks for clarifying, Arvo.
We didn't find that people were responding with zero plausibility very much at all.
I wonder how people decided between a plausibility of 0/10 and 1/10. It could be that people picked 0 for a plausibility lower than 0.5/10, or that they interpreted it as almost impossible, and therefore sometimes picked 1/10 even for a plausibility lower than 0.5/10. A logarithmic scale would allow experts to specify plausibilities much lower than 1/10 (e.g. 10^-6/10) without having to pick 0, although I do not know whether they would actually pick such values.
I'm not sure what you have in mind in terms of modelling the stances' weight as distributions instead of point estimates. Perhaps you mean something like leveraging those distributions above via some sort of Monte Carlo where weights are drawn from these distributions and the process is repeated many times, then aggregated.
Yes, this is what I had in mind. Denoting by W_i and P_i the distributions for the weight and probability of consciousness for stance i, I would calculate the final distribution for the probability of consciousness from (W_1*P_1 + W_2*P_2 + ... W_13*P_13)/(W_1 + W_2 + ... W_13).
That indeed sounds more sophisticated and could possibly help track uncertainty but I suspect it would very little difference. In particular, I think so because we observed that unweighted pooling of results across all stances is surprisingly similar to the pool when weighted by experts; the same if you squint.
I think the mean of the final distribution for the probability of consciousness would be very similar. However, the final distribution would be more spread out. I do not know how much more spread out it would be, but I agree it would help track uncertainty better.
Thanks for the relevant points, James.
Changing from conventional to furnished cages, and from these to cage-free aviaries is more costly than directly changing from conventional cages to cage-free aviaries. However, the direct change requires a greater initial investment, and has a greater potential to decrease revenue due to increasing the cost of eggs 4.02 (= 1/0.249) times as much as the change from conventional to furnished cages. So I think having furnished cages as an intermediate step may at least in some cases derisk the overall change. 2 changes would still not make sense for a short time between changes. However, even if furnished cages are fully banned in the EU from 2032 on, which I guess is optimistic, there would still have been 20 years (2012 to 2032) with battery cages fully banned, but furnished cages not banned in the EU. Assuming there are still 30 years until 90 % of layers are cage-free, some farms will only make the final transition in 30 years. This could mean 15 years until full implementation of furnished cages, and 15 years from this until full implementation of cage-free aviaries.
I discuss this a bit in the 1st paragraph of the discussion. In addition, I wonder whether the significant reduction in the time in pain as assessed by WFI could be used to get people enthusiastic about having furnished instead of conventional cages.
My intuition is that the probability of securing a welfare reform is a sigmoid function (S-curve) of "advocacy spending"/"increase in cost". If so, and furnished cages increase the cost of eggs 24.9 % as much as cage-free aviaries relative to conventional cages, advocating for furnished cages could increase the probability of securing a welfare reform a lot for cases where advocating for cage-free aviaries results in a probability which is still at the bottom of the sigmoid.
I agree verifying furnished is harder than veryfying cage-free aviaries. Do you know the extent to which this was a challenge in the context of the EU's ban on conventional cages? I assume enforcement is usually more difficult in other regions. On the other hand, they already have the EU as a model to follow.