This post is Part 1 in a series on organizing fundraising campaigns in the workplace:
- Part 2: Key Factors for Success in Organizing a Fundraising Campaign at Your Company
- Part 3: A Playbook for Running Corporate Fundraising Campaigns
TL;DR
- Running a fundraising campaign at your workplace can be a highly effective way to multiply your impact.
- In 2021, High Impact Professionals (“HIP”) supported EAs in organizing 8 fundraising campaigns at 8 different companies, counterfactually raising about 240,000 USD for effective charities.
- The average amount raised per event was about 30,000 USD (median 3,900 USD), with most donations coming from a few events.
- On average, it took about 25 hours to organize and run a campaign (20 hours by organizers and 5 hours by HIP).
- The events generated an average of 786 USD per hour of counterfactual donations to effective charities.
- This makes fundraising campaigns a very cost effective means of counterfactual impact; as a comparison, direct work that generates 1,000,000 USD of impact equivalent per year equates to around 500 USD per hour.
- If you’re interested in exploring what a fundraising campaign could look like at your organization, please contact federico@highimpactprofessionals.org for 1-on-1 support and to inquire about our step-by-step fundraising guide.
- If you’re interested in learning more about the 2021 campaigns’ data and methodology, please keep reading.
- We would love to get feedback on our data and methodology, so don’t hesitate to reach out here or in the comments.
Intro
Running a fundraising campaign at your workplace can be a highly effective way to multiply your impact as a working professional. Getting colleagues to donate money to effective charities not only increases your donation leverage but also has the potential to get others involved in the EA movement. It can also help you build relevant EA career capital.
During the 2021 giving season, HIP supported EAs in organizing 8 fundraising campaigns at 8 different companies. Essentially, the workplace campaigns encouraged those EAs’ colleagues to donate to effective charities. The results detailed below point to these events being a strong way to enhance one’s impact.
Results
In total, the 8 campaigns counterfactually raised about 240,000 USD for effective charities. The average amount raised per event was about 30,000 USD, with a 90% Confidence Interval (“CI”) of 80 USD to 140,000 USD. The graph below shows the distribution in logarithmic scale.

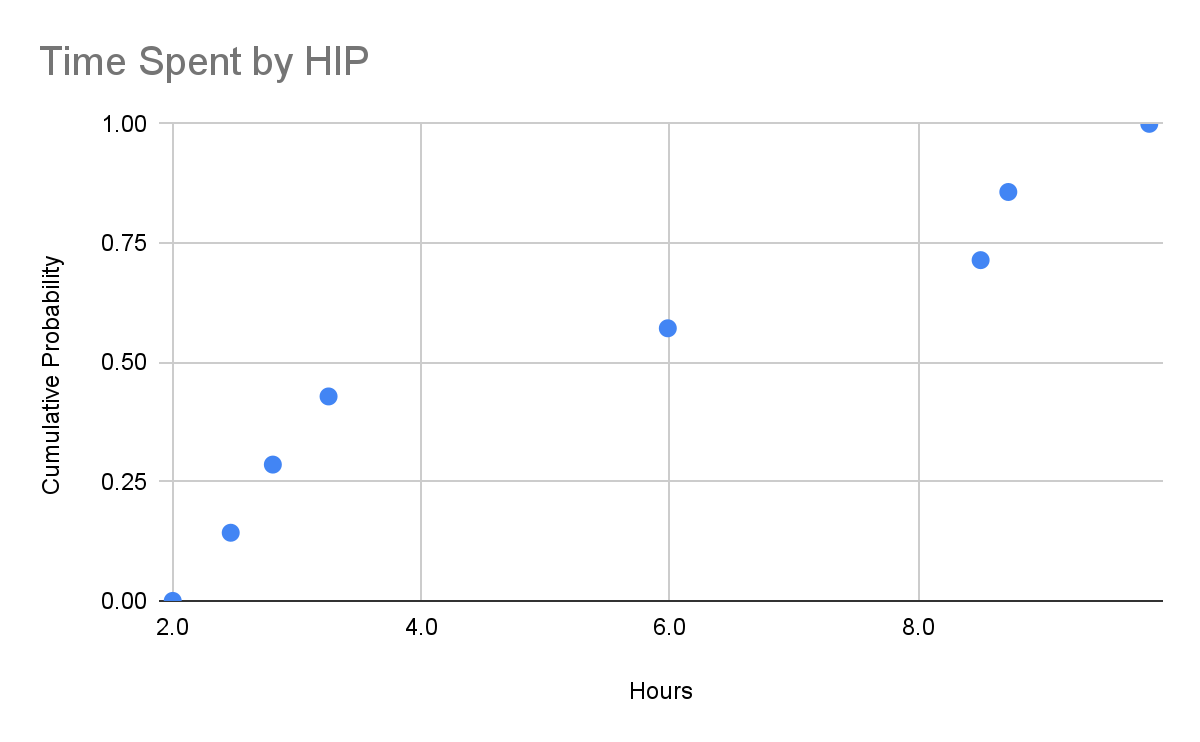
The main cost of the initiative is the time taken to organize the campaign. On average, organizers spent 20 hours on their events (CI 6 hours to 42 hours) and received 5 hours of support from HIP (CI 2 hours to 10 hours). The distributions are shown below.

Computing the ratio of money raised to time spent, we arrive at an average of 786 USD per hour (CI 7 USD to 3,100 USD).
To put this into perspective, let’s assume that direct work generates between 100,000 USD and 1,000,000 USD of impact equivalent per year[1] and that people work between 1,800 and 2,200 hours per year. This computes to an average of 290 USD per hour (CI 57 USD to 530 USD), which means that organizing fundraising campaigns can be about 2.7x as effective as direct work on an hourly basis.
Of course, we are not saying that people should stop considering direct work and do fundraising events instead since, for example, the impact of doing fundraising campaign work year-round may not scale as well. Still, strategically timed campaigns (e.g., around giving season, your organization’s raise/bonus season, or another liquidity event) could be a very high impact seasonal side gig.
Heavy Tail
One could raise a fair argument that the donation distribution above is quite heavily tailed, and because of the limited data points, the result may be anomalous. Though we have already been quite conservative in the estimation of the counterfactual impact of the events, we could take an even more conservative stance by removing the outlier from the distribution. Doing so, we arrive at a per-campaign result of 4,000 USD on average (CI 60 USD to 15,000 USD). The distribution is shown below. Note that the scale of the distribution is now linear.

However, even under this more conservative approach, the average hourly value of the organizer’s time is 343 USD, which still compares favorably to direct work at 290 USD per hour. Moreover, donations are usually heavily tailed, as indicated in the EA Survey, so it is reasonable to expect that there could be some big outlier hits across a range of campaigns.
Main Benefits
The main benefit of running a fundraising campaign is the money counterfactually moved towards effective causes, especially considering its high cost effectiveness. But, we found that there are additional side benefits.
For example, effective donations can be a good introduction to EA, and some organizers reported finding new people sympathetic to EA in this way.
Also, from our interviews with the organizers after the fact, they reported a slight increase in their engagement with EA thanks as the campaigns provided a way for the organizers to do something tangible.
Finally, running a campaign is a good way to build EA career capital that could facilitate a potential future move into direct work. For example, thanks to having organized fundraising campaigns in his previous work, HIP cofounder, Federico, got bonus points on his application to join the Charity Entrepreneurship incubation program, where he was able to find a cofounder and launch HIP.
Potential Challenges
The main cost of running a fundraising campaign is the time needed to organize the events. In 2021, some events took as little as 5 hours, but the average was 20 hours. Strategies to mitigate this are to get ready-made material and external support. Recognizing this, we created a step-by-step fundraising guide and we are also happy to help you set up the campaign. Another potential approach is to do something requiring very low effort, like sending a short message to your colleagues encouraging effective giving and offering suggested resources.
Also, in order to set up a campaign, you often will need to deal with intra-company processes and the like. In a flat hierarchy organization this can be pretty minor; in other cases, this might require some time. The best mitigation strategies here are to start soon and get project buy-in from someone higher up in your organization.
Finally, not all people view philanthropy in the same way as EA, so some people in your organization might want to, for example, focus charitable giving locally, etc. Thus, there is the potential for some friction. On one hand, you don’t want to be too harsh and ideally can find a compromise; on the other hand, you don’t want to support things which are not effective. A mitigation strategy here is to try to meet people where they are, walk them through your thought process, and be ready to make compromises if necessary.
Wrap Up
The high leverage opportunity presented by fundraising campaigns makes them a compelling way to multiply your impact.
If you're interested in seeing what a campaign could look like at your organization, please contact federico@highimpactprofessionals.org and we can share insights, resources (like our step-by-step fundraising guide), tips, and tricks to help you set up your own successful event.
We will publish more materials on fundraising campaigns in the near future, including an updated Fundraising Guide, so stay tuned! You can also subscribe to our newsletter to get updates on resources and other information for EA working professionals.
- ^
It’s hard to put a number on direct work. 80,000 Hours mentioned a conversion rate of 100,000 USD per year and stated it could be off by an order of magnitude. Charity Entrepreneurship estimates the impact of charity entrepreneurs at 200,000 USD per year and that top founders can have 5x that impact. All things considered, we think that 100,000 USD to 1,000,000 USD per year should be on the reasonable to generous side of things for direct work. Moreover, we didn’t want to use conservative numbers that would inflate the comparative effectiveness of fundraising campaigns.
These are amazing results guys, well done!
How did you select which companies you worked with?
Hi Jack, thanks for your comment. 2021 was a smaller-scale pilot for HIP and we worked primarily with EAs at companies that were already in our network as well as with EAs/companies that approached us for assistance. For 2022 we hope to scale up and support more EA working professionals in running fundraising events.
It seems like these are amazing results and not so much effort. Very impressive.
Thanks Ula! Indeed we think it is a very cost-effective way for EA working professionals to multiply their impact and build some career capital in the process.
Can you show/share your computations of the confidence intervals? Also, less than 95% intervals might be relevant. (Maybe Dm me if you want to discuss?)
Meanwhile, I did a few calculations based on inputting the numbers as eyeballed from your graphs. The very wide CIs do seem plausible, I also calculated wide 95% CIs with both the normal approx and with bootstrapping ... so I'm not saying you made an error.
As per our conversation, can you please update the text (and add a 'crossout') perhaps to reflect that you have reported the 95% ranges of the observed data and not 95% confidence intervals?
I think it's important to get and state our statistics right, for promoting epistemics, statistical literacy, and an empirically-driven environment among the EA community.
(I really appreciate the work you have done on this by the way)
That's a fantastic outcome, congratulations!
Feedback on the data analysis: I find the 90% confidence interval to not be very informative in some situations. For example in the case of "Computing the ratio of money raised to time spent, we arrive at an average of 786 USD per hour (CI 7 USD to 3,100 USD)", the CI range is very broad and I only really take away 'there was high variance in the data' or 'there weren't many data points' or both. In this situation, it's both and it's relatively clear to see from the figures.
I'm unsure what would be more informative. Maybe a box plot of the direct work hourly rate and your hourly rate calculations could be a good way to visualise the uncertainty. A statistical test to compare the means of the two distributions (direct work and fundraising) could also be interesting but maybe there's too much variance and too few data points in the fundraising data for now.
It would also be interesting to see the maximum and minimum money raised per hour of time values.
Regardless, it's a great result and I look forward to hearing how the 2022 season goes!
Hi Sean, thanks for your comment and your feedback. I think you are correct on both accounts, more data would definitely increase our confidence in the results even further and the distribution has a high variance due to its heavy tailed nature (which is not uncommon when looking at donations data). Good idea also on doing statistical tests to compare distributions.
Thanks for sharing, Federico!
Could you elaborate on how you estimated the counterfactual money raised? In particular, what is your estimate for the counterfactual donations as a fraction of the total donations? The best guess from this model (presented here) is 19.6 % (= E5/K7 from tab "CEA").