Summary
In its cost-effectiveness estimate of StrongMinds, Happier Lives Institute (HLI) estimates that most of the benefits accrue not to the women who receive therapy, but to household members.
According to HLI’s estimates, each household member benefits from the intervention ~50% as much as the person receiving therapy.[1] Because there are ~5 non-recipient household members per treated person, this estimate increases the cost-effectiveness estimate by ~250%.[2] i.e. ~70-80% of the benefits of therapy accrue to household members, rather than the program participant.
I don’t think the existing evidence justifies HLI's estimate of 50% household spillovers. My main disagreements are:
|
I’d guess the spillover benefit to other household members is more likely to be in the 5-25% range (though this is speculative). That reduces the estimated cost-effectiveness of StrongMinds from 9x to 3-6x cash transfers, which would be below GiveWell’s funding bar of 10x.[3] Caveat in footnote.[4]
I think I also disagree with other parts of HLI’s analysis (including how worried to be about reporting bias; the costs of StrongMinds’ program; and the point on a life satisfaction scale that’s morally equivalent to death). I’d guess, though I’m not certain, that more careful consideration of each of these would reduce StrongMinds’ cost-effectiveness estimate further relative to other opportunities. But I’m going to focus on spillovers in this post because I think it makes the most difference to the bottom line, represents the clearest issue to me, and has received relatively little attention in other critiques.
For context: I wrote the first version of Founders Pledge’s mental health report in 2017 and gave feedback on an early draft of HLI’s report on household spillovers. I’ve spent 5-10 hours digging into the question of household spillovers from therapy specifically. I work at Open Philanthropy but wrote this post in a personal capacity. I’m reasonably confident the main critiques in this post are right, but much less confident in what the true magnitude of household spillovers is. I admire the work StrongMinds is doing and I’m grateful to HLI for their expansive literature reviews and analysis on this question.
Thank you to Joel McGuire, Akhil Bansal, Isabel Arjmand, Alex Cohen, Sjir Hoeijmakers, Josh Rosenberg, and Matt Lerner for their insightful comments. They don’t necessarily endorse the conclusions of this post.
0. How HLI estimates the household spillover rate of therapy
HLI estimates household spillovers of therapy on the basis of the three RCTs on therapy which collected data on the subjective wellbeing of some of the household members of program participants: Mutamba et al. (2018), Swartz et al. (2008), Kemp et al. (2009).
Combining those RCTs in a meta-analysis, HLI estimates household spillover rates of 53% (see the forest plot below; 53% comes from dividing the average household member effect (0.35) by the average recipient effect (0.66)).

HLI assumes StrongMinds’ intervention will have a similar effect on household members. But, I don't think these three RCTs can be used to generate a reliable estimate for the spillovers of StrongMinds' program for three reasons.
1. Two of the three RCTs HLI relies on to estimate spillovers are on interventions specifically intended to benefit household members (unlike StrongMinds’ program, which targets women and adolescents living with depression).
I briefly skimmed each of the RCTs, but I haven’t reviewed them in depth.
- Mutamba et al. (2018) delivered psychotherapy to caregivers of children with nodding syndrome (a neurological illness that includes seizures) and modified the typical therapy guidelines with “addition of [nodding syndrome]-specific content”[5]
- Swartz et al. (2008) delivered psychotherapy to depressed mothers whose children have psychiatric illness. It “uses specific strategies to assist mothers in managing problematic interpersonal relationships with their dependent, psychiatrically ill offspring.”[6]
HLI does note limitations to external validity in its report, but concludes it’s not sure whether these differences would lead to an underestimation or overestimation of treatment effects (relative to StrongMinds).
“A limitation to the external validity of this evidence is that all of the samples were selected based on negative shocks happening to the children in the sample... We are not sure if this would lead to an over or underestimate of the treatment effects, but it is potentially a further deviation from the type of household we are trying to predict the effects of psychotherapy for.” Happiness for the Whole Family, 2022
Generalizing across interventions is difficult. But it seems intuitive to me that we should expect the interventions in those studies would benefit household members more than StrongMinds’ intervention, because (a) they were targeted at caregivers of children with psychiatric or neurological illnesses, who I’d expect to be particularly sensitive to the standard of caregiving, and (b) they were specifically designed to help those children.
This seems like the simplest explanation for why these studies were two of the only studies on psychotherapy to measure the effect on household members: because they were actively trying to help household members and so had a reasonable expectation of finding an effect.
A couple of caveats:
- The control group in Mutamba et al. (2018) may have also received a similar level of training in management of children with nodding syndrome. If this were the case, it’d weaken point (b), though point (a) would still stand.[7]
- StrongMinds’ intervention is interpersonal group therapy, which one might expect to also benefit close relationships (and I do expect there’s some positive effect in expectation). But this still seems quite different from the specificity with which the interventions in these two studies were targeted. Other less targeted studies of interpersonal therapy (e.g. Bolton et al. 2003) didn’t measure effects on household members and I assume part of the reason is they didn’t expect to see a measurable effect.
2. Those RCTs only measure the wellbeing of a subset of household members most likely to benefit from the intervention
In its cost-effectiveness estimate, HLI applies the estimated spillover effect to ~five household members for each person treated for depression. But the spillover effect is estimated based on a single household member who seemed most likely to benefit from the intervention.
- Mutamba et al. (2018) treated caregivers and measured the effects on one child with nodding syndrome.[8]
- Swartz et al. (2008) treated mothers and measured the effects on one child receiving psychiatric treatment.[9]
Extrapolating these benefits to the entire household without discounting seems like a stretch to me for the same reasons as outlined above. It seems likely that these children were the household members most likely to benefit from the intervention which was (a) specifically targeted at their caregivers (b) specifically designed to help those children.
3. The results of the third RCT are inconsistent with HLI’s estimate.
In the forest plot above, HLI reports that Kemp et al. (2009) finds a non-significant 0.35 [-0.43,1.13] standard deviation improvement in mental health for parents of treated children.
But table 2 reports that parents in the treatment groups’ score on the GHQ-12 increased relative to the wait-list group (higher scores on the GHQ-12 indicate more self-reported mental health problems). [10]
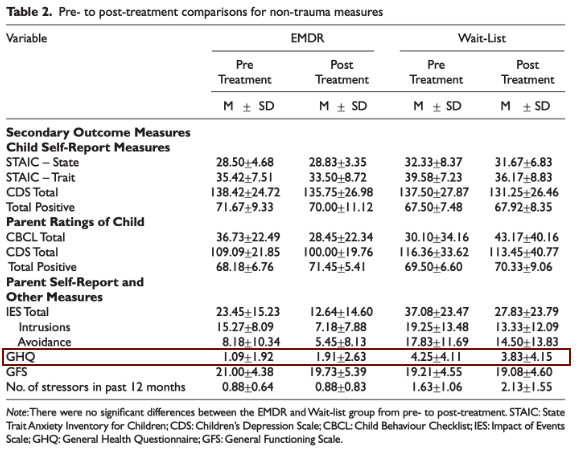
To be clear, I doubt the intervention really did have a negative effect on parents’ mental health; the effect sizes on GHQ are small and far from significant. I looked at GHQ because it seems to be HLI's preferred measure of mental health.[11] But another measure, the Impact of Event Scale (IES) does seem to have declined/improved (non-significantly) more in the treatment than the control group. And another, the General Functioning Scale (GFS) stayed about the same in both groups.
Given the inconsistency of results between different instruments, and the lack of statistical power, I don’t think we can learn much either way about household spillovers from this study.
What would I do if I wanted to get a better estimate of household spillovers from therapy?
My best guess of 5-25% spillovers is very subjective, and largely comes from a combination of adjusting the RCT evidence downwards for some of the concerns above, reflecting on my priors, and a very brief skim of some of some of the observational evidence HLI cites in its report.
If I wanted to get a better estimate, I’d consider:
- More carefully reviewing the observational evidence for associations between familial subjective wellbeing. For example, Das et al. 2008, a cross-sectional study of survey data across five low-and middle income countries, finds “a one standard deviation change in the mental health of household members is associated with a 0.22–0.59 standard deviation change in own mental health,” but notes omitted variable bias probably means this overestimates the causal effect.[12] Other correlational studies find lower associations (5% and 25%),[13] and note that while omitted variable bias might lead to an overestimation of the effect, measurement error might also lead to an underestimation of the effect.[14]
- Looking at evidence for analogous effects. For example, how strong are household spillovers from education?
- Talking to people who participated in StrongMinds’ program and their household members to better understand potential mechanisms for spillover effects.
- Running a larger RCT which measures the impact of therapy on all household members.
- ^
“For psychotherapy, we estimate from three studies the spillover ratio to be 53% (95% CI: 11%, 108%)” Happiness for the Whole Family
- ^
“We use the non-recipient household size, the household size minus the recipient of the intervention. For StrongMinds, we find a non-recipient household size of 4.85 (95% CI: 1.01, 8.94).” Happiness for the Whole Family
- ^
“After including the household spillover effects, we estimate that psychotherapy is 9 times (95% CI: 2, 100) more cost-effective than cash transfers (before it was 12 times).” Happiness for the Whole Family
- ^
HLI has a different perspective on the cost-effectiveness of GiveWell’s top charities (which are mostly focused on life-saving interventions), such that it’s not entirely clear how comparable GiveWell’s funding bar relative to cash is with HLI’s implied funding bar relative to cash.
- ^
Mutamba et al. (2018), Table 1
- ^
- ^
Mutamba et al. (2018), Table 1 suggests the intervention included an adaptation of nodding-syndrome specific content. I’d also guess that in a group setting with a shared experience as specific as caring for a child with nodding-syndrome, that would inform much of the focus of the discussion, even if it wasn’t deliberately included as part of the intervention.
On the other hand, the control group received at least some relevant training. From Mutamba et al. 2018, pg 3 “All health workers at HFs in the study sites received training on the medical management of children with NS. Caregivers in the TAU and experimental-arm villages received usual care as provided for in the national management guidelines for NS (Idro et al. 2013). TAU included health education about NS, syndromic management of children with pharmacological agents (typically sodium valproate or carbamazepine), caregiver education and supportive counselling (Idro et al. 2013).”
- ^
“A child was included if they had NS and a consenting caregiver with them. In families with more than one child with NS (approximately 30%), caregivers were asked to identify one of their children most affected by NS that would participate in the study” Mutamba et al. (2018), pg 2.
- ^
“Children gave informed consent or assent after mothers were deemed eligible for inclusion. If multiple children were eligible, the mothers were asked to designate one child participant.” Swartz et al. (2008)
- ^
“Despite random allocation to group, wait-list parents reported higher self-reported health problems on the GHQ – 12” Kemp et al. (2009)
- ^
“Kemp et al. (2009)... the parents’ (who did not receive therapy) mental health was measured with the 12-items General Health Questionnaire (GHQ-12). There was a significant difference in GHQ-12 levels between control and treatment group parents, so we used the difference of differences between baseline and post-treatment to adjust for this.” Happiness for the Whole Family
- ^
“There are several possible channels for such a correlation. It may reflect omitted household variables, such as household-specific shocks or a lack of health services. It could also reflect unobserved individual traits, if assortative mating leads those with poor mental health to marry and perhaps pass on genetic factors influencing mental health of other family members. But it is also plausible that the presence of one household member with poor mental health creates a poor mental health environment for other household members, a “contagion” effect.” (Das et al. 2008)
- ^
Powdthavee and Vignoles 2008, a study in the UK, finds a one standard deviation increase in parents' mental distress in the previous year is associated with 25% of a standard deviation lower life satisfaction in the current year for girls “Given that the mean of LS for girls is 5.738 and its standard deviation is 1.348, a ceteris paribus increase of one standard deviation in either parent’s mental distress level explains around a 25% drop in the standard deviation in the girl’s LS.”
Mendolia et al. 2018, a study in Australia, finds a one standard deviation increase in partner’s life satisfaction is associated with 5% of a standard deviation increase in individual life satisfaction “In Table 7, we begin with the analysis of the impact of the partner’s standardised SF36 mental health score (0-100, where higher values represent higher level of well-being). Increasing this score by one standard deviation increases individual’s life satisfaction by 0.07 points (on a 1-10 scale), which is equivalent to 5% of a standard deviation in life satisfaction. To put this in context, this is similar to the (reversed) effect of becoming unemployed or being victim of a property crime (see Table 10).” Mendolia et al. 2018
- ^
Powdthavee 2009: “In addition to the above confounding influences which make it difficult for the true relationship between partners’ well-being to be identified, the estimates of spousal correlation in LS may also suffer from the negative measurement error bias. There may be, for example, a tendency for individuals to misreport their true LS in surveys. The low signal-to-noise ratio caused by misreporting can result in an estimated coefficient on partner LS that is biased towards zero in a large sample. In short, because there are both positive (correlated effects) and negative (measurement error) biases involved, the direction of bias is unclear on a priori ground.”
James courteously shared a draft of this piece with me before posting, I really appreciate that and his substantive, constructive feedback.
1. I blundered
The first thing worth acknowledging is that he pointed out a mistake that substantially changes our results. And for that, I’m grateful. It goes to show the value of having skeptical external reviewers.
He pointed out that Kemp et al., (2009) finds a negative effect, while we recorded its effect as positive — meaning we coded the study as having the wrong sign.
What happened is that MH outcomes are often "higher = bad", and subjective wellbeing is "higher = better", so we note this in our code so that all effects that imply benefits are positive. What went wrong was that we coded Kemp et al., (2009), which used the GHQ-12 as "higher = bad" (which is usually the case) when the opposite was true. Higher equalled good in this case because we had to do an extra calculation to extract the effect [footnote: since there was baseline imbalance in the PHQ-9, we took the difference in pre-post changes], which flipped the sign.
This correction would reduce the spillover effect from 53% to 38% and reduce the cost-effectiveness comparison from 9.5 to 7.5x, a clear downwards correction.
This is how the forest plot should look.
2. James’s other critiques
I think James’s other critiques are also pretty reasonable. This updates me towards weighting these studies less. That said, what I should place weight on instead remains quite uncertain for me.
I’ve thought about it a bit, but I’m unsure what to make of the observational evidence. My reading of the observational literature mostly accords with James (I think), and it does appear to suggest smaller spillovers than the low quality RCTs I previously referenced (20% versus the now 38%). Here's a little table I made while doing a brief review during my discussion with James.
0.00%
0.00%
25%[1]
5.25%
7.00%
25%
22.50%
30.00%
25%
3.75%
5.00%
25%
10.00%
40.00%
50%[3]
7.88%
10.50%
14.00%
25%
12.00%
16.00%
25%
43.50%
58.00%
25%
40.00%
40.00%
50%
16.50%
33.00%
50%
24.50%
20.34%
31.50%
35.00%
10%
35.00%
35.00%
0%
34.00%
34.00%
0%
60.00%
60.00%
0%
40.13%
63.00%
63.00%
0%
63.00%
57.28%
However, I wonder if there’s something about the more observational literature that makes household spillovers appear smaller, regardless of the source. To investigate this further, I briefly compared household spillovers from unemployment and mental health shocks. This led me to an estimate of around 57% as the household spillover of unemployment, which I think we could use as a prior for other economic shocks. This is a bit lower than the 86% I estimated as the household spillover for cash transfers. Again, not quite sure what to make of this.
3. Other factors that influence my priors / fuzzy tummy feelings about psychotherapy spillovers.
4. What’s next?
I think James and I probably agree that making sense out of the observational evidence is tricky to say the least, and a high quality RCT would be very welcome for informing our views and settling our disagreements. I think some further insight could come sooner rather than later. As I was writing this, I wondered if there was any possibility of household spillovers in Barker et al., (2022), a recent study about the effects of CBT on the general population in Ghana that looked into community spillovers of psychotherapy (-33% the size of the treatment effect but non-significant – but's that's a problem for another time).
In section 3.2 the paper reads, "At the endline we administered only the “adult” survey, again to both the household head and their spouse… In our analysis of outcomes, we include the responses of both adults in control households; in households where an individual received CBT, we only include treated individuals.’"
This means that while Barket et al. didn’t look into it we should be able to estimate the spousal mental health spillover of having your partner receive CBT. In further good news, the replication materials are public. But I’ll leave this as a teaser while I try to figure out how to run the analysis.
Why a 25% discount? I guess partners are likelier to share tendencies towards a given level of wellbeing, but I think this "birds of a feather" effect is smaller than the genetic effects. Starting from a 50% guess for genetic effects (noted in the next footnote), I thought that the assortative mating effects would be about half the magnitude or 25%.
How did I impute the parent/child effect? The study was ambiguous about the household relations being analysed. So I assumed that it was 50-50 parents and children and that the spouse-to-spouse spillover was a 1/4th that of the parent-to-child spillover.
Why a 50% discount? There appears to be an obvious genetic factor between a parent and child’s levels of wellbeing that could confound these estimates. Jami et al., (2021) reviews ~30 studies that try to disentangle the genetic and environmental link between families affective mental health. My reading is that environmental (pure contagion) effects dominate the anxiety transmission, and genetic-environmental factors seem roughly balanced for depression. Since we mostly consider psychotherapy to treat depression, I only reference the depression results when coming up with the 50% figure.
“When positive posts were reduced in the News Feed, the percentage of positive words in people's status updates decreased by B = −0.1% compared with control [t(310,044) = −5.63, P < 0.001, Cohen's d = 0.02], whereas the percentage of words that were negative increased by B = 0.04% (t = 2.71, P = 0.007, d = 0.001). Conversely, when negative posts were reduced, the percent of words that were negative decreased by B = −0.07% [t(310,541) = −5.51, P < 0.001, d = 0.02] and the percentage of words that were positive, conversely, increased by B = 0.06% (t = 2.19, P < 0.003, d = 0.008).
Strong upvote for both James and Joel for modeling a productive way to do this kind of post -- show the organization a draft of the post first, and give them time to offer comments on the draft + prepare a comment for your post that can go up shortly after the post does.
Given that this post has been curated, I wanted to follow up with a few points I’d like to emphasise that I forgot to include in the original comment.
I still don't have the Barker et al. RCT spillover results, but will update this comment once I know.
Is it as easy (or easy enough) to enroll participants in RCTs if you need their whole household, rather than just them, to consent to participate? Does it create any bias in the results?
I'd assume that 1. you don't need the whole household, depending on the original sample size, it seems plausible to randomly select a subset of household members [1](e.g., in house A you interview recipient and son, in B. recipient and partner, etc...) and 2. they wouldn't need to consent to participate, just to be surveyed, no?
If these assumptions didn't hold, I'd be more worried that this would introduce nettlesome selection issues.
I recognise this isn't necessarily simple as I make it out to be. I expect you'd need to be more careful with the timing of interviews to minimise the likelihood that certain household members are more likely to be missing (children at school, mother at the market, father in the fields, etc.).
I for one really appreciate (1) that HLI has been producing these reports and generally directing EAs' attention to well-being interventions, (2) the discussion this has generated (in particular OP and this critique), and (3) HLI's willingness to respond to, and occasionally, as evidenced here, to some degree update based on, those critiques.
Nice analysis I agree. Seems hugely overweighted both instinctively and from the evidence.
As a side note, I'm feeling like Strongminds and HLI analysis has taken a perhaps out-of-proportion level of criticism of late (from me included). Not to say that the criticism isn't important, but perhaps we should be having more of a hack at some of Givewell's (or others) analysis as well. It may well be largely because HLI are so active on the forum which is great, and lay out their analysis pretty clearl. I would love for Givewell to post their fresh Analysis step by step on the forum as well sometimes - I genuinely find their analysis quite hard to understand and therefore hard to criticise too. Maybe I'm missing the place where they lay out their analysis step by step?
Or maybe the amazing quality analysis of Godly Givewell soars beyond us mere mortals and is beyond reproach ;) (full jokes, I know they even pay people to criticise their approach).
I think you're in part picking up on a difference between what GiveWell publishes and what HLI publishes. In terms of money influenced, the most analogous GiveWell outcomes are probably grants from its All Grants Fund in the single-digit millions range, [1] rather than its Top Charities designations. There is a writeup for each grant, but for most of them there isn't a published analysis that has anywhere near the depth of what HLI has put out for StrongMinds.
That isn't a criticism of GiveWell; it is not recommending that individual donors give to organizations that receive grants (but are not Top Charities). In other words, GiveWell seeks to explain its decisions for its grants; HLI necessarily seeks to persuade donors to act in accordance with its recommendations. So it makes sense that GiveWell doesn't devote the significant resources necessary to make its more detailed internal work product ready for public consumption for most non-Top Charities.
But the upshot is that we can't compare apples to apples in a particular sense. In particular, we can't compare detailed analysis that GiveWell currently thinks is solid enough to move single-digit millions counterfactually to HLI's analysis that I expect would influence a similar level of money moved.
It is possible that HLI thinks the current StrongMinds analysis is solid enough to move tens or hundreds of millions of dollars counterfactually. However, for purposes of this comment, I am assuming a single-digit millions range based on my (uninformed) best guess of how much funding HLI's recommendation might counterfactually drive over the next few years. Thus, I think it is fairest to evaluate HLI's analysis on that basis.
This research and this response are excellent. I might try to write something longer later, but I'm curating it.
I also agree with and want to highlight @Jason's comment: