Summary
- U.S. poverty is deadlier than many might realize and worse than most wealthy countries.
- The U.S. spends $600B/year on poverty interventions, and many are less effective than they could be because of poor design.
- The work of GiveDirectly U.S. and others aims to improve how government poverty programs are designed and administered, in effect making that $600B/year do more good.
- While a dollar to a U.S. cause has less impact by EA-merits than giving to an international one, we should have a similar debate on the effectiveness of U.S. causes for those already giving domestically.
Author: Laura Keen, Senior U.S. Program Manager at GiveDirectly
NOTE: This post is specific to GiveDirectly’s work in the U.S., which is run by dedicated U.S. staff and funded by U.S.-restricted donations. Donations to GiveDirectly only fund our international work unless expressly given through our U.S. page→
Poverty in the U.S. causes over 180,000 deaths a year, 10x more than homicides
We all agree that poverty is bad, and it causes human suffering on multiple dimensions. Here I will focus on only one dimension: death.
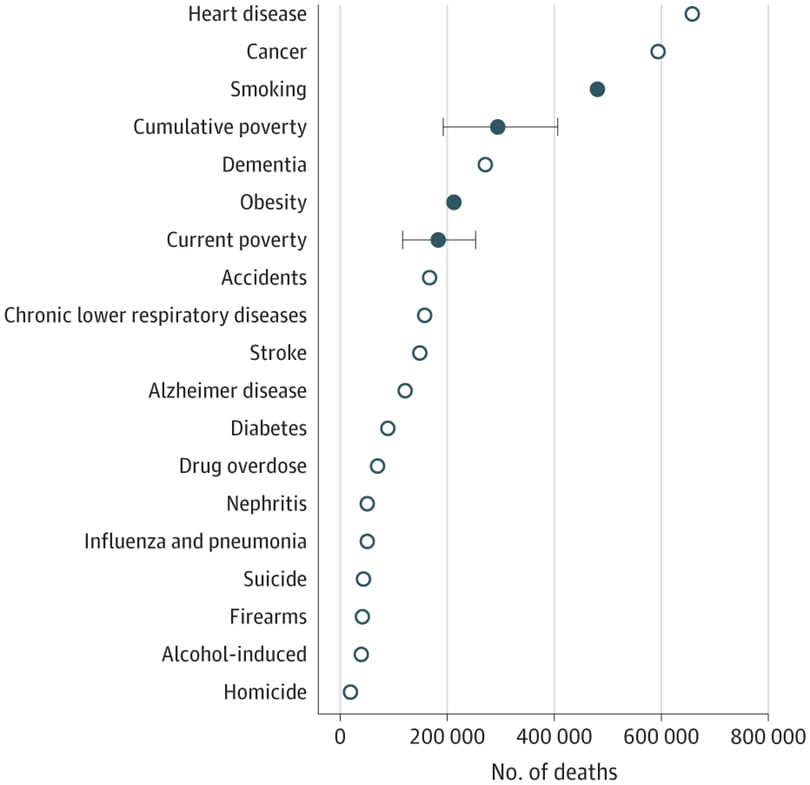
Poverty in the U.S. is deadly. In 2019, poverty produced 183k deaths in the U.S. among people 15 years and older. That’s 10x as many as homicides, nearly 5x as many as firearms, nearly 4x as many as suicide, and 2.6x as many as drug overdoses. Being in poverty today is much more highly associated with death than causes that often get far more attention from the media and policy-makers.
Number of deaths associated with cumulative and current poverty in the U.S. in 2019
Child mortality in U.S. is nearly 2x that of other rich countries
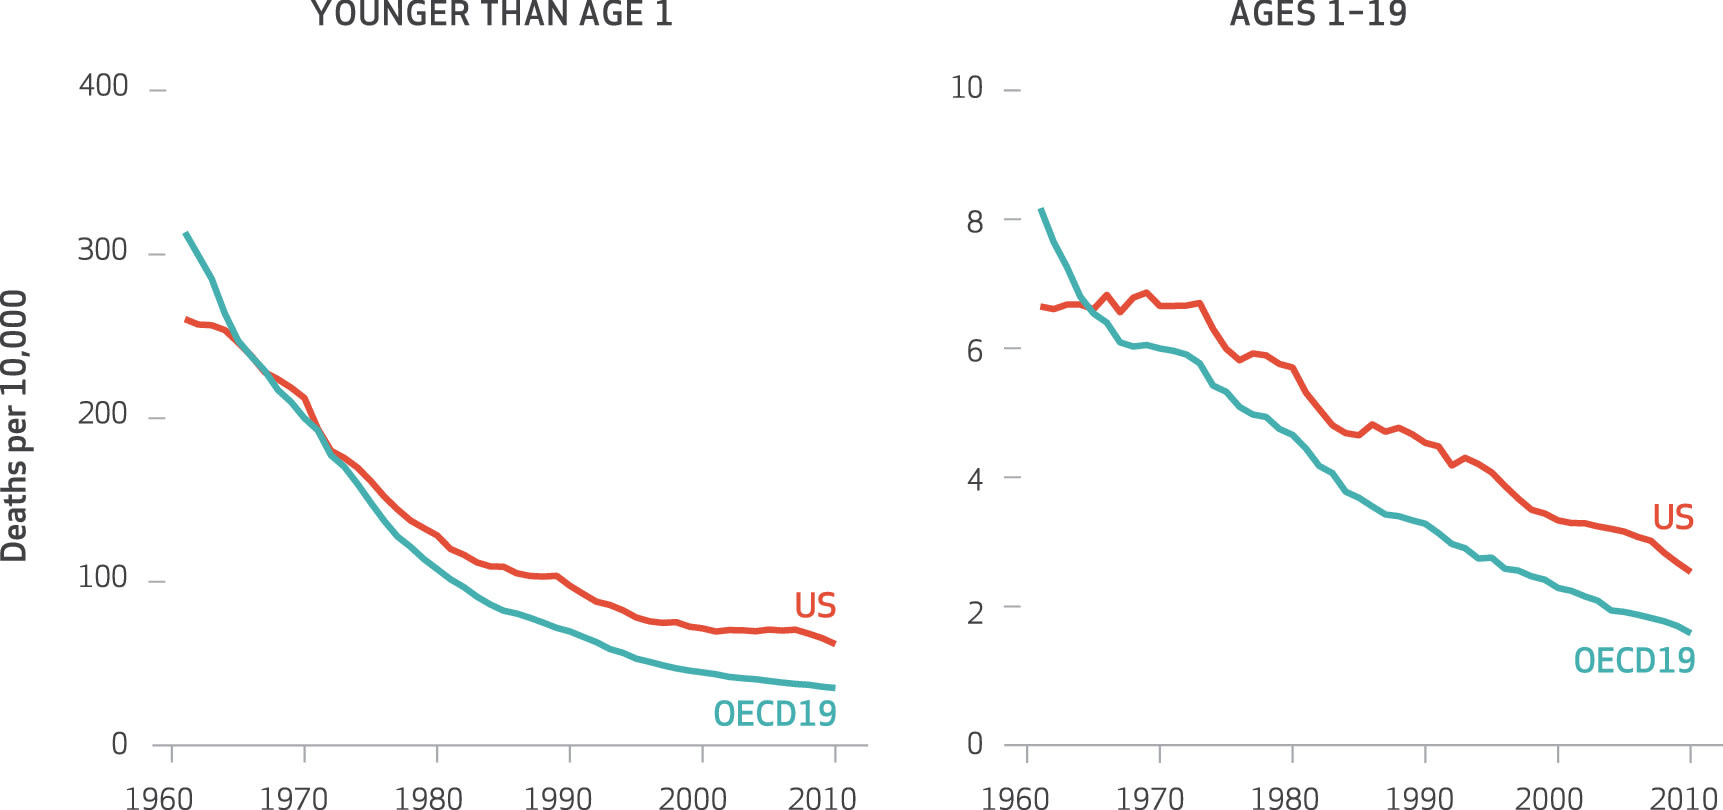
Let’s look at another example: child mortality. Researchers compared infant and child mortality in the U.S. with that of 19 wealthy peer nations.
Child mortality in the US vs other wealth countries (OECD19), 1960-2010
The data above reveal some laudable achievements.
- Overall, child mortality decreased significantly between 1960 and 2000.
- Three-quarters of the reduction happened between 1960 and 1980, coincident with the introduction of the War on Poverty, which included programs like food stamps, housing assistance, and healthcare for the poor.
However, in recent years infant mortality rates in the U.S. rate have diverged from our peer nations.
- In the first decade of the 2000s, U.S. infants (under 1) faced a 76% greater risk of death than the average across our wealthy peer nations. Children up to 19 faced a 57% greater risk.
- Over the 50-year study period, 600k deaths could have been avoided if we had reached just the average mortality rate of our wealthy peer nations, or approximately 20k deaths per year.
The U.S. has one of the highest poverty rates in of any wealthy country, despite above-average spending
There’s compelling evidence that poverty in the U.S. causes death. But how prevalent is poverty here?
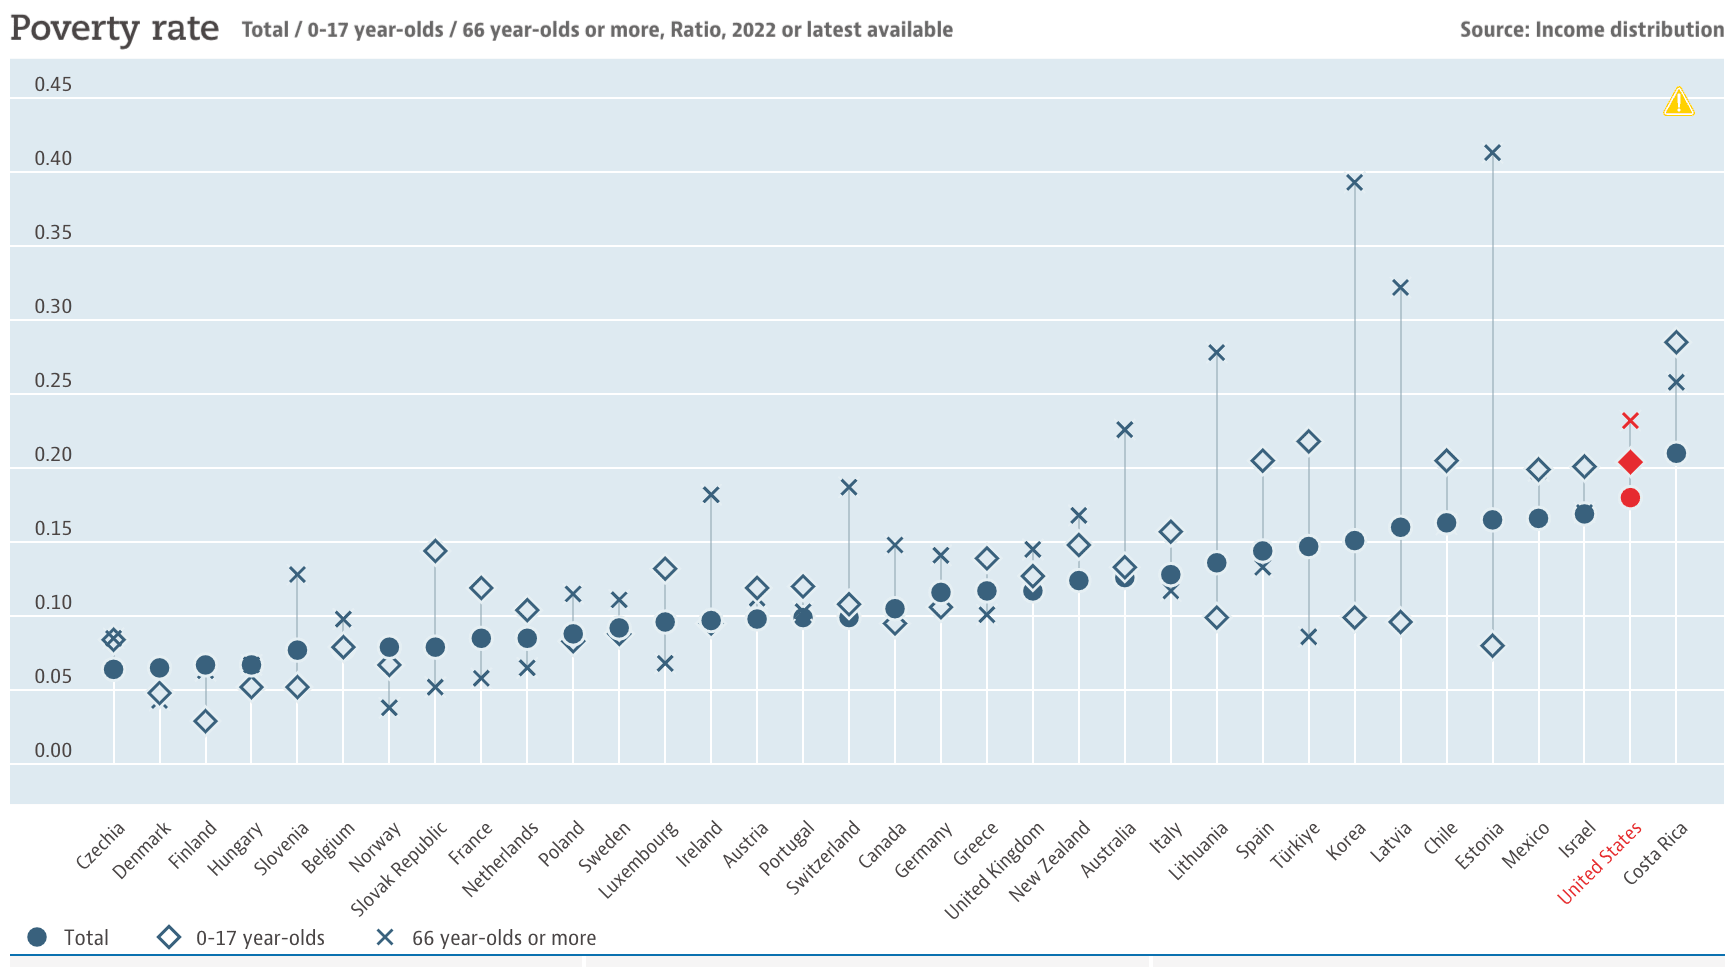
- In 2022, the U.S. had the second highest poverty rate of any wealthy country (see below).
- Another measure is the U.S. deep poverty line, which is defined as living on less than half the federal poverty line. In 2022, that equated to less than $600 a month for a single adult or about $20 per day. In the richest country in the world, 19.8M Americans attempt to cover food, shelter, clothing, transportation, and medicine every day with a single twenty dollar bill.[1]
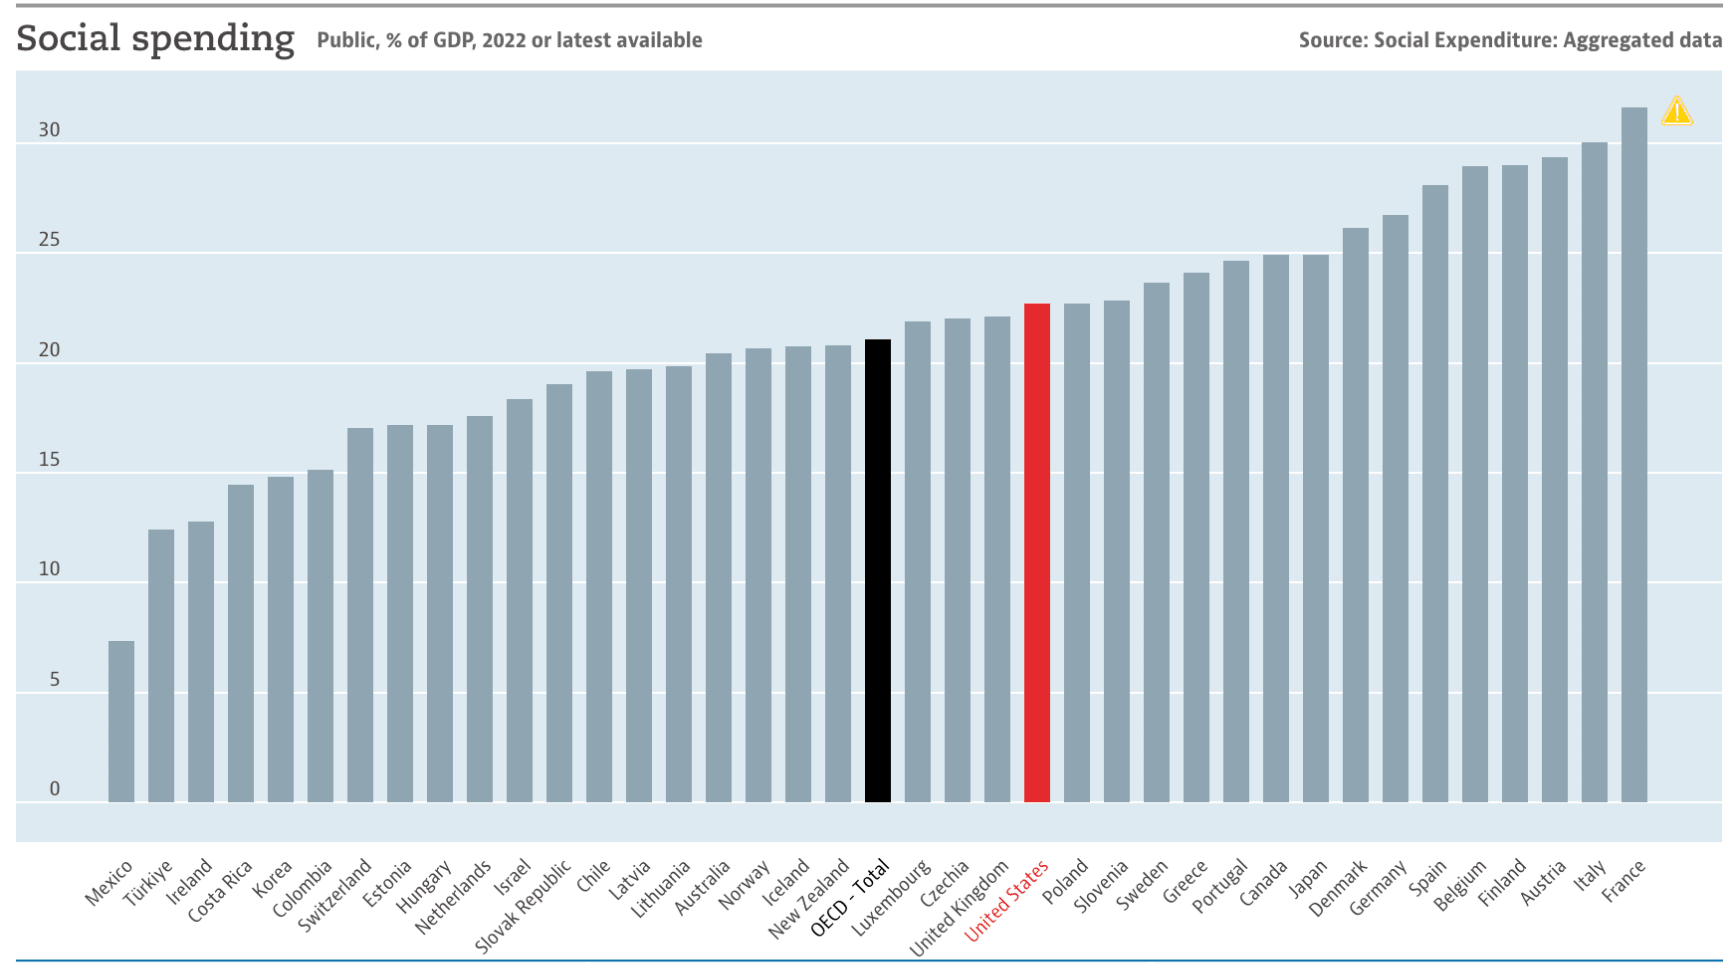
Maybe other wealthy countries are spending more to fix poverty? Not the case – poverty persists here despite the U.S. spending more on social programs than the average (see below).
U.S. social spending is less effective due to bureaucratic burden and restrictions
Annual U.S. welfare spending surpasses $600B, more than all US philanthropic giving and 12x more than the entire 2023 budget of USAID.
Why is poverty so intractable here if we're spending so much to reduce it? Many benefits included in this $600B category of welfare are incredibly difficult to access, are conditioned on work or other life circumstances, and are significantly restricted.
The excessive bureaucratic burden means qualified families do not enroll or drop out, which is sometimes the goal.
- Over a quarter of Americans living in deep poverty (again, less than half of the federal poverty line) are not enrolled in any federal safety net program. That means individuals making less than $7,530 a year are receiving no assistance from the government. [Author note: Yearly poverty stat edited 5/9 to correct error].
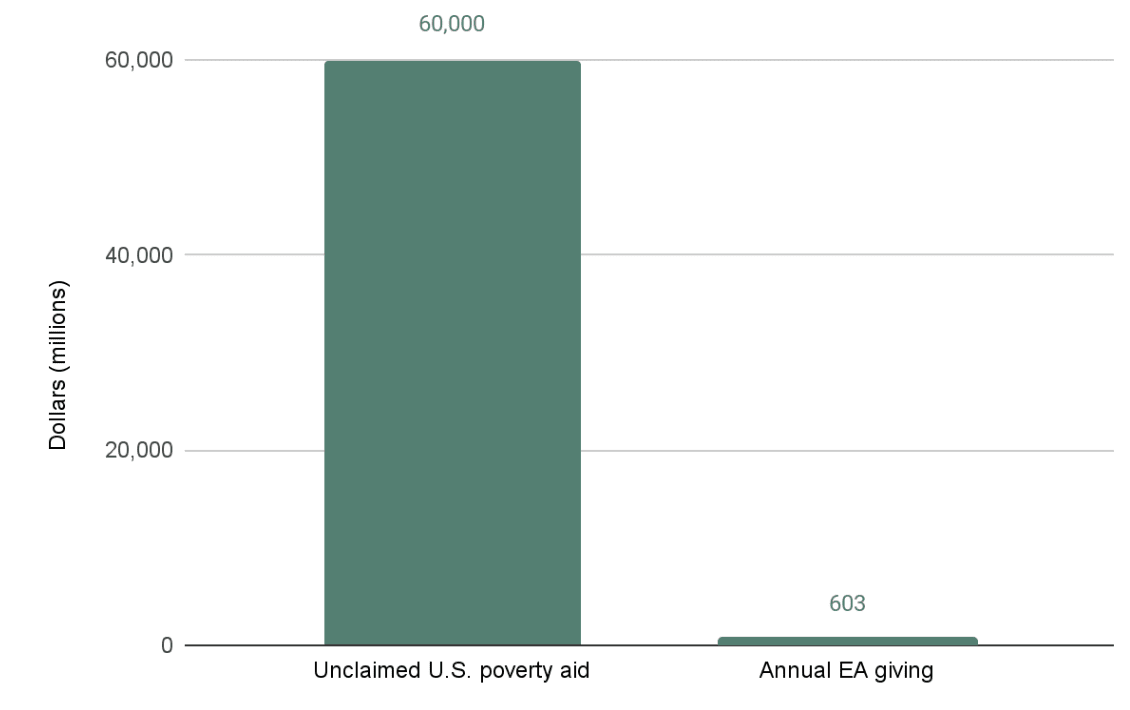
- Experts estimate $60B of poverty aid goes unclaimed every year largely because of how these programs are structured.[2] For a sense of scale, that is 67x more than 2022 EA charitable giving.
- Only half of those eligible for the Women, Infants, and Children (WIC) program receive it. Once enrolled, the program is so restrictive that families leave money on the table – only about 73% of available WIC credits are claimed annually. (Example of restrictions).
U.S. poverty programs would be more effective if they were more accessible and ‘cash-ier’
Evidence shows direct-cash programs are better at reducing suffering for people in poverty
But it could be different. Evidence suggests that more accessible programs that look more like unconditional cash would reduce human suffering and improve the lives of Americans in poverty.
A decades-long study looked at mothers who received cash welfare payments averaging 10% of their annual income, and the children of recipients were half as likely to be underweight, earned 14% more as adults, and lived a year longer, on average, than children of mothers who were rejected from the program.
Results from the pandemic-era programs show large drops in poverty thanks to cash assistance
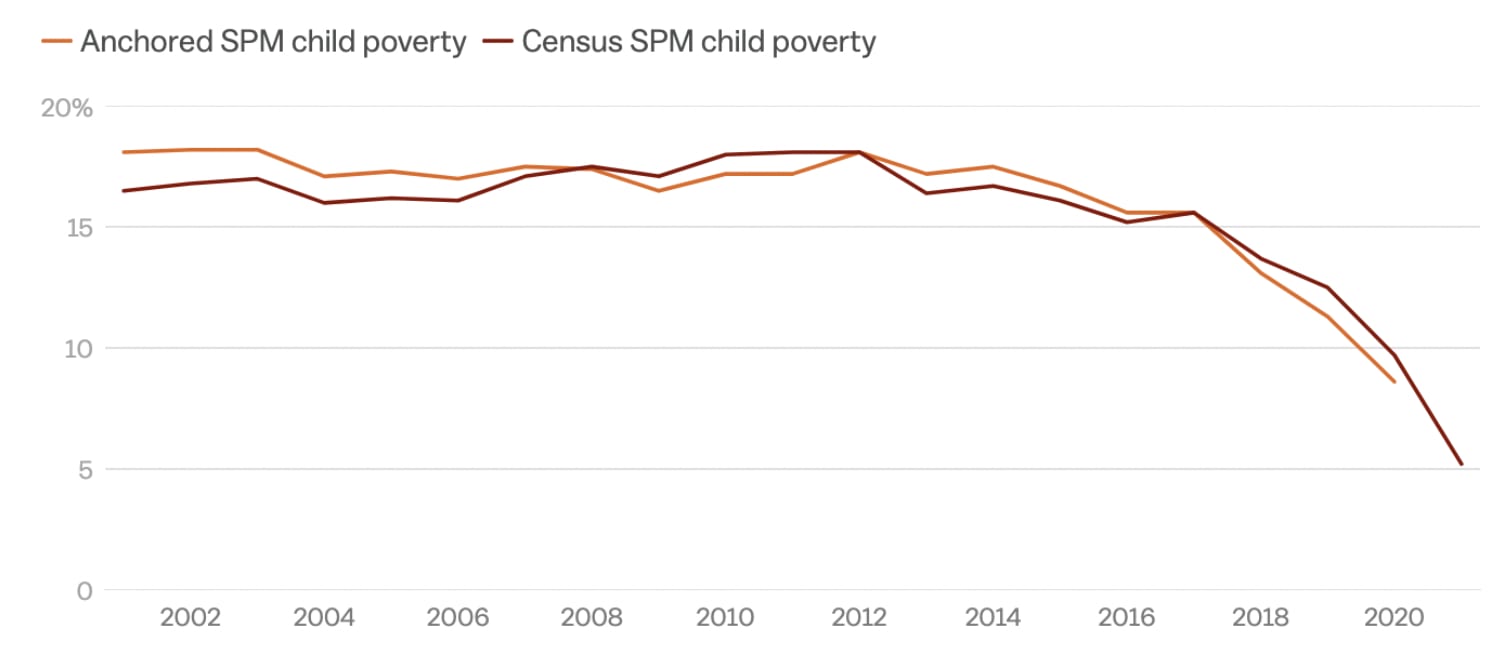
We can look to the pandemic for more evidence. Child poverty rates here had been relatively stagnant since about the end of the 1990s, and then something unexpected happened. In 2021, the child poverty rate dropped to a record low of 5.2%.
How did this happen? Facing a potential recession and soaring unemployment due the pandemic, the federal government temporarily infused the social safety net with cash.
U.S. households received three rounds of stimulus checks, expanded unemployment assistance, and, in 2021, the expanded child tax credit, which sent six small monthly cash payments to most families with children.
Between 2020 and 2021, government spending pulled 5.5M children out of poverty. Furthermore:
- The percent of households with children reporting they had insufficient access to food decreased by 40%.
- Adults reporting symptoms of depression dropped by 20%.
- More than two-thirds of adults said they could cover an unexpected cost of $400, the highest rate recorded in the survey’s history.
Yet, just a fifth of U.S. social spending is given as cash[3]
A particularly frustrating example: The only cash-based safety net program, Temporary Assistance for Needy Families (TANF), is utilized at the lowest rates in three decades with only one-fifth of families living in poverty accessing it. States have discretion on how to use their TANF block grant funds, and many have significantly limited cash welfare payments. As a result, despite it being the primary available source of cash assistance for the poor, 78% of TANF funds are spent on non-cash services.
Programs that give cash benefits are 10x more efficient
These programs are burdensome and dehumanizing, which also contributes to them being ineffective. Assessing compliance with arcane eligibility criteria makes these relatively expensive to operate.
- Programs like WIC and TANF that are not administered through the tax system spend about 10% of their annual budget on administrative costs.
- Compare that with 1% overhead for those that are administered through the tax system.
GiveDirectly’s fight in the U.S. is to change government spending via demonstrations of high quality cash programs
With this in mind, I argue that the U.S. country team at GiveDirectly, the organization where I work, has a big fight to win to change government spending.
There are already laudable examples of improvements underway. In 2021, President Biden signed an Executive Order that seeks to improve government service delivery and customer service. Included are efforts to streamline benefit enrollment and renewal processes and to reduce administrative burden. Additionally, in 2024 the federal government established a new Resilient Families Hub to harness lessons of direct cash.
To help accelerate reforms like these and make them more ambitious, we use public and private philanthropic donations toward exemplary U.S. programs and research.
Here are some of the ways GiveDirectly is seeking to improve how this massive pot of government money is spent:
- Our guaranteed income programs with the City of Chicago and Cook County, IL, funded by the American Rescue Plan Act, have allowed us to showcase that public benefits can be delivered equitably, accessibly, and unconditionally. Each is paired with a randomized control trial (RCT) to identify the effects of monthly cash payments on outcomes like economic stability and wellbeing.
- This year with our partners we launched RxKids, the nation’s first citywide effort to tackle the leading social determinant of health: poverty. Every pregnant individual in Flint will receive $1,500 during their pregnancy and $500/month for the first year of their baby’s life. $16.5M in funding will come from a TANF block grant agreed to by the Michigan legislature, creating a model for how government cash can address infant poverty.
- Finally, we are seeking to partner with a government actor focused on benefits reform to benchmark an existing safety net program like SNAP or housing vouchers to an equivalent amount of unconditional cash to generate evidence about the relative efficiency and efficacy of cash versus a more conditioned and restricted benefit.
The research components of these programs will add to the relatively small pool of evidence on the impact of cash in high income countries, helping inform better policy design. In their totality, these efforts will help to improve our imagining of the social safety net.
This fight will not be easy, as resistance to these improvements is strong. The recent political battle over Houston’s guaranteed income pilot underscores a concerning trend of states preempting the use of direct cash aid.
Effective Altruists should evaluate and recommend U.S. causes
EAs regularly weigh the merits of organizations addressing animal welfare, human development, and existential risks, yet rarely do the same for U.S causes.
This is an oversight. EA relies on a foundational thought experiment: “if you came across a drowning child, wouldn’t you save it?” “Of course!” we cry. “Then why not save a dying child elsewhere?” But this thought experiment underscores a powerful cognitive bias towards helping those in our vicinity before those we cannot see. While EA seeks to overcome that bias, it would be foolish to think it will ever be eliminated:
- Evidence shows that people prefer causes that address issues their friends and family have been impacted by.
- They also perceive local donations to have greater impact than donations to faraway causes.
- In response to U.S. disasters, 48% of donors were motivated to give by a connection to the location or individuals affected.
We should all be aware that absolutism against ever donating to local causes will not expand the tent of EA, but merely creates a strawman for people to write off the community ideas as narrow minded and illiberal.
Many American EAs also give domestically, yet have few sources to draw on for assessing effectiveness
Ask among your network of EAers and I bet you’ll find they view their giving as a portfolio. They give some portion to highly rated global poverty inventions, perhaps some to AI-safety, but they also donate to political campaigns, religious organizations, and still manage to invest in tasteful amenities for their Burning Man camps.
In each of these areas, they want to give to the most effective option. Yet peruse EA fora and you’ll struggle to find examples of EA expanding its tent to encompass other areas.[4]
This is not an aim to prove GiveDirectly U.S. to be the most effective domestic cause. The process of weighing evidence may identify even better interventions. It’s merely an ask for a considered debate.
We can direct $165B in domestic giving to more effective causes[5]
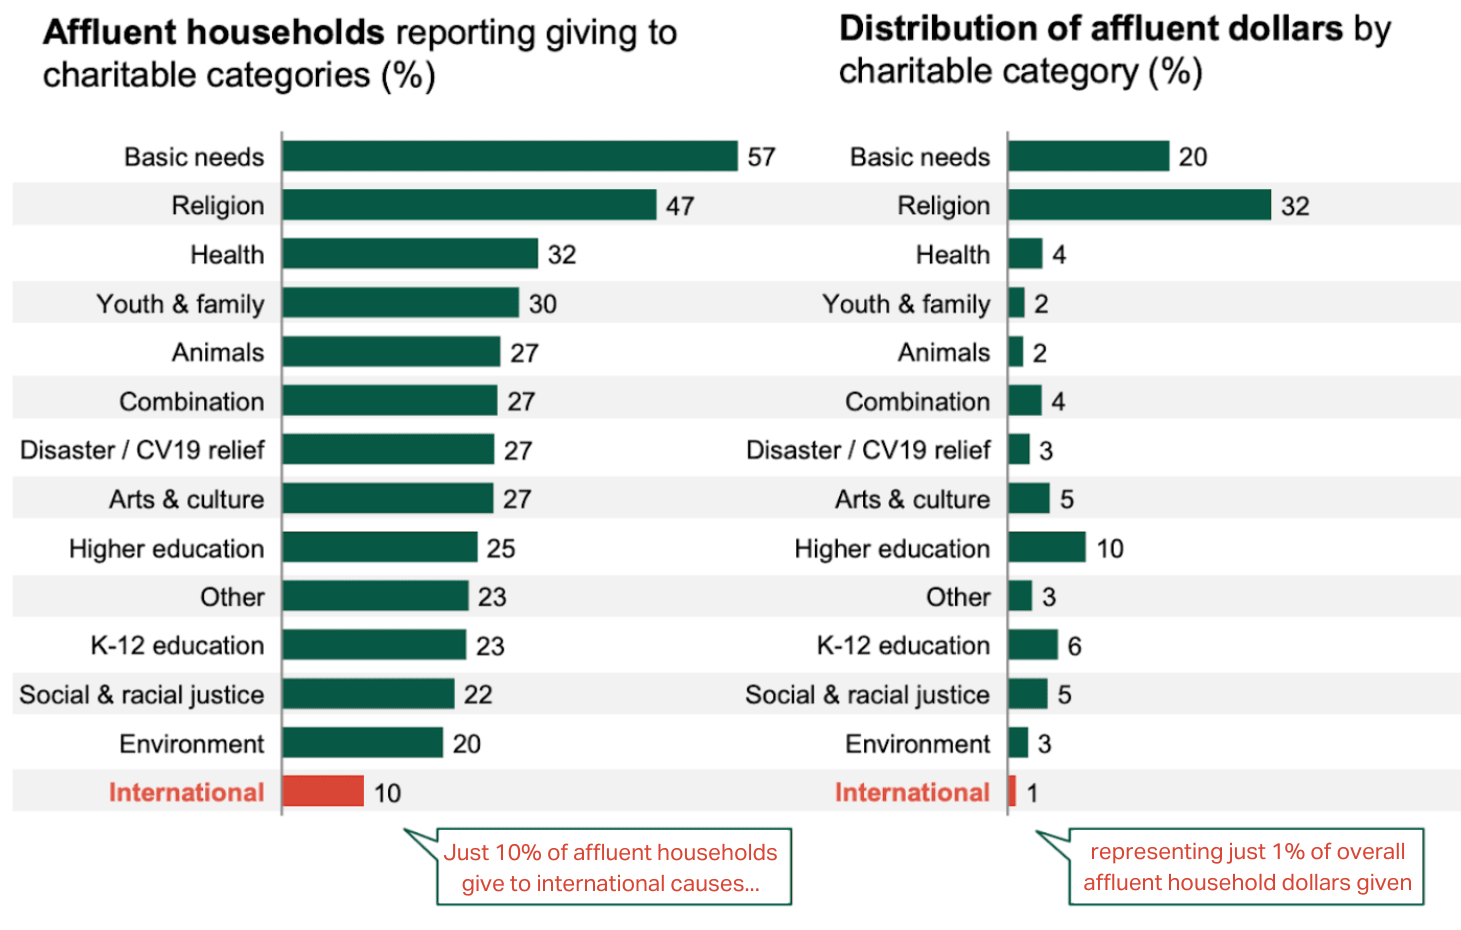
Major American philanthropists mostly give to domestic causes. Limiting EA-endorsed poverty-relief options to international work means you stand to influence a measly 1% of charitable giving from affluent Americans:
Two-thirds of U.S. households donate to charity every year. If EA can weigh up and recommend U.S. causes as well, you’d invite more of them in and grow the tent. Using the example of GiveDirectly, we launched a U.S. COVID-19 response in 2020 that attracted 20,379 new donors. Nearly 3k of them then went on to give over $70M to our international work in 2021. That was more than we had raised in any prior year.
I’m not suggesting that funding U.S. work should be used as a hook to lure others to EA causes. Rather, I'm suggesting that any group that seeks to change how people give to charity should speak to as wide a range of effective options as they can. Otherwise, you create your own ceiling. There are tens of billions of additional dollars that EA has the power to influence, if only it would apply its well-known rigor to US interventions.
Appendix: Dying from COVID-19 was more common in poor U.S. counties
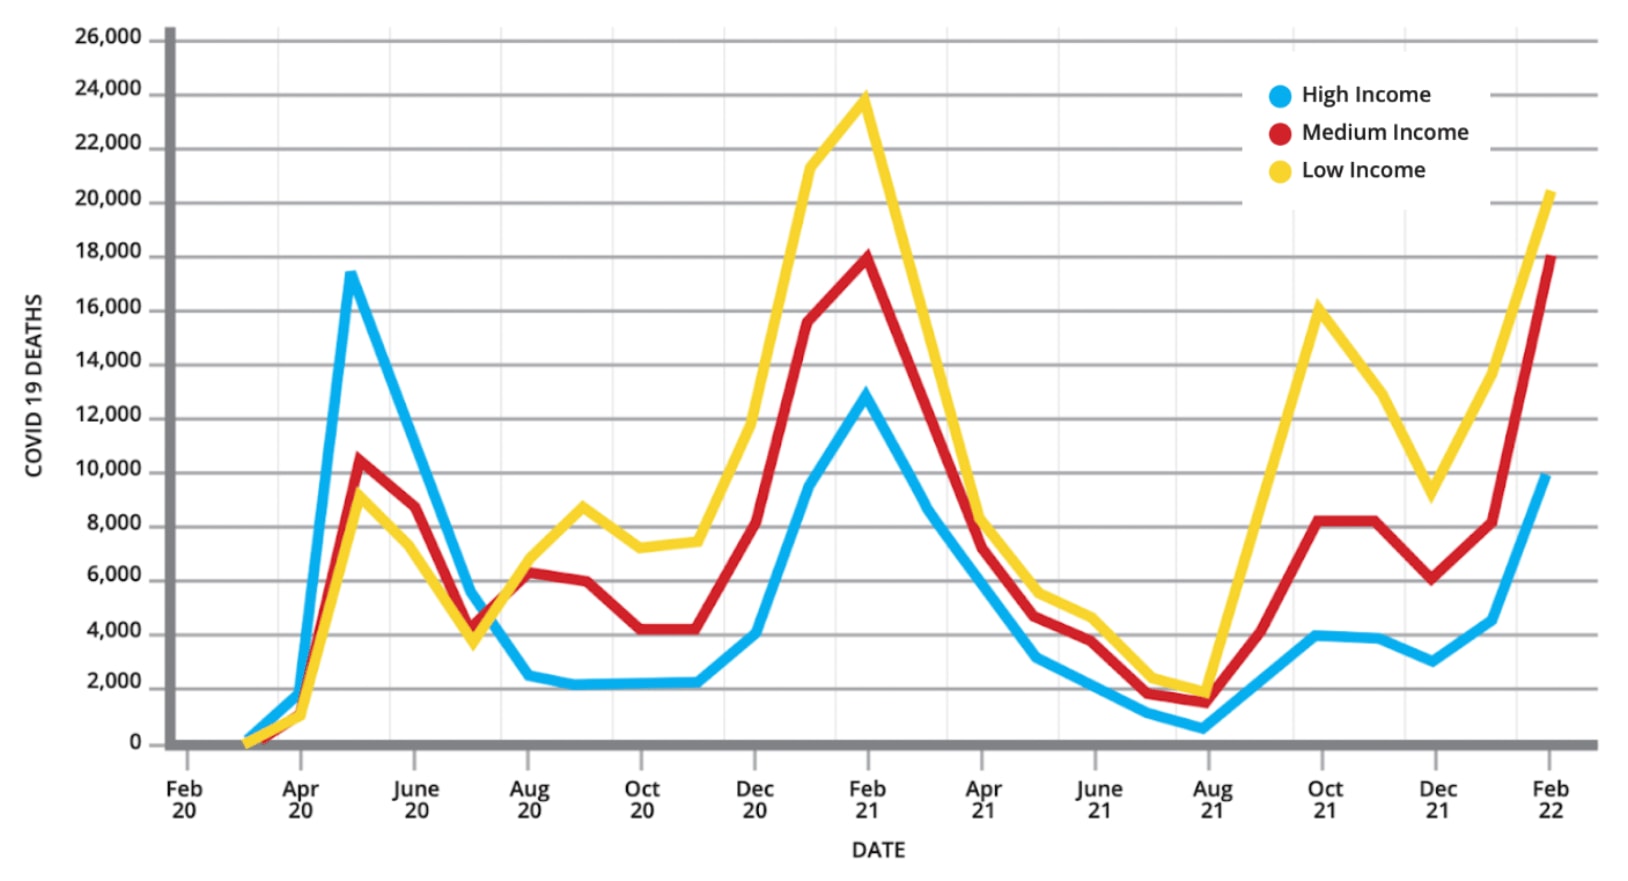
Researchers broke all US counties up into deciles based on median income, with roughly the same population in each group. They found that poorer U.S. counties had twice the death rate from COVID-19 than richer counties. This was true at every stage of the pandemic except the very beginning.
While it’s true that average vaccination rates are generally higher in high-income counties than in middle- and low-income counties, the differences in vaccination do not explain all the variation in death rates. In almost every decile, vaccine coverage by county varied from less than 5% to over 85%. In addition, more than 50% of people in the poorest counties had received two vaccine shots. The more likely culprit the researchers identify is that the poorest counties had double the population of uninsured.
COVID-19 deaths by county income level
- ^
Wait a minute, the Official Poverty Measure (OPM) doesn’t account for government benefits! That’s true. Another poverty statistic is the Supplemental Poverty Measure (SPM), which accounts for variable living costs and factors government benefits into its estimate. In 2022, the percentage of people living in poverty according to the SPM was nearly 1 point higher than the OPM estimate, meaning citing the OPM here is not overstating the scale of poverty
- ^
Benefits Trust estimates $80B in safety net funding goes unclaimed every year, while the researcher Mathew Desmond puts the number as high as $142B.
- ^
I summed Supplemental Security Income, cash-based expenditures of Temporary Assistance for Needy Families, and Unemployment Insurance and divided by total welfare spending, which is 19%.
- ^
There is some discussion on specific U.S. cause areas including addiction treatment, gun control, mass incarceration, education, & animal welfare.
- ^
Giving USA’s estimate of U.S. charitable giving restricted to human services, health, public-society benefits.
Cool article! I enjoyed reading it. Seems like a great way to apply effective altruism style thinking into a different cause area.
My main takeaway from this is currently domestic aid is not neglected but highly ineffective. Making something that already has lots of resources going into it (and a lot more people willing to put resources into it) much more effective can be extremely impactful.
I'm curious how likely it is for US domestic aid to be a lot better given that a lot of people care about making it go well / political resistance.
Thanks again for this article!
I agree with and appreciate the core premise, that since many donors give to primarily U.S. charities, as a community we should spend more effort on research to what effective causes are. I also agree that making the transfers more cash based and less beaurocratic is tractable and potentially high impact. However, I would like to note some flaws in this article.
the percent of spending on social programs is pegged at 23% of gdp. I suspect this must include social security and potentially other non discretionary and non need based public spending. 23% is much greater than the $600b figure used throughout the article. So it is misleading to equate these two numbers. Much of social security money does not go towards addressing poverty.
saying cash transfer is 10x as effective because it spends 1% on administration instead of 10% is extremely misleading. Using the amount of money given to people as the metric, it is 0.99/0.9=1.1x as effective, an extremely different number.
I am actually surprised administration fees are only 10%. This indicates to me that these programs are more cost effective than I would have otherwise assumed.
Thanks for reading the piece and for taking the time to leave feedback.
The chart I cited on spending on social protection as a % of GDP was the best available source I could find for this data. If US spending includes programs not specifically targeting poverty alleviation, my assumption is that the other countries listed similarly have non-poverty alleviation programs included, e.g., retirement pensions. If you know of a data source that disputes the point I'm making (the US spends more than the average among wealthy nations on poverty alleviation), I'd welcome it.
I wrote that programs administered through the tax system were 10x more efficient, not effective. Everyone can assess for themselves what feels like an excessive administrative cost to a given program. To me, the 10 to 1 rate is striking. Given the size of these programs, 9% equates to a lot of money, e.g., $5.8B dollars for SSI alone in FY23.
This seems misleading to me. If you look at a longer term chart you can see that most of the decline occured before 1960 and the programs you mentioned. The trend improved a bit in 1960 vs the prior ten years but remained worse than in the earlier period. Overall I would summarize it as 'things improved over time, the low hanging fruit were picked first, and there are no clear inflection points'.
Additionally, I checked ten other countries (Canada, UK, AUstralia, Netherlands, Austria, Frnace, germany, Italy, Norway, Japan) and they all had a similar trend of faster declines in 1960-1980 and then slower; it's possible they all enacted similar policies at the same time, but alternatively they all benefit from advances in medicine, technology and general GDP growth.
After doing this I also checked Brazil and Mexico because I think people often inappropriately only compare the US to Europe, but they were sufficiently higher it made the chart hard to read.
This also seems misleading. Regardless of how difficult it was to access, my understanding is that this $600B number is an actual spending number. If you think it is puzzling that poverty hasn't been solved with $600B, the fact that the number would have counterfactually been even higher absent some constraints isn't an answer.
This is not true. I'm very confused because in the footnote you note it's not true and then... don't correct it?
Lets try to sort this out, reverse-engineering what you did:
Thanks for reading and for sharing feedback.
Hi, thanks for sharing this. I've long supported GiveDirectly's global programs, and agree that your work can help inform better policy in high-income countries as well. While I don't think direct transfers to Americans would come close to the GiveWell bar, I'd be interested in cost-effectiveness analyses of advocacy for policy reform. Some of the other comments on this post could also be useful for constructing such a BOTEC, and so I wanted to add some clarifications as well:
The linked study, titled "Novel Estimates of Mortality Associated With Poverty in the US," does not make a causal claim like this. Here's what it says:
The causal effect is likely smaller. Furthermore, the study defines poverty as income below half the median income in each year, meaning it's not assessing the association between absolute living standards and mortality.
Like the above study, the OECD defines poverty as income below half the median. So this is really a measure of inequality.
On a more absolute measure--the threshold of income marking the poorest decile, after taxes and benefits--the US ranks 9 of 35 OECD countries evaluated:
My understanding is that the vast majority of that 22.7% of GDP is Social Security and Medicare. It also ignores the effect of taxes, and non-refundable credits like the bulk of the US Child Tax Credit, both of which can significantly affect low-income people (European countries rely more on consumption taxes, for instance).
Another way of assessing this is how much a country's inequality changes before and after taxes and transfers. Here the OECD ranks the US 31st of 37th in inequality reduction through redistribution.
This result mostly extends a long, steady trend of improvement.
A few things here:
Again, I greatly appreciate the work you all do, and agree that US antipoverty advocacy is at least understudied in EA. As one example, the Baltimore Baby Bonus ballot measure campaign seems plausibly cost-effective, given the enormous returns to reducing infant poverty (as also motivates RxKids), and their lean, scalable operation. My nonprofit, PolicyEngine, provides free open-source software for analyzing antipoverty policies, and we'd be glad to help in any endeavor to study the impact of reforms. I hope my comments can expedite some work for an enterprising EA to dig further into this important area.
I think the research here is solid but I don't see a clear next step. What specifically would you like EAs to do? Here are some suggestions you might have.
I guess i am most interested in the artice arguing for the cost effectiveness of one of these areas. Notably setting up an org to judge US aid effectiveness using EA methodologies or lobbying governments to do more transfers as cash. Both of those seem plausibly very effective, but I doubt I'm gonna get round to researching them any time soon.
Thanks for doing this research.
Some specific thoughts:
Good point! And perhaps this an underestimate also because it is % of GDP. Feels like the spending per capita would suggest even higher spending and it's unclear to me which is right.
emphasis mine
I am not sure I believe this. I am unsure that people see their religious donations as a portfolio and certainly not spending on burning man[1]. Personally, i think we'll get more done if we focus on what people think of as effective giving and make it more effective rather than trying to optimise people's donations to local causes. But I am unsure whether people think like this - I don't.
I dislike 'asking for debate'. I prefer people make the points and then see how people respond to them. If there were enough arguments I would happily have a debate, but reading this I am like "yeah seems right" but that's not really enough for a debate.
I don't think the author thinks that EAs think the burning man thing, even though that's implied but them I'm confused why it's even mentioned. Is it a dig? Hardly any EAs go to burning man.
Executive summary: Poverty in the U.S. causes significant suffering and death, but the social safety net is ineffective due to bureaucratic burden and restrictions; evidence suggests more accessible cash-based programs could reduce poverty and save lives.
Key points:
This comment was auto-generated by the EA Forum Team. Feel free to point out issues with this summary by replying to the comment, and contact us if you have feedback.
In the US, once you are unemployed, your income and healthcare disappears. Accessing unemployment benefits is one of the hardest thing to do. The saddest part is that you have the realization of being essentially on your own and no one (your past employer(s) or government) is coming to lend a hand. Hence falling into poverty seems inevitable for most individuals and families residing in the US.
Only 1/5 going towards cash assistance sounds like to be on the higher side. $600B also sounds like a drop in the bucket for such an advanced nation like ours.
What can U.S. learn from another country or society about building a tighter and more supportive safety net system for it's most vulnerable?