amandango
Posts 3
Comments17
The probability of an interval is the area under the graph! Currently, it's set to 0% that any of the disaster scenarios kill < 1 people. I agree this is probably incorrect, but I didn't want to make any other assumptions about points they didn't specify. Here's a version that explicitly states that.
Thank you for putting this spreadsheet database together! This seemed like a non-trivial amount of work, and it's pretty useful to have it all in one place. Similar to other comments, seeing this spreadsheet really made me want more consistent questions and forecasting formats such that all these people can make comparable predictions, and also to see the breakdowns of how people are thinking about these forecasts (I'm very excited about people structuring their forecasts more into specific assumptions and evidence).
I thought the 2008 GCR questions were really interesting, and plotted the median estimates here. I was surprised by / interested in:
- How many more deaths were expected from wars than other disaster scenarios
- For superintelligent AI, most of the probability mass was < 1M deaths, but there was a high probability (5%) on extinction
- A natural pandemic was seen as more likely to cause > 1M deaths than an engineered pandemic (although less likely to cause > 1B deaths)
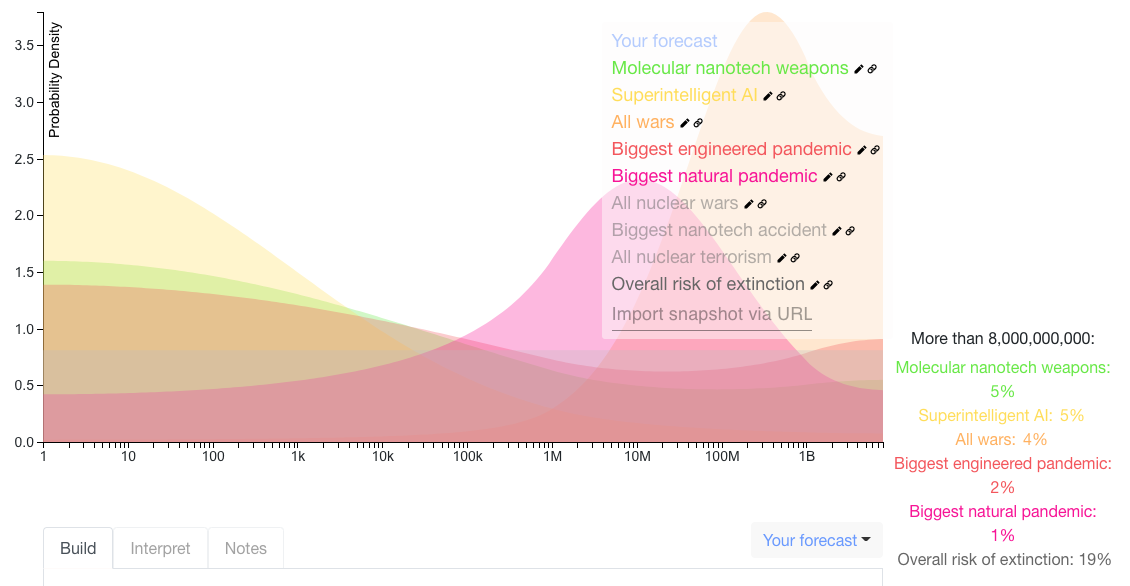
(I can't figure out how to make the image bigger, but you can click the link here to see the full snapshot)
Yeah, I mostly focused on the Q1 question so didn't have time to do a proper growth analysis across 2021 – I just did 10% growth each quarter and summed that for 2021, and it looked reasonable given the EA TAM. This was a bit of a 'number out of the air,' and in reality I wouldn't expect it to be the same growth rate across all quarters. Definitely makes sense that you're not just focusing on the EA market – the market for general productivity services in the US is quite large! I looked briefly at the subscriptions for top productivity podcasts on Castbox (e.g. Getting Things Done, 5am miracle), which suggests lots of room for growth (although I imagine podcast success is fairly power law distributed).
There isn't a way to get the expected value, just the median currently (I had a bin in my snapshot indicating a median of $25,000). I'm curious what makes the expected value more useful than the median for you?
Here’s my Q1 2021 prediction, with more detailed notes in a spreadsheet here. I started out estimating the size of the market, to get reference points. Based on very rough estimates of CEA subscriptions, # of people Effective Altruism Coaching has worked with, and # of people who have gone through a CFAR workshop, I estimated the number of EAs who are interested enough in productivity to pay for a service to be ~8000. The low number of people who have done Effective Altruism Coaching (I estimated 100, but this is an important assumption that could be wrong since I don’t think Lynette has published this number anywhere) suggests a range for your course (which is more expensive) of ~10 to 45 people in Q1. Some other estimates, which are in the spreadsheet linked above, gave me a range of $8,000 to $42,000. I didn’t have enough time to properly look into 2021 as a whole, so I just did a flat 10% growth rate across all the numbers and got this prediction. Interestingly, I notice a pressure to err on the side of optimistic when publicly evaluating people’s companies/initiatives.
Your detailed notes were very helpful in this. I noticed that I wanted more information on:
- The feedback you got from the first course. How many of them would do it again or recommend it to a friend?
- More detail on your podcast plans. I didn’t fully understand the $10 lessons – I assumed it was optional $10 lessons attached to each podcast, but this may be wrong.
- How much you’re focusing on EA’s. The total market for productivity services is a lot bigger (here’s an estimate of $1B market value for life coaching, which encompasses productivity coaching).
Do these estimates align with what you're currently thinking? Are there any key assumptions I made that you disagree with? (here are blank distributions for Q1 and 2021 if you want to share what you're currently projecting).
You should be able to access the doc from the link in my comment now! That's useful feedback re: selecting a range and seeing the probability. You can currently see the probability of an interval by defining the interval, leaving the prob blank, and hovering over the bin, but I like the solution you described.
Good note, agreed that it's better to centralize forecasts on the LW thread!