Derek
Posts 5
Comments104
DALYs appear to weight pain very lightly. For example, terminal illness with constant, untreated pain has a disability (DALY) weight of 0.569, which is only 0.029 more than the weight for the same condition with pain medication. QALYs are better at capturing pain: physical pain is the dimension given the highest weight in the EQ-5D, and instrument used to measure quality of life.
You might want to check disability weights for other painful conditions; I don't remember if they were generally low.
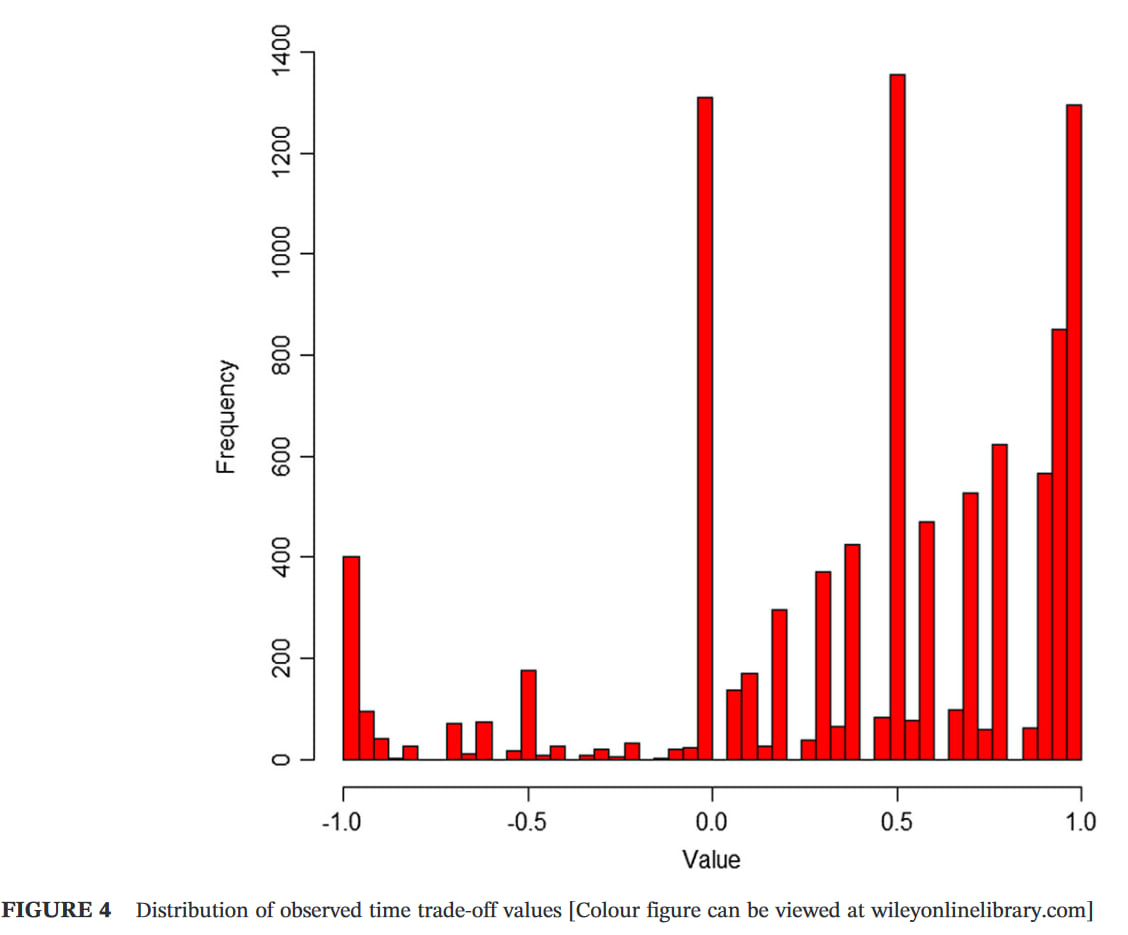
I suspect QALYs still underweight extreme pain, for various reasons, e.g. the arbitrary cap on negative values, and the lack of experience of such states among most respondents (typically the general public in high- and middle-income countries). The distribution of responses typically suggest 'floor effects', with some respondents likely to give lower values if it were permitted. The Devlin et al paper I linked to previously gives good evidence of that, but here is a graph from a different paper (UK sample) for illustration (note the cluster at -1).
My point was more that pain gets a high weight relative to other dimensions of the EQ-5D...though not always the highest. As shown in the graph below, the original EQ-5D-3L UK tariff (Dolan, 1997) had pain as second (after mobility) for extreme, and roughly equal first (with self-care) for moderate, based on TTO responses from the general public. (I can give you the Excel version of the graph if you want to modify it.)
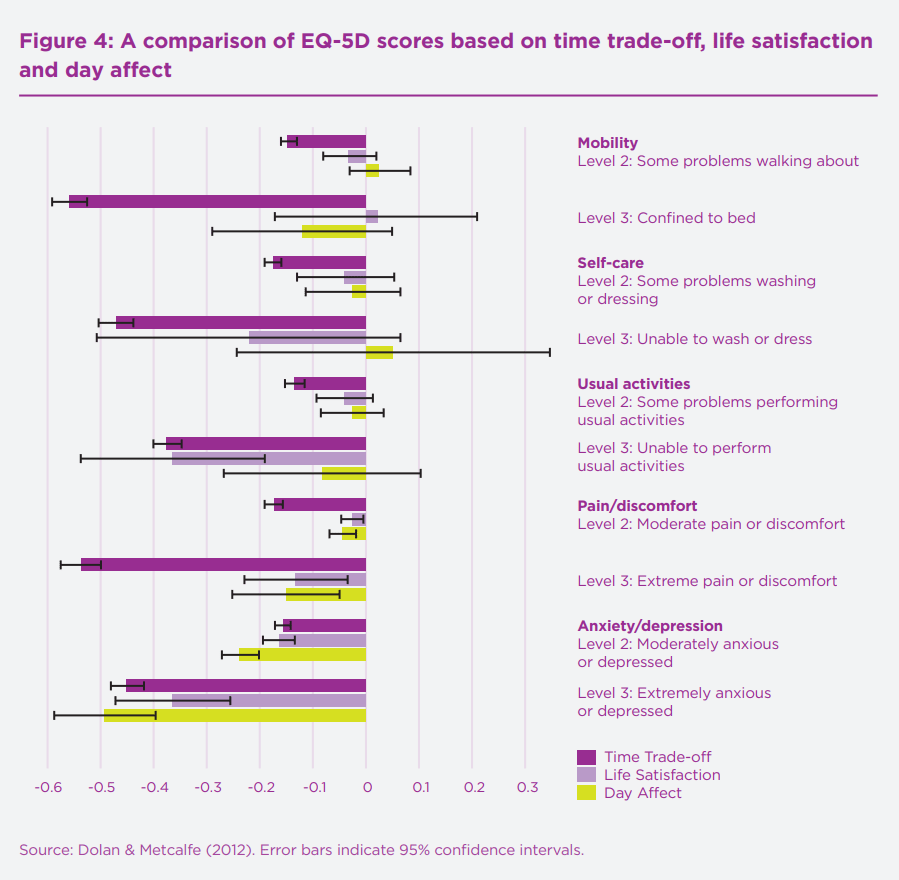
The preliminary UK tariff for the newer EQ-5D-5L gave pain the highest weight, followed by depression/anxiety, for the extreme level. Full results below... but note that NICE rejected the value set for methodological reasons so, last I checked, it still recommends mapping the old 1997 3L figures onto the 5L with an algorithm.

There are many other tariffs from many other countries, for both the 3L and 5L, if you want to compare: https://euroqol.org/information-and-support/resources/value-sets/
even sufferers may underestimate the badness of depression
I think this may be true (given some plausible-to-me philosophical and psychological assumptions), but it's also more generally that studies done in sufferers likely underestimate the badness. For example, because studies exclude the most severe cases, the badness of severe depression would be underestimated even if the study participants gave fully 'valid' responses (and even if an instrument were used that was able to capture the full range of experience).
- I see from the summary you linked that IHME have used sequelae to identify ailments that are present in multiple health conditions. That seems sensible. I guess the kind of problem I often face is "What will be reduction in someone's disability weight if they are - protected from getting diabetes / cured of depression / etc. ?"
- In the diabetes example, it seems fair to count DALYs averted by not having diabetes and DALYs averted by depression-caused-by-diabetes. Maybe not fair to count, say, obesity, since the increased risk of obesity associated with diabetes is likely to be correlational, not causal. Am I thinking along the right lines?
- If we go with the depression example, it seems fair to count both prevented suicide and prevented depression (but not prevented depression-while-dead-by-suicide)
I don't remember the details of the DALY/GBD methods, and I don't know a great deal about diabetes, but I'm pretty sure it can be a cause as well as consequence of obesity. At least insulin therapy can cause weight gain. And obviously you'd want to count only the proportion of diabetics who would have got depressed/gained weight as a result of diabetes.
Not sure I follow the depression example, but yes, you would sum the YLL from suicide (i.e. 'standard' or counterfactual life expectancy minus the actual number lived) and YLD (i.e. years lived with depression * disability weight). The formula/steps and examples are here and here.
Thanks for writing this - there's some good stuff here. A few comments:
1 QALY is equal to a year of life in full health, while 0 QALYs is a health state equivalent to death … The QALY scale admits scores below zero, which represent states worse than death
Minor point, but I think 'being dead' is more accurate than 'death'. The latter suggest permanency, whereas values <0 can represent temporary states that are deemed worse than being dead. That said, there is some uncertainty over the meaning of negative valuations, and the best interpretation may depend on the methods used to elicit the values.
They appear to weight pain very lightly. For example, terminal illness with constant, untreated pain has a disability (DALY) weight of 0.569, which is only 0.029 more than the weight for the same condition with pain medication.
IIRC, physical pain is the dimension given the highest weight in the EQ-5D, so I'm not sure this is accurate for QALYs at least. I haven't looked into it fully, but one might expect DALYs to underweight pain, as in the example above, because (intuitively) one is no less 'unhealthy' if, say, terminal cancer is treated with painkillers. In contrast, your 'quality of life' is higher with lower pain, and most people have a strong preference for less pain, which is what QALYs aim to capture. In general, QALYs and DALYs give similar weights, so I'm not sure how much it matters in practice, but I haven't looked at differences across types of health state. EDIT: A useful project would be to compare DALY and QALY values for painful and mental disorders, but it wouldn't be that straightforward as QALYs are normally based on generic descriptions of health states while DALYs refer to specific conditions.
They only aim to measure the impact of the health state, not its comorbidities
If done properly, I think comorbidities are captured by both QALYs and DALYs. An individual's QALY value is normally based on their self-reported score on a generic health state questionnaire, e.g. the EQ-5D has mobility, self-care, usual activities, pain/discomfort, and anxiety/depression. This is done without reference to specific health conditions (e.g. arthritis, cancer), so the impact of any comorbidities should be reflected in the valuation. When individual data are not available, I think the impact of comorbidities is typically estimated by multiplying the weights, e.g. 0.3*0.7=0.21, though alternatives have been suggested.
DALYs do focus on health conditions but, at least when assessing the burden of disease, they try to account for sequelae (consequences of a condition). See the links in my summary here: https://forum.effectivealtruism.org/posts/Lncdn3tXi2aRt56k5/health-and-happiness-research-topics-part-1-background-on#Population_health_summaries1
That said, I'm not sure whether comorbidities/sequelae are always adequately captured in cost-effectiveness analyses, especially model-based analyses that use a hypothetical treated population. I can see it would be tempting for a modeller to ignore other conditions when evaluating the impact of an intervention on a particular disease.
On depression:
There are reasons to suspect that even the weights given by sufferers underestimate its badness. For example [EDIT: I've expanded this list]:
- The most severe cases (e.g. in suicidal individuals, those with a terminal illness, or those with comorbidities such as dementia or psychosis) are typically excluded from studies for ethical reasons: it's potentially problematic to ask such people whether they would be better off dead, and the ability to provide (meaningful) answers may be limited by acute suffering.
- There are potential cognitive 'biases' at work, e.g. an evolutionarily-ingrained aversion to death.
- There is some evidence from qualitative studies that respondents take into account effects on others, e.g. wanting to be alive to look after their children, even if they are asked to answer only based on self-interest.
- As you know, DALYs don't permit SWD and QALYs cap negative values at -1 or higher for individual responses in valuation studies, so the average value ends up much higher than that. In studies where they're allowed to go lower, the mean values are also lower. See e.g. this paper.
But I'm not sure it's right to correct the weights for suicide. The QALY gain/DALY loss from an intervention is a function of both duration and quality/healthfulness of life, so adjusting the quality dimension risks double-counting the effect of suicide. EDIT: But there are reasons to think that the DALY-based Global Burden of Disease studies have underestimated the burden of mental illness. I haven't kept up to date on the methodology since writing my posts, but see this paper from 2016.
Some things, like extreme pain, depression and psychosis, may never be fully captured by bounded scales
My PhD supervisor made a similar point this week. Some kinds of wellbeing (e.g. objective lists) may not have an upper or lower limit, and it may be unnecessary to impose them: to trade off duration and quality of life, we need a zero point (e.g. 'as bad as being dead') and some unit (e.g. a quantity of wellbeing), but a fixed upper and lower bound might not be essential. For hedonists, there may be some physical limit to pain/pleasure, which could potentially serve as the bounds. For desire theorists, I'm not sure: I suppose intensity of preference is also a mental state that might also have a physical limit. But whether it's feasible to develop a practical measure that captures the extremes without neglecting important gradations of more common states is as-yet unclear to me. Maybe one option is to anchor scales at something non-extreme, e.g. WELBY 1 = the 95th percentile of some population, and simply allow some individuals to score arbitrarily higher than 1 (e.g. WELBY 5 during some extreme pleasures). Mutatis mutandis for negative states. But I need to think about it more.
The urgency of relieving severe physical pain reveals the serious limitations of the “QALYs gained” approach to measuring scale of impact. A person with terminal cancer treated with morphine for two months might remain highly disabled and in a very poor state of health, and gain only a fraction of a QALY, yet be spared two months of agony.
I'm not sure I follow this. QALYs allow negative values, so if morphine treatment increased health-related quality of life from, say, -0.5 to +0.1, it would gain 0.6 QALYs per year. Most/all currently-used value sets would give less weight than that to pain relief, but I don't think that's primarily because of their other health states. Extending that life would gain few QALYs, but that doesn't seem to be your concern.
That said, it might depend on the method used to combine utility decrements for various health states. The most common approach to dealing with comorbidities is to multiply utility decrements, e.g. if the decrement for cancer is 0.4 and for pain is 0.6, you'd end up with (0.4*0.6) = 0.24 (assuming a baseline/counterfactual of full health). Maybe that's what you were getting at?
Note that there are also methods for calculating confidence intervals around ICERs that avoid issues with ratios. The best I'm aware of is by Hatswell et al. I have an Excel sheet with all the macros etc set up if you want.
MAICER = maximum acceptable incremental cost-effectiveness ratio. This is often called the willingness to pay for a unit of outcome, though the concepts are a little different. It is typically represented by lambda.
The CE plane is also useful as it indicates which quadrant the samples are in, i.e. NE = more effective but more costly (the most common), SE = more effective and cheaper (dominant), NW = less effective and more costly (dominated), and SW = less effective and cheaper. When there are samples in more than one quadrant, which is very common, confidence/credible intervals around the ICER are basically meaningless, as are negative ICERs more broadly. Distributions in Guesstimate, Causal, etc can therefore be misleading.
The standard textbook for heath economic evaluation is Drummond et al, 2015, and it's probably the best introduction to these methods.
For more details on the practicalities of modelling, especially in Excel, see Briggs, Claxton, & Sculpher, 2006.
For Bayesian (and grudgingly frequentist) approaches in R, see stuff by Gianluca Baio at UCL, e.g. this book, and his R package BCEA.
Cost-effectiveness planes are introduced in Black (1990). CEACs, CEAFs, and value of information are explained in more detail in Barton, Briggs, & Fenwick (2008); the latter is a very useful paper.
For more on VOI, see Wilson et al., 2014 and Strong, Oakley, Brennan, & Breeze, 2015.
For a very clear step-by-step explanation of calculating and interpreting ICERs and net benefit, see Paulden 2020. In the same issue of PharmacoEconomics there was a nice debate between those who favour dropping ICERs entirely and those who think they should be presented alongside net benefit. (I think I'm in the latter camp, though if I had to pick one I'd go for NB as you can't really quantify uncertainty properly around ICERs.)
For an application of some of those methods in EA, you can look at the evaluation we did of Donational. I'm not sure it was the right tool for the job (a BOTEC + heuristics might have been as good or better, given how speculative much of it was), and I had to adapt the methods a fair bit (e.g. to "donation-cost ratio" rather than "cost-effectiveness ratio"), but you can get the general idea. The images aren't showing for me, though; not sure if it's an issue on my end or the links are broken.
Here is a more standard model in Excel I did for an assignment.
Hope that helps. LMK if you want more.
This is a recognised issue in health technology assessment. The most common solution is to first plot the incremental costs and effects on a cost-effectiveness plane to get a sense of the distributions:
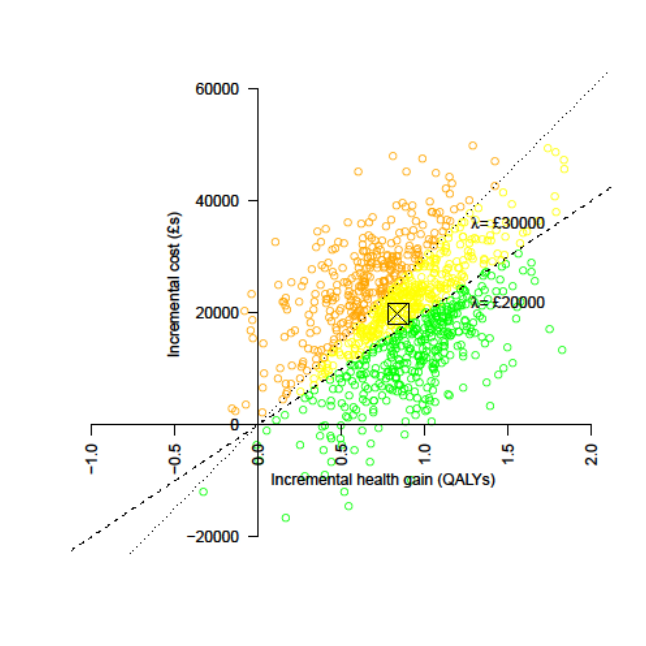
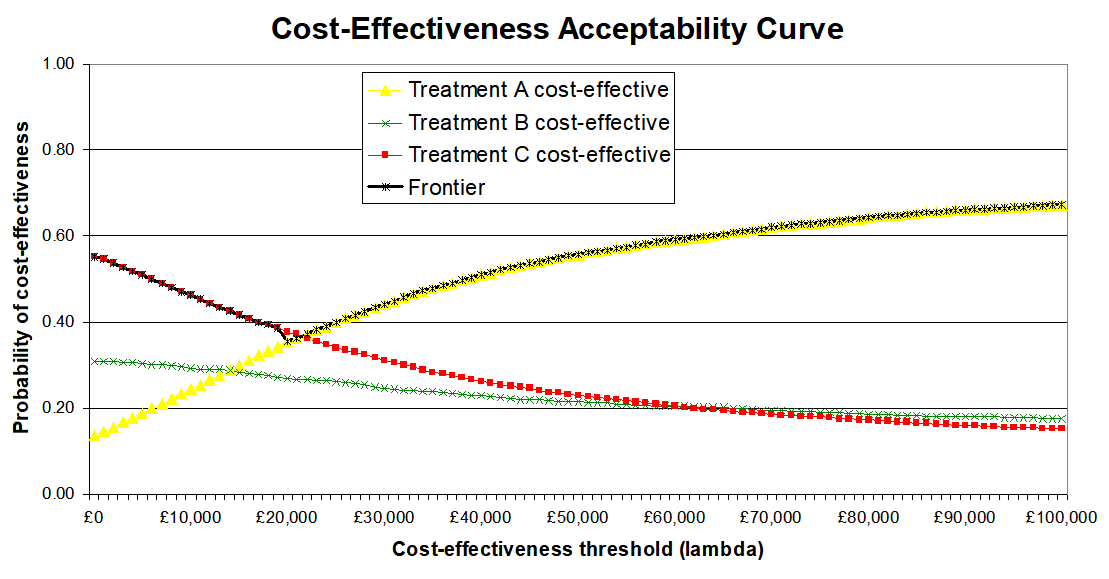
Then to represent uncertainty in terms of the probability that an intervention is cost-effective at different cost-effectiveness thresholds (e.g. 20k and 30k per QALY). On the CEP above this is the proportion of samples below the respective lines, but it's generally better represented by cost-effectiveness acceptability curves (CEACs), as below:
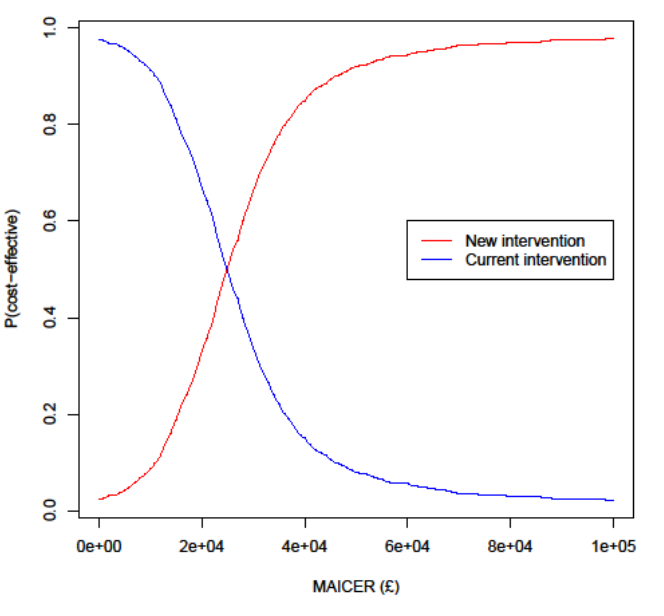
Often, especially with multiple interventions, a cost-effectiveness acceptability frontier (CEAF) is added, representing the probability that the optimal decision (i.e. the one with highest expected net benefit) is the most cost-effective.
I can dig out proper references and examples if it would be useful, including Excel spreadsheets with macros you can adapt to generate them from your own data (such as samples exported from Guesstimate). There are also R packages that can do this, e.g. hesim and bcea.
For traditional QALY calculations, researchers simply ask people how they feel when experiencing certain things (like a particular surgery or a disease) and normalize/aggregate those responses to get a scale where 0 quality is as good as death, 1 is perfect health, and negative numbers can be used for experiences worse than death.
This isn't correct. QALY weights are typically based on hypothetical preferences, not experiences.
What Richard described is more like a WELBY, which has a similar structure but covers wellbeing in some sense rather than just health. See Part 1 of my (unfinished) sequence on this if you're interested.
Glad you found it useful. I am not qualified to comment on the role of neuron count in sentience; you may want to look at work by Jason Schukraft and others at Rethink Priorities on animal sentience and/or get in touch with them.
If you haven't already, you may also want to review the 2018 Humane Slaughter Association report, which was the best I could find in early 2019. While looking for it, I also just came across one from Compassion in World Farming, which I don't think I've read.
I agree with him on inputs, but often the expected value is the most important output, in which case point estimates are still informative (sometimes more so than ranges). Also, CIs are often not the most informative indicator of uncertainty; a CEAC, CEAF, VOI, or p(error) given a known WTP threshold is often more useful, though perhaps less so in a CBA rather than a CEA/CUA.