mcint
Comments6
Thank you for sharing a(n extensive) quick analysis!
Nit about color schemes, please use darker colors to convey more important data, in this case, it seems that emphasizing the fraction of survey respondents reporting a reason as "Extremely influential" (rating 5) serves the purpose of your analysis better than fraction reporting a reason was "Not an influence at all" (rating 1).
To be clear, the fact of high reported importance from respondents might not always have highest relevance for readers, but high reported importance does seem your greatest interest here.
I misread (and conveyed to others) an exactly backwards interpretation of the cumulative percentage rating diagrams, due to the color scheme, and the legends split across the top and bottom of the visualizations.
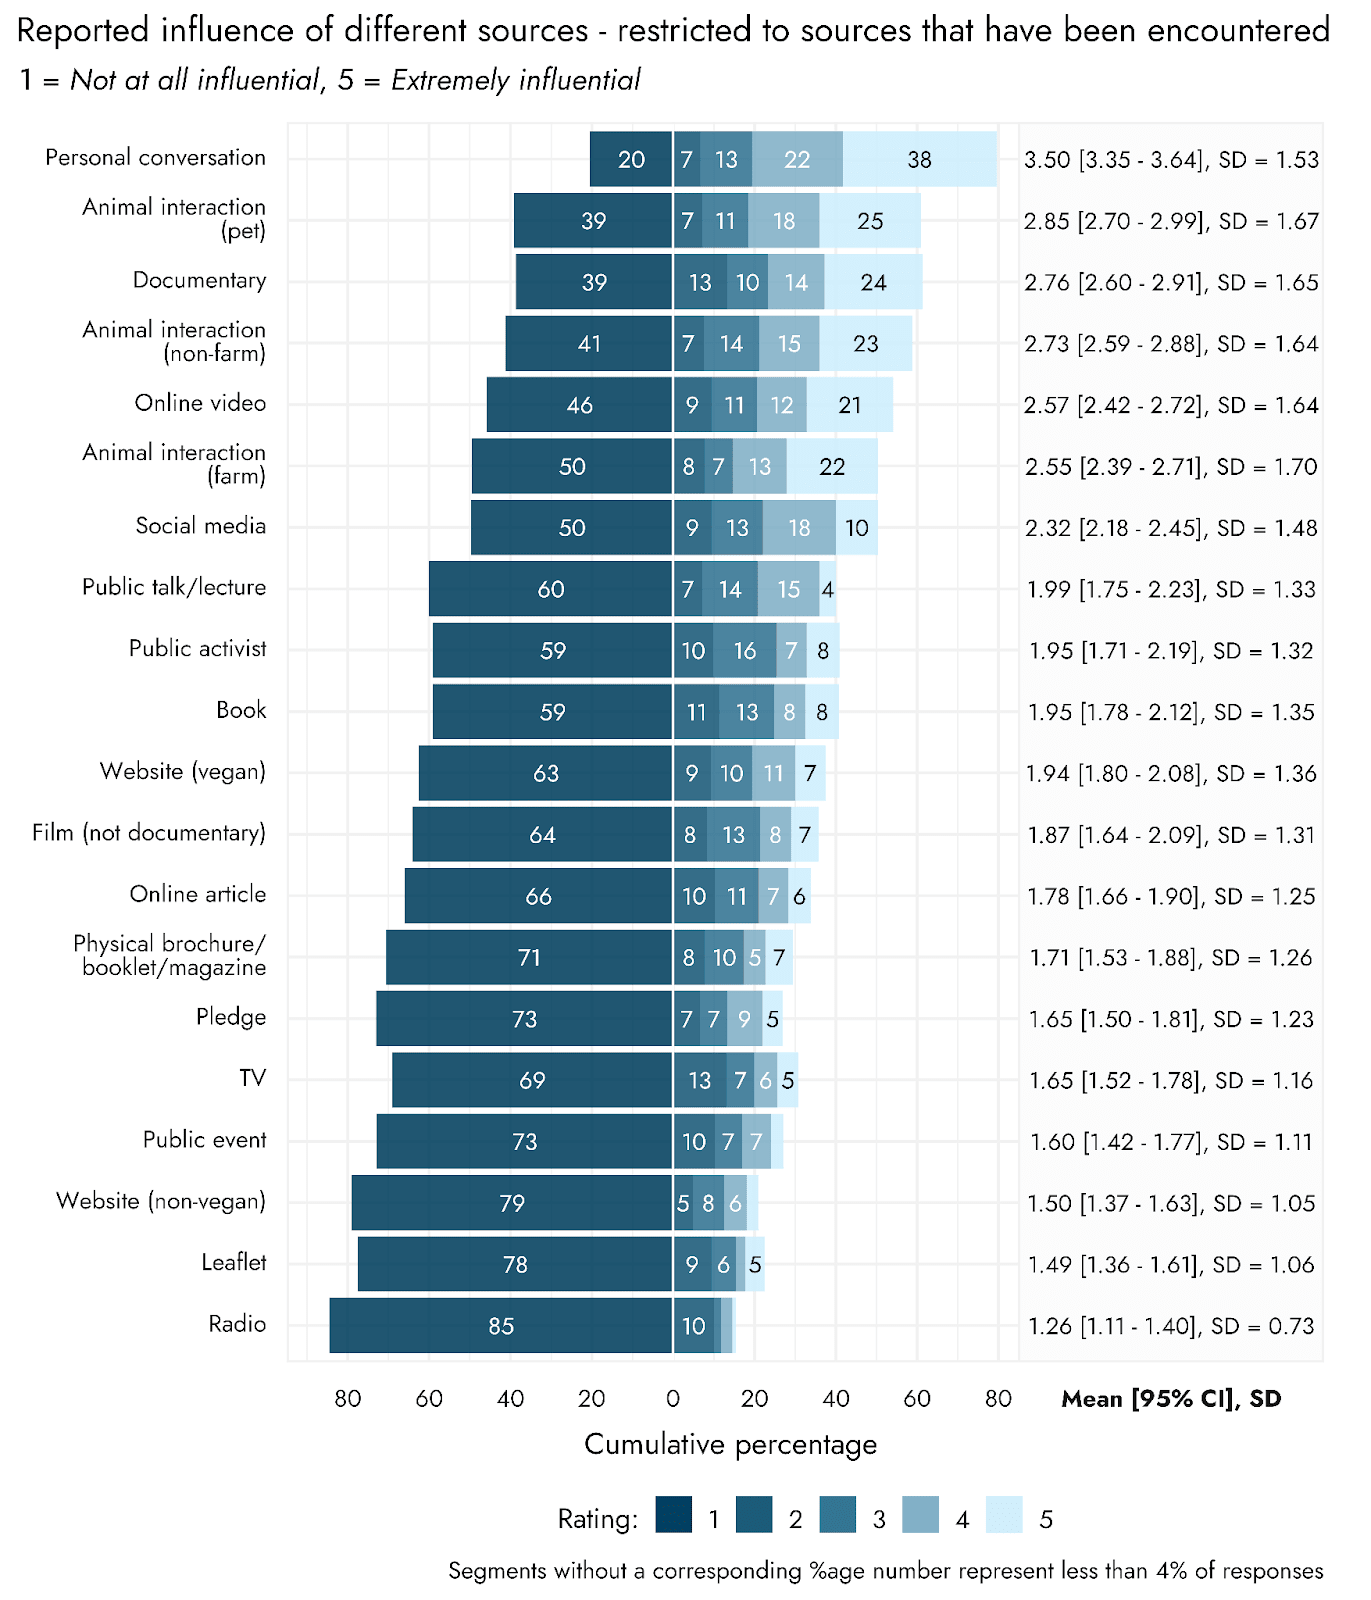
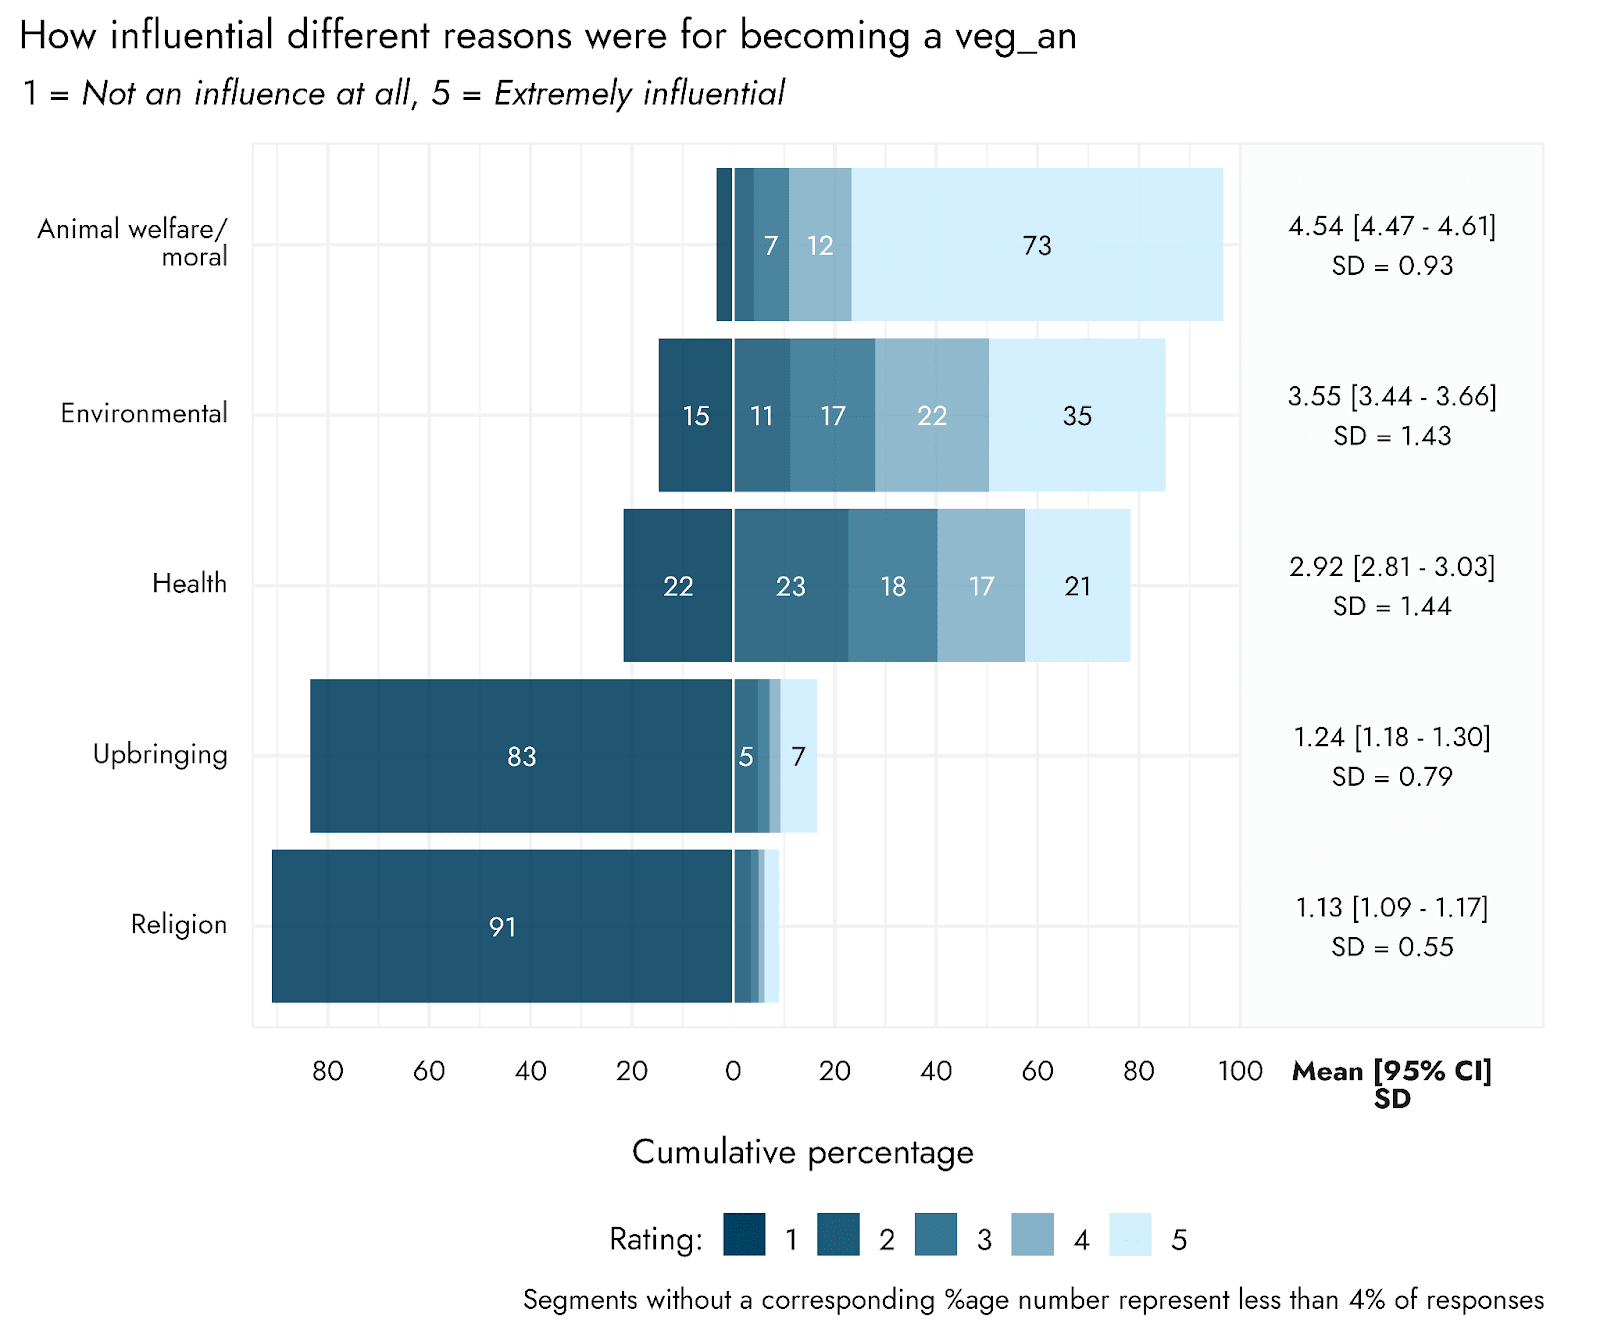
I did find the consistent left-greater orientation helpful.
listennotes.com provides a nice index of podcasts, down to episodes.
Suggestion: Consider claiming ownership, and updating it with at least Spotify & Google Podcast links (they're parsing the Apple feed).
https://www.listennotes.com/podcasts/the-nonlinear-library-the-nonlinear-fund-xuqI3sgU5DY/
Podcast audience nationality estimation might hold some interest. I'm not sure of their methods or certainty range. https://www.listennotes.com/podcasts/the-nonlinear-library-the-nonlinear-fund-xuqI3sgU5DY/#audience Amazing, 5791 Nonlinear Library episodes published in the last two years.
I would love to see an index linking to initial text posts and to podcast link(s)!
As explanation, I listen to podcasts while commuting, and often numerous episodes of Nonlinear Library (NL) because they are so short. I sometimes want to engage further, by re-reading them, saving them in a reading manager, checking the author's other work, or reading comments (or adding my own). It would be helpful to have somewhere that links to text posts.
If I remember correctly, NL made an intentional choice not to link from podcast episode descriptions to EA/LW/AF, in hopes of avoiding a deluge of engagement with posts, or communities as a whole, that do not uphold conversational and engagement norms that we so prize them for.
Should, or could, we request read-only links to posts?
might support sharing these posts more broadly beyond these communities, while minimizing the risk of unwelcome engagement (and supporting disclaimers to serve as an introduction to the community—"these posts are not endorsed," or "this is a forum").
That makes sense. Thank you for your responsiveness!! And for making updates, though I'm not my advice should be followed nor that all of my suggestions improve fitness-for-purpose, as I'm unsure that I understood the goals of this post and strategy well enough. My suggestions came from what I now regard as hopeful misinterpretation on my part.
I do think dark colors should be used to focus emphasis on what your analysis aims to show, or else use a background box to highlight the sub-portion of a chart that you're emphasizing.
I agree with concerned raised in the Discussion and Limitations section, and admit I skimmed these too lightly earlier. However, I think I'm expanding on them.
I mainly have doubt around--and trouble actionably interpreting--statements (or hypotheses, or survey questions) that "X [method] has low likelihood [of changing a belief]" [by itself]--to make explicit what I think is a hidden premise, or of "making a difference", where the first difference is "noticing".
(Source)
I worry that the data collected (about influence methods) just recapitulates a public-to-private gradient, which itself could predict the low-to-high relevance and affiliation survey results, while the paper does not account for this expectation. That is: we already know people don't like radio ads and do like having conversations with their friends. In a survey, I would expect that people think radio is not relevant to their thinking. However, broadcasting vegan-promoting ads will cause more conversations, encourage a little more research, and normalize the choice. The post acknowledges similar considerations, but I want to encourage these considerations to have more effect on the analysis chosen.
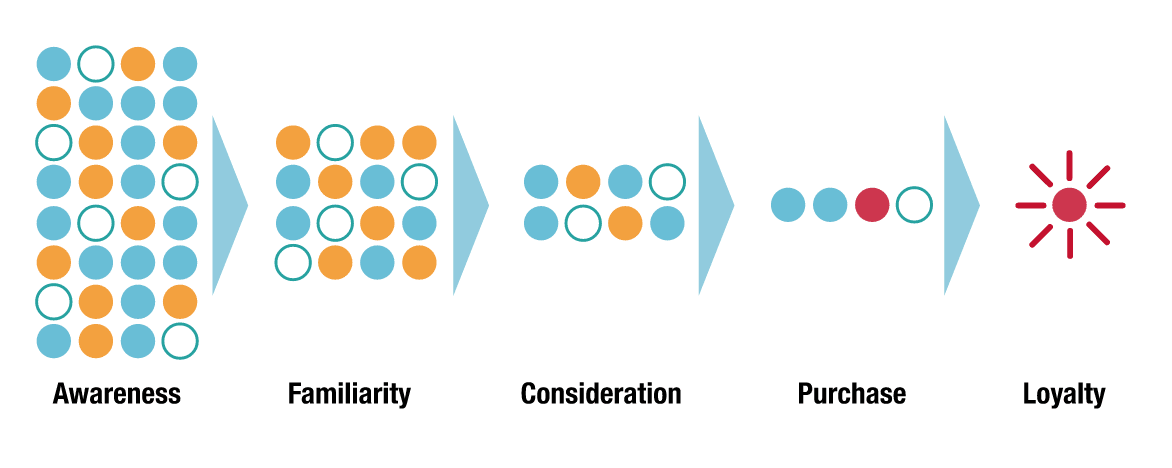
EA vegans & animal welfare promoters are already in self-assorted groups, and friends with many who could-be-convinced, and unconnected to many people who object. I would be curious to see EA cause conversion funnels: estimated sizes of populations at each level, what conversions and methods for each (conversion-stage, reason) for inviting people further along progressions.
Could the existing collected data be used to analyze the most convincing influence methods grouped by the individual's reason for making diet choices? Answering approximately: "Retrospectively, what influence made the final difference in you arriving at your current chosen diet?"--before making a model.
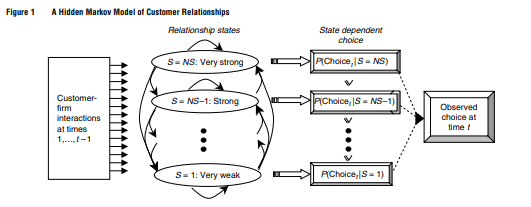
(Columbia & Stanford business schools paper on alumni donor modelling)
Broad-base advertising aims to achieve a different purpose than one-on-one conversations, and awareness raising in broadcast media can make those one-on-one conversations more possible, more common, and more effective. I worry the data and analysis published here discourage spending at the top of the funnel, by accounting for something like "strength of belief" and resultant action, without multiplying that by "size of population reached".
It's much easier to argue X works than X does not work. I think we should look for things that work, and apply a portfolio approach. I think it's really hard to effectively argue
I think I naively model these I know I would love to hear EA ads on the radio or billboard, or places that create common knowledge of exposure, because I could bring it up with friends.