Natália
Comments7
Outcomes for veganism are [...] worse than everything except for omnivorism in women.
As I explained elsewhere a few days ago (after this post was published), this is a very misleading way to describe that study. The correct takeaway is that they could not find any meaningful difference between each diet's association with mortality among women, not that “[o]utcomes for veganism are [...] worse than everything except for omnivorism in women.”
It's very important to consider the confidence intervals in addition to the point estimates when interpreting this study (or any study, really, when confidence intervals are available). They provide valuable context to the data.
Several people cited the AHS-2 as a pseudo-RCT that supported veganism. There’s one commenter on LessWrong and two on EAForum
The LessWrong link here links to my comment even though I did not describe the AHS-2 as a "pseudo-RCT." So I think your description of that comment is misleading.
Edit: it's also misleading to say that "Outcomes for veganism are ~tied with pescetarianism in men, and are worse than everything except for omnivorism in women" in AHS-2, as I explained on LW.
[This is a more well-thought-out version of the argument I made on Twitter yesterday.]
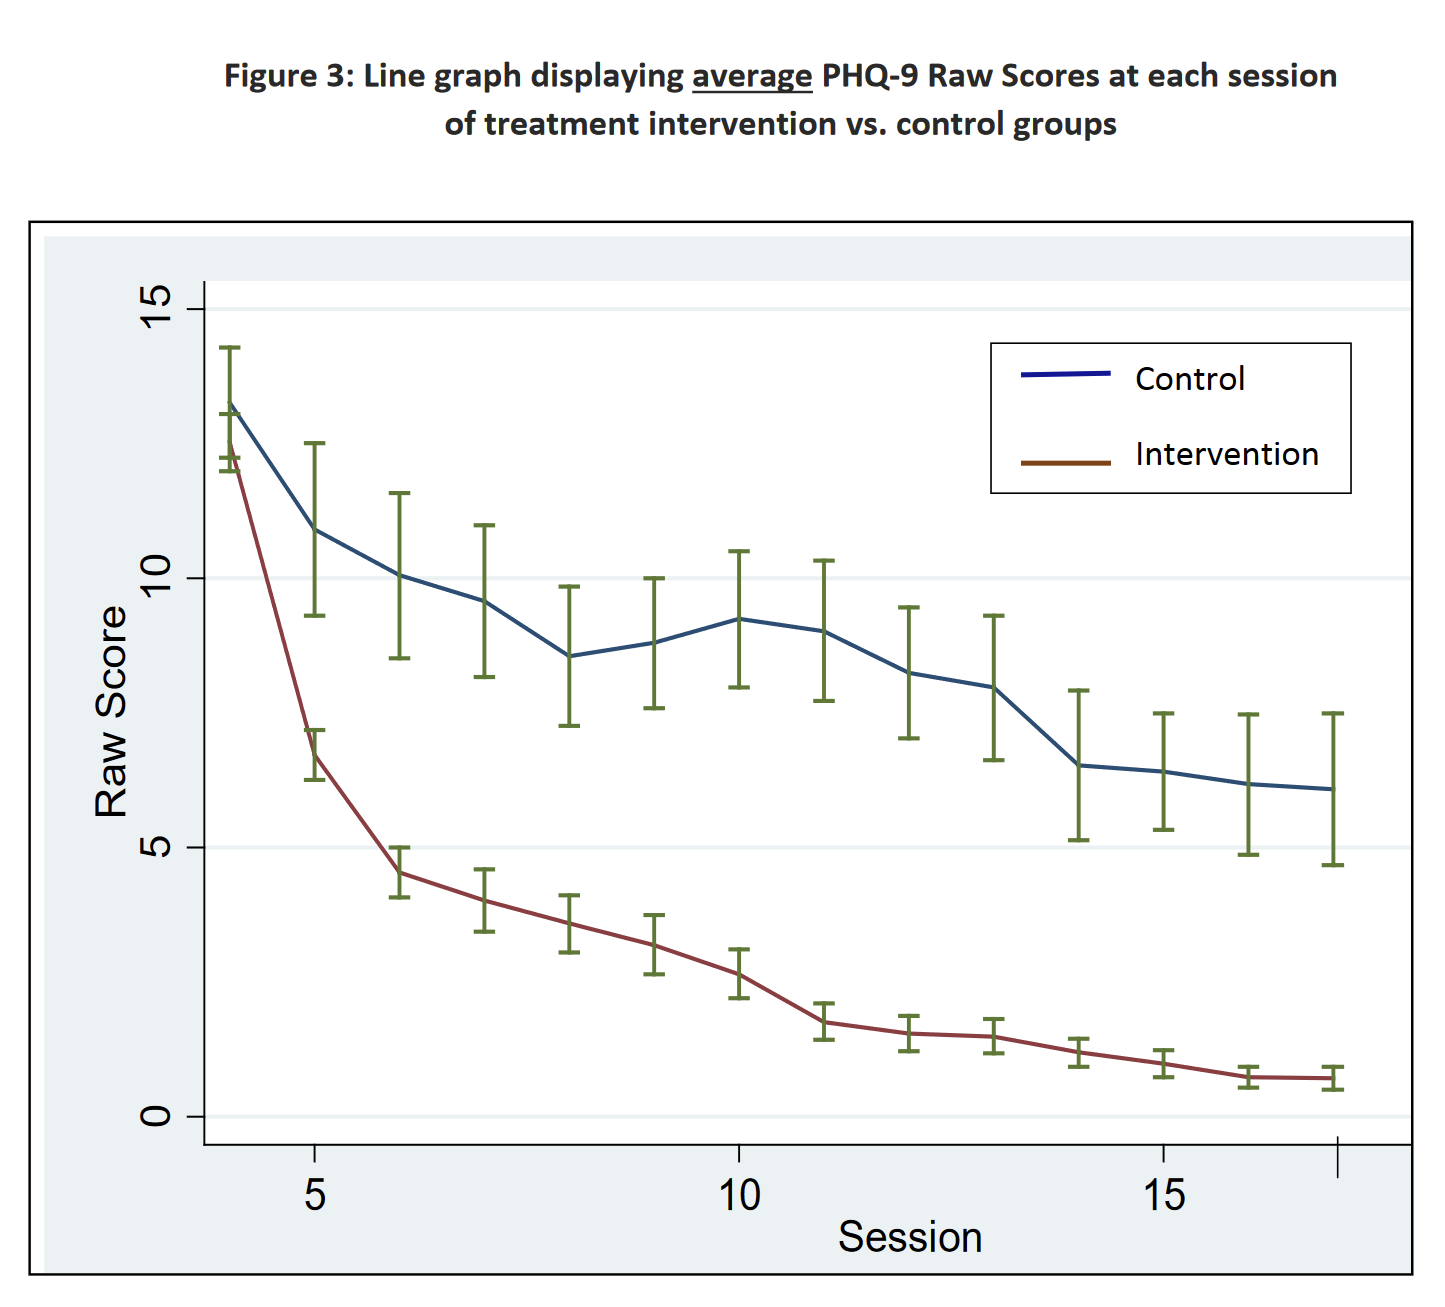
the best I can tell is in Phase I we had a ~7.5 vs ~5.1 PHQ-9 reduction from “being surveyed” vs “being part of the group” and in Phase II we had ~5.1 vs ~4.5 PHQ-9 reduction from “being surveyed” vs “being part of the group”.
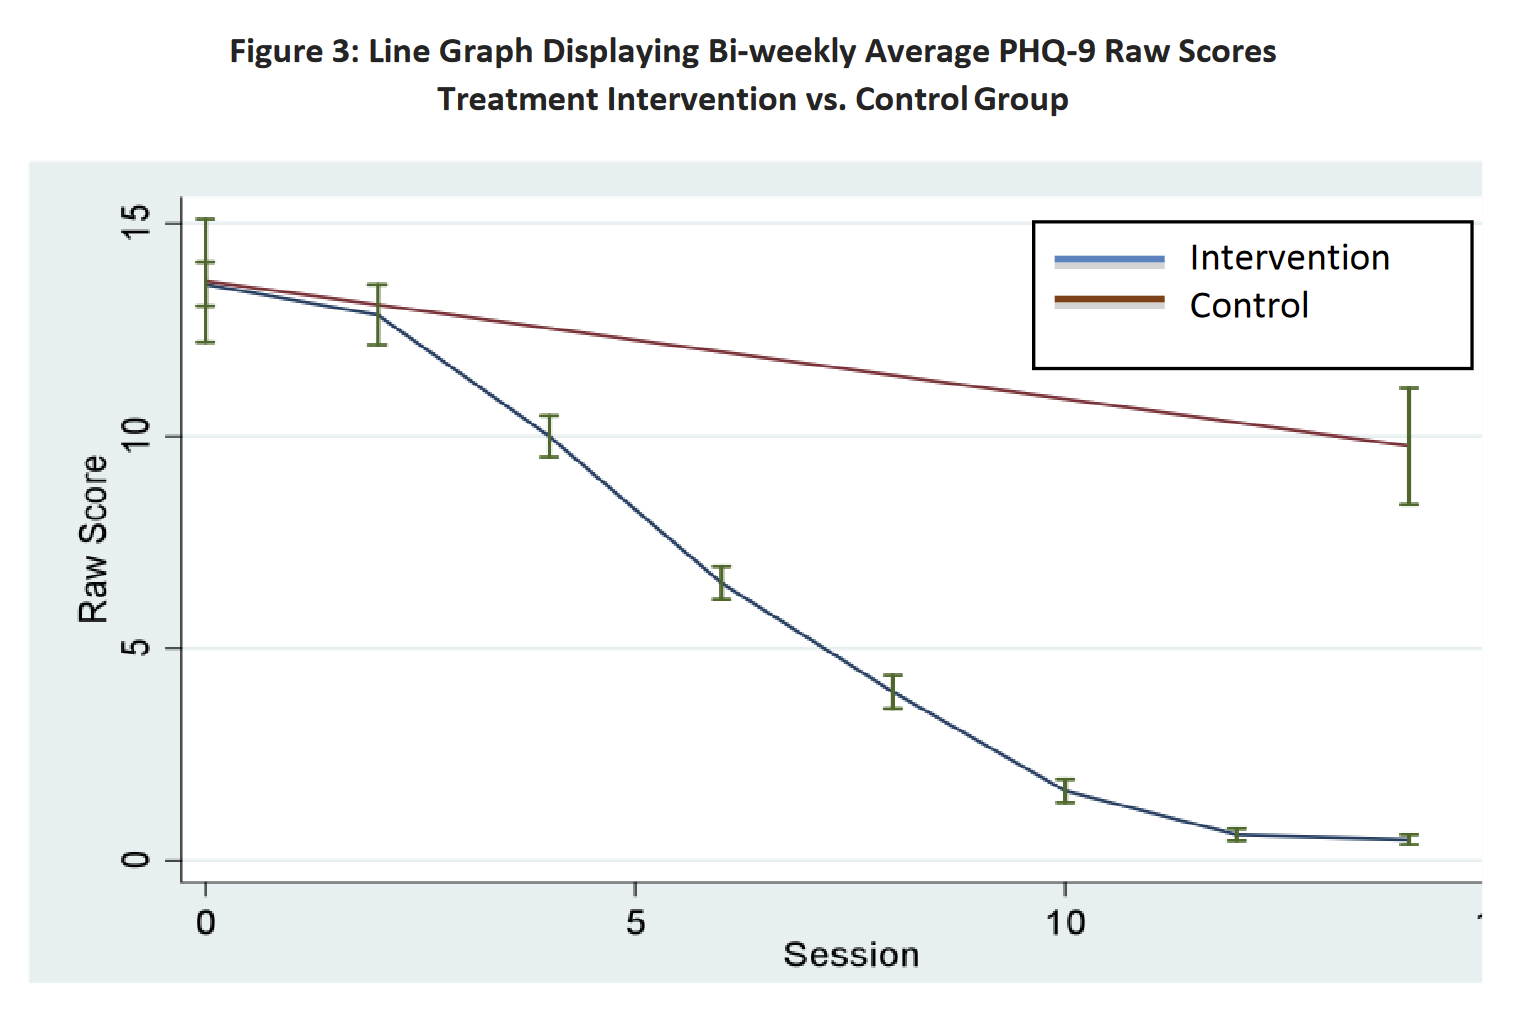
I think the Phase II numbers were not meant to be interpreted quite that way. For context, this is line chart of scores over time for Phase I, and this is the corresponding chart for Phase II. We can see that in the Phase II chart, the difference between the control and treatment groups is much larger than that in the Phase I chart. Eyeballing, it looks like the difference between the control and treatment groups in Phase II eventually reaches ~10 points, not 4.5.
The quote from the Phase II report in your post says:
[...] members in the treatment intervention group, on average, had a 4.5 point reduction in their total PHQ-9 Raw Score over the intervention period, as compared to the control populations. Further, [... t]he PHQ-9 Raw Score decreased on average by 0.86 points for a participant for every two groups she attended.
What this seems to be saying is they ran a linear regression model to fit a non-linear line, and the regression says that PHQ-9 scores decreased by 4.5 points in the treatment group, plus 0.86 points for every 2 sessions attended. So, for example, someone in the treatment group who attended 12 sessions (as 91% of women in the treatment group did) would get a 4.5 + 6*0.86 = 9.66 point drop over someone in the control group who attended 0 sessions.
A bit confusingly, the Phase I report described the result with the same kind of linear regression model:
Furthermore, the analysis determined that depressed female patients who completed the GIPT intervention, on average, experienced a 5.1 point reduction in their total PHQ-9 Raw Score over the entire 16-week intervention period, compared to the control group. Additionally, for each visit, these women experienced an average 0.63 reduction in their PHQ-9 Raw Score for depression.
But for Phase I, the effect associated with being in the treatment group controlling for sessions attended (5.1 points) is what matches the treatment-control gap eyeballed from the Phase I line chart.
It looks like there are differences between Phase I and Phase II regarding how the control group was handled. In the Phase I line chart, there are several PHQ-9 datapoints for the control group; in the Phase II chart there are only two, one at the beginning and one at the end. It looks like in Phase I, women in the control group took the PHQ-9 weekly, and this was counted as a "visit" in the regression model. In contrast, in Phase II, only the treatment group had visits that were counted that way (except perhaps for the beginning and end of the trial).
So I think it makes more sense to say that Phase II ended up finding a ~10 point decrease between the treatment and control groups, and Phase I a 5.1-point decrease, but with the obvious caveat that the difference was due to Phase II control group members not being surveyed as much. It doesn't seem like you can answer the question "how much of the effect is due to the treatment, and how much due to being surveyed multiple times?" using Phase II data.
I think this is wrong in a few ways:
1. None of the comments referred to “low meat omnivorism.” AHS-2 had a “semi-vegetarian” category composed of people who eat meat in low quantities, but none of the comments referred to it
2. The study indeed found that vegans had lower mortality than omnivores (the hazard ratio was 0.85 (95% CI, 0.73–1.01)); your post makes it sound like it’s the opposite by saying that the association “points in a different direction than reported.” I think what you mean to say is that vegan diets were not the best option if we look only at the point estimates of the study, because pescatariansim was very slightly better. But the confidence intervals were wide and overlapped too much for us to say with confidence which diet was better.
Here's a hypothetical scenario. Suppose a hypertension medication trial finds that Presotex monotherapy reduced stroke incidence by 34%. The trial also finds that Systovar monotherapy decreased the incidence of stroke by 40%, though the confidence intervals were very similar to Presotex’s.
Now suppose Bob learns this information and tells Chloe: "Alice said something misleading about Presotex. She said that a trial supported Prestotex monotherapy for stroke prevention, but the evidence pointed in a different direction than she reported."
I think Chloe would likely come out with the wrong impression about Presotex.
3. My comment, which you refer to in this section, didn't describe the AHS-2 as having RCT-like characteristics. I just thought it was a good observational study. A person I quoted in my comment (Froolow) was originally the person who mistakenly described it as a quasi-RCT (in another post I had not read at the time), but Froolow's comment that I quoted didn't describe it as such, and I thought it made sense without that assumption.
4. Froolow's comment and mine were both careful to notice that the study findings are weak and consistent with veganism having no effect on lifespan. I don't see how they presented it as strong evidence.
[Note: I deleted a previous comment making those points and am re-posting a reworded version.]