
Richard Nerland
Bio
I currently serves as a Board member and investor for Malengo, an effective labor mobility nonprofit enabling low-income students from East Africa to pursue education and work opportunities in Europe, unlocking enormous long-term income gains. I am building a global outcome based loan market with the Global ISA Alliance and Better Future Forward. Finally, I am actively involved as an advisor to the African Urban Lab based at African School of Economics in Zanzibar.
How others can help me
I’m especially looking to connect with people working on labor mobility, economic growth in low-income countries, and scalable ventures, as I’m currently helping build a new asset class through outcome-based loans that blends policy, fundraising, and impact investing.
How I can help others
I’d be glad to share lessons from investing in Malengo and from shaping policy around ISAs. I can help with questions on impact investing, outcome-based finance, structuring and scaling new financial instruments, raising capital, and how to approach GiveWell and other large grantmakers. I also draw on my background in trading and capital markets, which helps me think about how to design outcome-based loans as a durable asset class.
Comments7
The mechanics of the fund are counter-intuitive compared to standard grant-making, so let me break down the math behind the $2k and $400 figures and how they relate to the $30k cost.
1. The Recycling vs. The Multiplier Effect
I think the confusion here stems from a coincidence of numbers in my previous comment. I mentioned a $5m budget and a $5m leverage target, but those are distinct concepts.
- The Recycling Math (p25 Scenario): In this scenario, we start with $1m in philanthropic capital and invest at a gross cost of 30k per student, that sends ~32 students immediately.
- Over the next 40 years, as those students repay, the money is lent out again. Each student funds about 1.5 new students every 10 years (ie 150% recovery). In the simulation, that single $1m pot eventually funds a total of 539 students.
- This implies a multiplier of roughly 16x: For every 1 student funded by the initial donation, the returns eventually fund ~15 more.
- $30k (Gross Cost): This is the "sticker price." It is the total cash budgeted to send one student (tuition + living stipend + operational overhead) -> given our small size stays at this size.
- ~$2k (Net Philanthropic Cost): This is the unrecovered cost per student in a 40-year period. If $1m of philanthropy eventually educates 539 students (via the recycling described above), the effective cost to the donor per student is $1m / 539 = $1,855.
- ~$400 (Leveraged Cost): This assumes we achieve the 5:1 leverage ratio. If a donor provides the $1m philanthropic capital and we build a fund with it as first-loss capital, and we raise $5m in commercial debt, the system has $5m to deploy ($1m in reserve). The donor’s "cost per student" drops because their single dollar unlocked five dollars of capacity. -> Note, this is quite simplified because we become much more sensitive to assumptions while leveraged. Returns are either much greater or the risk capital is all lost.
2. Financial Viability & Blended Capital
You asked: "Something like the real rate of return on $ / euro invested in students has to be equal or greater than the interest rate on the loan?"
Yes, exactly. In nominal terms, the Net Portfolio Yield (after defaults/expenses) must be greater than Weighted Average Cost of Capital (WACC).
In the p25 scenario, the Net Portfolio Yield is 3.8% (Listed under the IRR column).
This is too low to attract pure commercial capital (Even with data, European rates for this risk profile might be 4–7%). However, this is where Blended Finance comes in. We don't need 100% commercial capital; we can stack different tranches:
- Tranche A (Philanthropy/DFI): 33% of the fund. Target return: 0%.
- Tranche B (Commercial): 66% of the fund. Target return: ~6%.
- Result: The blended Cost of Capital drops to ~4%, which makes the 3.8% return viable (or very close to it).
I have initiated talks with impact funds, DFIs, and banks to structure this. It is difficult to achieve, but within reach, so we hired a CIO. While lenders naturally want years of repayment data, there are creative ways to use philanthropic guarantees to de-risk them early on. We hope to share a more detailed write-up on the structuring of these capital stacks soon!
Thanks for this incredibly thoughtful comment and the BOTEC work! It is exciting to see someone digging into the implications for the WELLBY impact.
Here are my thoughts on your questions:
1. ISA Recovery & Cost per Person
You are right that the cost-effectiveness depends heavily on the recycling of funds. I built two related Monte Carlo simulations to assess the sensitivity of IRR, impact, and students educated to our input parameters. For the sake of brevity, I won't paste the full methodology here (it helps explain the logic behind the sheer number of variables), but I’ve attached a takeaway screenshot below. It shows how many students would be supported over the next 55 years with $1m in recycling investment.
The assumptions in our GiveWell sheet align with the p25 Scenario, which could be interpreted (539 student on an initial $1m investment, recycled) as a ~$2k cost per student.
https://malengo.org/impact_simulation/
I want to caveat that this has optimistic and pessimistic assumptions. There are some indivisibilities that could make expenses higher if the program runs at a smaller scale than a budget (explained below) of around $5m a year.
On the other hand, this represents completely unleveraged investment. With a stable underwriting model, Malengo (or similar lending with an educational migration approach) could eventually be lending against the contracts. A reasonable rule of thumb, if we are successful, would be achieving 5:1 leverage. In that scenario, $1m in the first-loss guarantee would unlock $5m in capital that would send at least 5x as many students, knocking the cost per student to $400. (Note: We might be able to swing something like 2:1 leverage at the moment, but it is a lot of work!)
In the true optimistic case, Malengo has infrastructure-like financing where donors wouldn't even need to donate to Malengo, they only offer a guarantee backed by assets in their DAF or Foundation or it is offered by a DFI and that unlocks bank loans that are serviced by the ISA obligations. In this scenario, philanthropy covers the fixed cost of building the "flywheel", while the scaling capital itself comes from credit markets.
I am hoping that our new CIO, Chad Sterbenz, will be able to post to the EA forum soon to do more justice to how this type of fund would work in practice with examples.
2. Cost Duration
To answer your clarification: Yes, the model accounts for 1-year stipend and then wrap-around support through the full duration of schooling. The "cost per person" is an all-in figure. It is derived from a conservative strategic plan: it represents the total dollars spent per student to sustain the entire organization for 20 years at a minimum viable scale (covering tuition, living cost gaps, and operational overhead), with a buffer in case a wind-down is required.
3. Disaggregated SWB/MH Measures
This is a great point about the difference between life satisfaction and affective happiness. I don't have that breakdown on hand, but I believe you are correct about the divergence. I will inquire with the research team about sharing those exact measures.
Regarding your BOTEC assumptions: Your spillover duration assumption (pegged to parents' lives) strikes me as reasonable, though perhaps conservative in scope. In practice, scholars send remittances to many family members, particularly to fund younger siblings' schooling. (We don't currently expect them to facilitate additional migration via their own funds). I actually incorporated a taper reflecting this into the impact simulation shared above after reading your comment. Thank you for that nudge!
Second, regarding the assumption that wellbeing benefits represent a flat line: I agree that is conservative. If the economic integration works as intended (see point 4), we should expect the convergence toward host-country wellbeing levels to be faster and stickier for these scholars than for the average migrant.
4. The Political Question & The OECD Graph
You anticipated the rejoinder perfectly. I’m with Alexander Kustov on this: migration has to be demonstrably beneficial to receiving countries. Migration will happen either through chaos or competence. Money can buy competence if the contract lets it.
The ISA is that contract: it pays for language, skills, and placement quality, and then pays itself back. We are betting that competence and successful integration are the best counter-arguments to populism.
As shown in your OECD chart, there is a massive gap in Germany between immigrants with foreign degrees and those with host-country degrees.
By ensuring our scholars get German degrees, we bypass the primary friction point. Our scholars face a lower "immigrant penalty" in the labor market sense; they (hopefully) perform almost identically to native-born graduates (We model 20% discount decaying as they integrate for 10 years of working). Malengo wants to demonstrate that deep economic integration can happen with sufficient resources.
https://twitter.com/jhaushofer/status/1685541903813804033?s=20
"Malengo sent two pilot cohorts of students from Uganda to Germany (6 in Fall 2021, 17 in Fall 2022). All of these students are currently in Germany and making progress towards their degrees.
- Students come from low-income families, living on USD 1.40 per person per day (USD 42 per person per month) before program entry
- After 11 months in Germany, students earn on average USD 095/month in their part-time jobs (after tax), representing a 2200% increase (1000% after taking prices into account).
- While studying, students send an average of USD 120 per month to their families in Uganda, representing a 110% increase in the remaining family members' income.
- All current Malengo students expect to graduate within 4 years; the current average (and median) grade is 2.5 (1=best, 4 = pass, 5=fail)
"
I think this is obfuscating the good points, I appreciate many of the points but they seem to be ticked off rather than front and center.
I am afraid the frame of "When to" is promoting a binary mindset which is fundamentally opposed to proper decision making.
I am reading it as attempting to have decision points for when to collapse distributions to point estimates. "Use of explicit probabilities"
You always have the explicit distribution. You always have a policy (why didn't it say policy in the alliterative p title) You always break apart the timeline and draw the causal dag.
This is offensive to reasonable planning: "Some creatures would be better served by mapping out the dynamic dependencies of the world" Always draw the dependencies!
The question is when to communicate the point estimate versus distribution. When to communicate the dependencies or just the final distribution.
People allege the crazy train when you are imagining a point estimate represents the best information that is used for making a decision. That is the implicit suggestion when you discuss point estimates.
Quick suggestions, communicating a point estimate is poor:
- When the outcomes have unequal weightings across decision makers. So each decision maker needs to attach their weights to get the weighted EV
- When decisions are sensitive to reasonable perturbation of the point estimate. Ie when two good models disagree to the point that it implies different decisions.
- When the probability is endogenous to the decisions being made.
Poker is unnecessary for the analogy, just probability of a draw from an urn.
We are speculating on how many balls are in the urn when a much better question would be Given we get the urn will we know how many balls are in it? How much does that cost? Can we do things before opening the urn that change the contents? How much does that cost?
Can we not sign for the urn when the Amazon delivery guy arrives? How much does that cost?
Ok that is a joke, but the idea is that we don't know what recourse we have and those actually are important and affect the point estimate.
The probability is downstream from certain decisions, we need to identify those decisions that affect the probability.
Does that mean the point estimate is useless, well maybe because those decisions might reduce the probability by some relative amount, ie if we get congress to pass the bill the odds are half no matter what they were before.
If you go, yeah but I say it is 27.45% and 13.725% is too high. They a decision maker goes "Sure, but I still want to halve it, give me something else that halves it stop telling me a number with no use"
You mention relative likelihood, but it is buried in a sentence of jargon I just had to search for it to remember if you said it.
Finally, frame the analysis relative to a better considered approach to Robust Decision Making, a la Decision Making Under Deep Uncertainty, not relative to Scott or Holden's world view which are just poor starting points.
First, at Malengo the students fully fund the next cohort via repaying the original donation in an ISA.
This means that funding 1 student will actually fund many students over time. Using the numbers above you get a rate of return around 6% annualized. So funding a student is sorta infinite students 0% discount rates. But that is unreasonable, so let's just cap at the next 100 years and say 2% discount rate from inflation.
BOTEC for 1 funding pays 12.5 students or a student every 8 years.
That changes your calculation from 3x givedirectly to 37.5x.
Second, you also said the students are richer but that is factually incorrect, the program is means testing to ensure that students are well targeted.
Finally, there are other fudge factors, but they are all dwarfed by the development benefits of immigration.
https://www.nber.org/papers/w29862
This shows that nearly 80% of long-run income gains are accrued within sending countries across a wide variety of channels.
Hence, I think 37.5x GiveDirectly is a completely reasonable estimate.
At the risk of being pedantic, the answer depends heavily on your decision rule regarding uncertainty (relevant: Noah Haber's work on GiveWell's uncertainty problem).
I am comfortable recommending a rule that is internally valid with all our presented assumptions. Our analysis operates in the 25th percentile of outcomes; that implies a cost per student of $1,855. (This lines up with the ~95% cost coverage in your row 39, though that is a happy coincidence!)
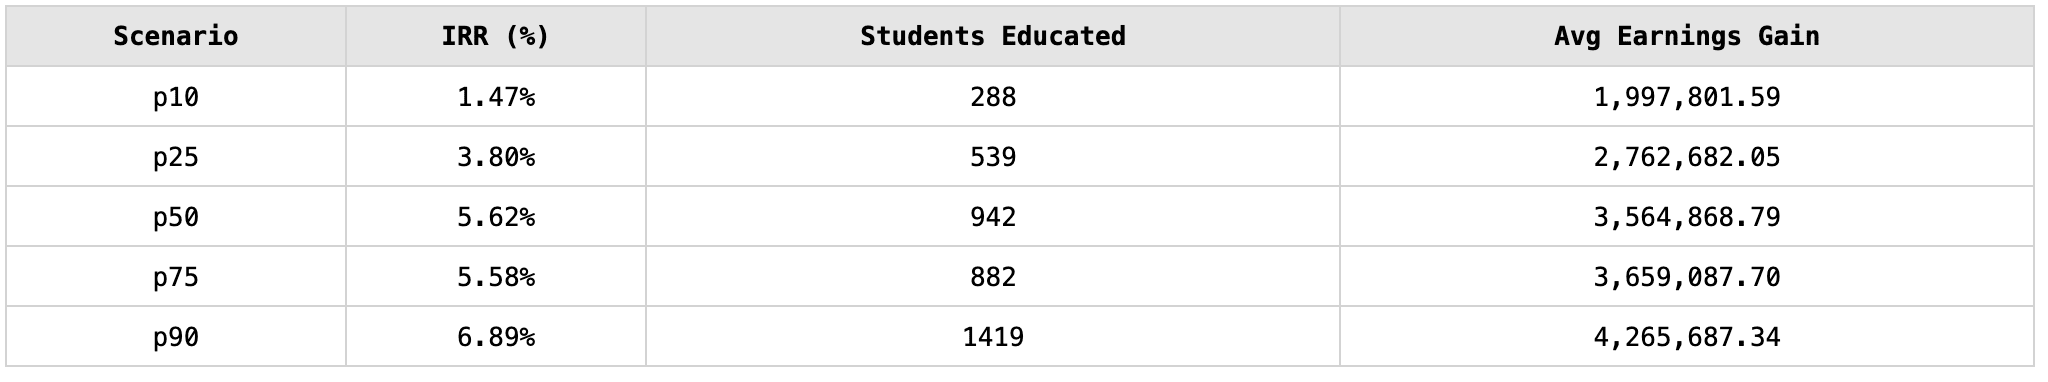
However, if you choose to weight across the distribution, here is how the cost per student evolves based on recycling performance and leverage assumptions:
Note: These figures are derived from the distribution in the top comment: $1m / (num_students * leverage).
If you want my personal "best guess": I believe management will react to the data. If we are able to iterate for a decade, we will push toward p90. The team will find cost reductions using partners and tech, optimize contract specifications to ensure we achieve the target leverage, and refine the underwriting model to find the students most likely to succeed.
So, for your BOTEC, I would put $141 per student (implying ~99.5% effective cost coverage via recycling + leverage). But bear in mind, you are speaking to the person who already made that wager!