I’m writing this in the hope that it becomes obsolete. If the next 24 months falsify these forecasts, that’s the best outcome; if they don’t, I want this to double as a playbook for mitigation.
Language note: English is not my first language (I’m a native Chinese speaker). There may be phrasing or translation gaps. If any part is unclear, please point it out—I’ll revise promptly upon feedback. Thank you for your patience and help improving the text.
Prologue | The Life-Support Economy: Hardware in Surplus, Software Outdated
You are not a failure; the system was never designed for you to succeed.
At a red light past midnight, the delivery box becomes a pillow; by day in the meeting room, KPIs stand like a wall.
Our problem has never been “Is there work,” but “Is there a life.”
We’re not dead, but put on hold by the system: the orders keep coming, yet mobility stalls; we can keep breathing, yet can’t see tomorrow.
This isn’t personal laziness—it’s structural half-oxygenation.
This is an era where even breathing is metered. You’re neither fully alive nor dead—nor merely exhausted from staying alive. You just wake each day, note “I’m still here,” and file that lingering numbness under routine.
[Vignette 1 | At the Red Light]
After his last run of the night, Xiao Zhou rests his head on the delivery box and checks the order pool once more. The app pings: “Hit 8 hours, get a ¥5 bonus.” He smiles, locks the screen, and grabs a ten-minute nap—alarm set five minutes before the next surge.
[Definition] The Life-Support Economy
Today’s society has ample “hardware” to keep people alive—power, networks, logistics, platforms, AI, education—yet runs them on outdated “software”: narratives, institutions, curricula, generational hierarchies.
The result: bodies online, spirits offline. Not too poor to survive, but unable to live meaningfully.
In short: you didn’t fail—the system was never designed with your success in mind.
[Vignette 2 | The Meeting Room]
A-K manages a ten-person product squad. The quarterly review deck says “+12% efficiency.” He deletes the “Long-Term Roadmap” slide—leadership says, hit this month’s targets first; we’ll talk roadmap next quarter. They say the same thing every quarter.
[Definition] “Life-Support” (Individual Level)
Time structure: No distinction between “today” and “tomorrow”—only the present as a billable slice.
Psychological structure: Not confusion, but fear of imagining—plans for the future are systematically compressed into the next 24 hours.
Status structure: Average job, average pay, average living standard, average family setting—everything “fine,” so living and not living feel scarcely different, a near “suspended animation.”
[Vignette 3 | First Year on the Job]
In her first year after graduation, Lanlan’s résumé is packed with “learns fast” and “executes well.” She can build dashboards, but doesn’t dare ask for a raise; she knows the process, but doesn’t dare switch tracks. Every night before sleep, she folds her “next-year plan” into tomorrow’s to-do list.
[Symptoms] Metered Breathing and a Shortened Tomorrow
Daily load loop: By day you hand your energy to performance metrics; by night you’re left with silence and short videos.
You think you’re “choosing your own hours,” but really you’re lowering your expectations to fit the system.
[Vignette 4 | On the Night Shift]
At 3 a.m., Nurse Xiao Li scrolls past a video titled “How to Reach Financial Freedom in a Year.” She taps “watch later,” sets a 20-minute alarm—the next round of rounds is about to begin.
Intimacy freeze: Even affection and desire get deferred—not from incompetence, but because uncertainty turns basic intimacy into a high-risk investment.
So “survive today first” keeps crowding out “build tomorrow.”
[Vignette 5 | The Deferred Date]
Xiao Han and Xiao Zheng change their wedding plan to “once things are stable.” “Stable” is a moving milepost: last year it meant salary, this year the mortgage, next year maybe their parents’ health.
Low-spec coherence: You treat “earning enough for today” as the passing grade. Over time, you mistake mere survival for a life.
[Vignette 6 | The Steering Wheel]
Ride-hail driver Old Chen resets his daily target from “120 rides” to “gas money + lunch + the kid’s lessons.” The goal is easier, and he feels less anxious—except at red lights, when he sometimes remembers he once studied mechanical drafting.
[Mechanism] How Half-Oxygenation Is Produced
Hardware is ample, software is outdated: high-speed networks and smart distribution ensure there are always orders to take,
but narratives and institutions offer no upgrade path—only life-support ports.
[Vignette 7 | County Livestreams]
Three studios in the same small town sell the same SKUs. The platform hands out traffic coupons; the township offers “e-commerce training.”
No one teaches branding or how to negotiate payment terms. Boxes go out by the case—and come back by the case.
Ports are occupied: the older cognitive schema sits at the decision ports; the young are used as stability patches, without upgrade permissions.
[Vignette 8 | Outside the Conference Room]
Before the plan review, the old boss pats Xiao Wang on the shoulder: “First learn to do things right—don’t always think about doing them big.”
After the meeting, the version stays the same; his “acting lead” placard hangs for yet another quarter.
Statistical invisibility: macro indicators look stable while individuals slowly evaporate. The unemployment rate looks fine; the life rate does not.
[Vignette 9 | From Unemployed to ‘Flexible’]
On her résumé, Xiao Mei changes “between jobs” to “freelancer.” On the survey, she ticks “employed.”
She is working—content for four platforms, copy for two clients, and one empty calendar reserved for herself.
[Assessment]
The Life-Support Economy isn’t a sudden catastrophe; it’s a slow-delayed death sentence.
It is gentle, respectable, almost silent—yet it chops human time into billable fragments and shrinks “tomorrow” into “the tail of today.”
When more and more people are trained not to think about tomorrow, civilization begins to sink from within, at low speed.
[Vignette 10 | Subway Window]
On a commuting morning, the windows mirror row upon row of bowed heads.
The PA announces that the “City Vitality Index hits a new high.” Xiao Zhou lowers his earbud volume by one notch—at the next stop, he’ll get off to take his first order.
All you need to remember from the prologue is one line:
Stop substituting life-support for life; stop letting the old version monopolize the ports.
I. Hardware in Surplus, Software Outdated
This is an era of “excess performance × rough software.”
The physical layer of the mass world is abundant, while the mental and humanistic layers feel factory-canned like tomato soup—stable, shelf-ready, easy to distribute; but not everyone likes tomato, and some are allergic to it.
1) Hardware layer: abundance sufficient for mere survival
Electricity, networks, logistics, AI, and education resources plug people into the system like pipelines.
So long as you log in, press the buttons, execute—staying alive isn’t hard: information is accessible, tools are at hand, tasks keep coming.
2) Software layer: a human-void “old manual”
The narratives still tell a straight story of “obey—overtime—promotion.”
Institutions continue to treat the quantifiable as the whole of value.
Education scripts favor memorization and ranking, while neglecting purpose, judgment, meaning, and sympathy.
The result: people are trained to be competent operators, but rarely permitted to be humans with direction.
3) Consequence: bodies online, spirits offline
Resources aren’t scarce; what’s scarce is the grammar of meaning.
Abilities aren’t rare; what’s rare is a narrative where those abilities belong.
So: it’s not that we’re too poor to live—it’s that we can’t live for a reason.
It’s not that inputs are missing—it’s that there’s no output of where to go.
In one line: you didn’t fail; the system was never designed for you to succeed.
Vignette | The Qualified Operator
After graduation, Lanlan processes hundreds of rows of data a day; her dashboard glows green.
She can build tables, run retros, and squeeze the error down to 0.3%.
One day a colleague asks, “What are you doing this for?”
She pauses for two seconds: “To get the error to 0.2%.”
The room is quiet, the screen is bright, and a person seems pressed flat into rows of numbers.
Wrap-up
When hardware lifts people to “able to survive,” while human narratives stay stuck at “keep it controllable,” life is placed neatly on a conveyor belt: unlikely to crash, unlikely to grow.
That is the core tension of hardware in surplus, software outdated—performance enough, purpose hollow.
II. Platform “Life-Support”: From Employment to Entrusting Survival
Our world already wobbles at the edges; platforms merely blanket it with heavy-dose analgesics that mute the pain.
Many who are unhappy with life get numbed by painkillers, not cures: awake to work, living as if asleep.
A platform is not an employer; it is a life-support machine. It doesn’t promise “better.” It only promises “don’t blow up.”
Figure 2-1 | Platform life-support loop (schematic)
Task atomization → Scoring → Dynamic rewards/penalties → Dependency lock-in (negative feedback)
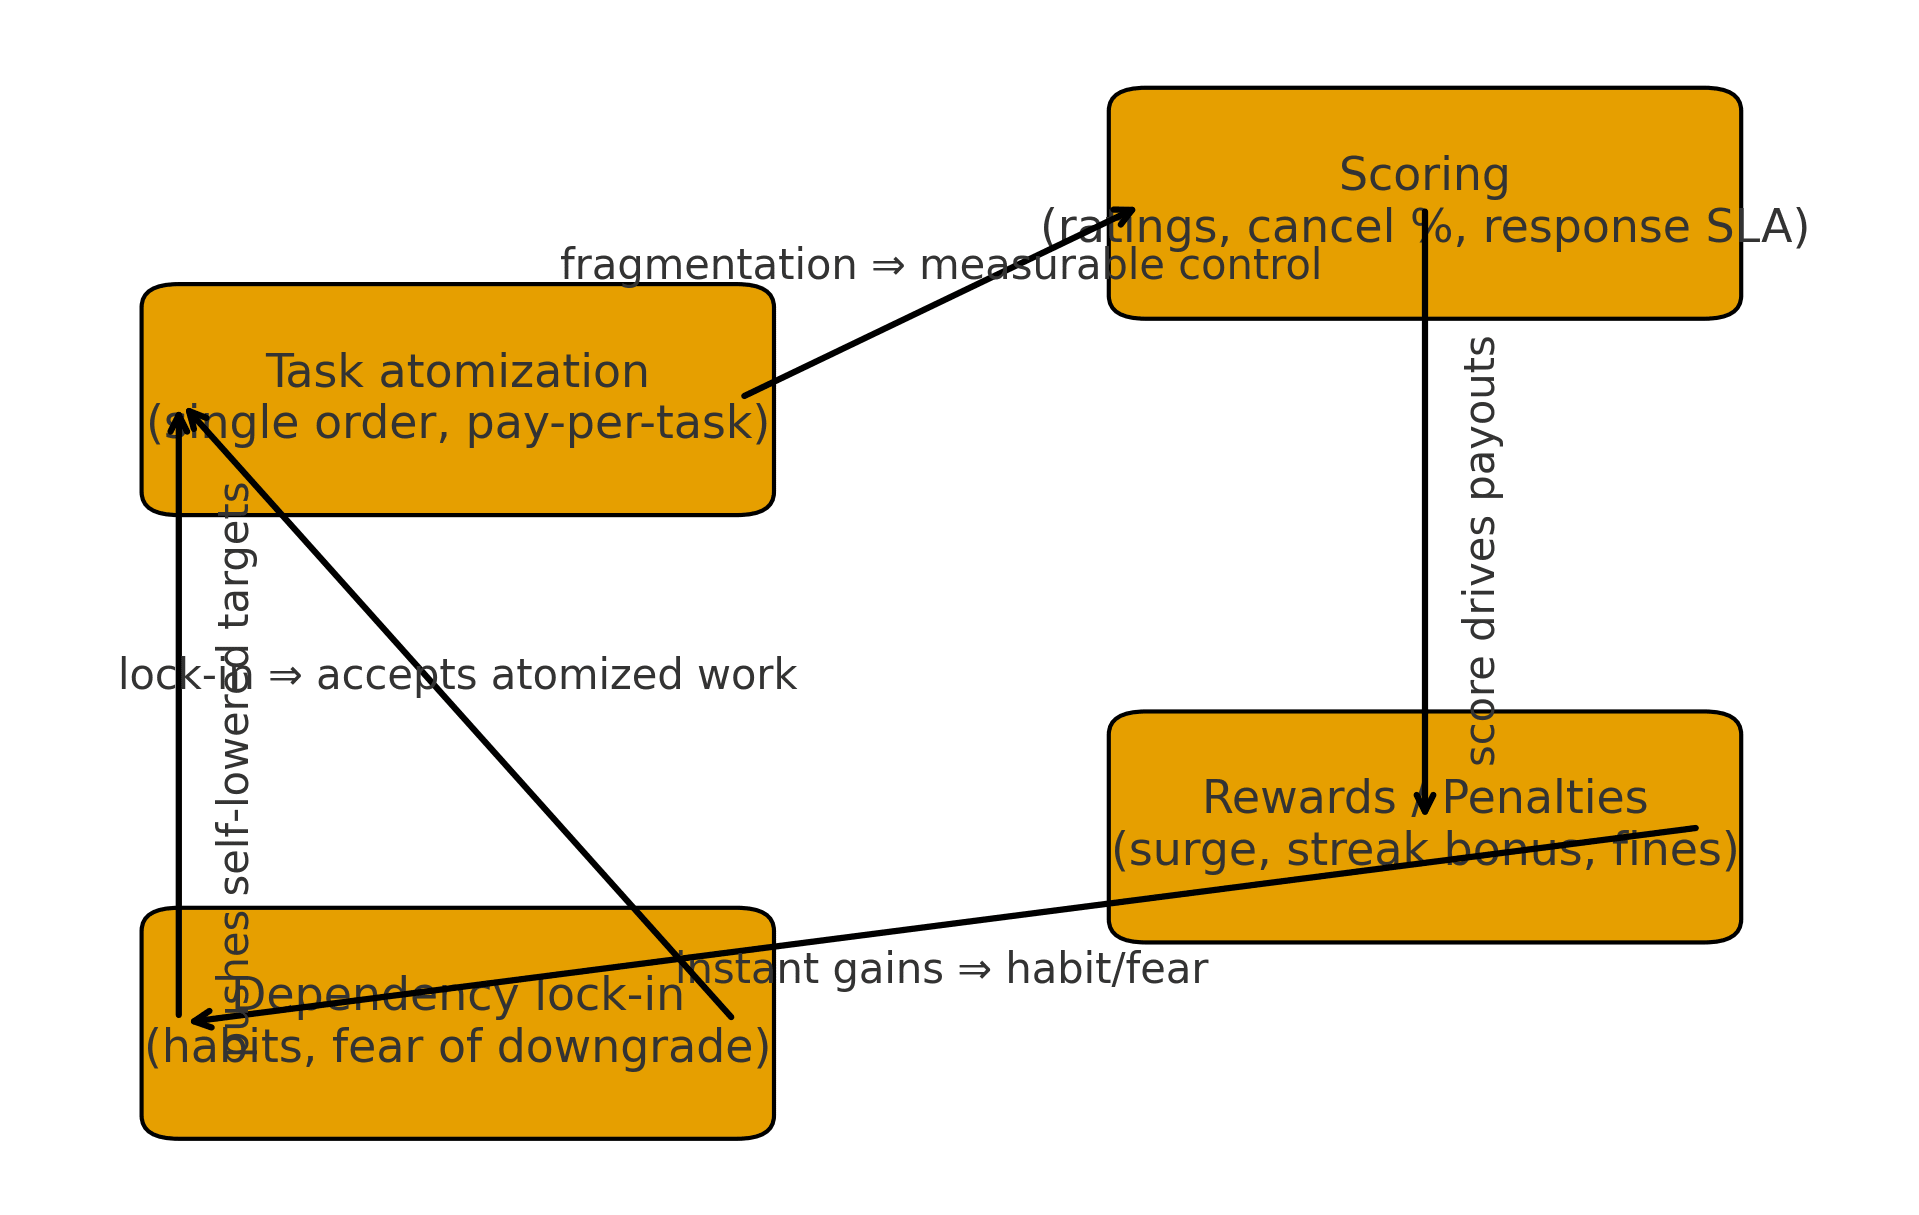
Note: Schematic illustration; not a measured workflow. Terminology follows the definitions in the text.
1) Operating logic: slicing “work” into swallowable pieces
- Task atomization: the “order” is the smallest unit—one order, one settlement; relationships are fragmented.
- Real-time scoring: stars, cancellation rate, response latency → mapped directly to traffic allocation and take rate.
- Price fluctuation: hot zones, rain boosts, streak bonuses, time-of-day surges—creating a loop of small, instant rewards.
- Automated penalties: late/low-rating/no-show → automatic deductions or throttling, with no appeal window or prohibitive appeal costs.
- Narrative packaging: executors are called “partners/creators/driver masters,” dignity substituted for rights.
- Result: you become a personal pump on a pipeline—pressure up when the system needs you, flow throttled when it doesn’t.
2) Behavioral reshaping: five steps from onboarding to addiction
- Easy onboarding: low barriers, quick training, gear on installment (you carry depreciation from day one).
- Rookie protection: traffic favors and abundant bonuses establish early positive feedback.
- Threshold-driven targets: weekly goals/consecutive online days/streak rewards pull tomorrow’s work into today.
- Fear of penalties: once downgraded or docked, recovery is hard—you spend more time hedging fear.
- Dependency lock-in: offline clients are “platformized”; every in- and out-bound port sits in the platform’s hands.
3) Triple anesthesia: strong pain relief, zero cure
- Money anesthesia: ¥5/¥8/¥20 instant bonuses, like candies that keep popping up.
- Time anesthesia: hot zones/peaks/streaks slice your day and night into billable fragments, erasing long time blocks.
- Narrative anesthesia: “flexible hours” sounds like freedom, but in practice it’s passive synchronization to the algorithm’s rhythm.
Slice A | Night Surge
Xiao Zhou shifts his sign-off time from 23:30 to 00:30—not to earn more, but to avoid losing points. A popup appears: “Complete streaks this week for another ¥20.” He pushes his alarm back by ten minutes.
4) How risk quietly moves onto you
- Gear & consumables: depreciation/repair/fuel–power for car/phone/computer/camera are on you.
- Personal risk: injury without workers’ comp, missed work without pay—“partnership” framing sidesteps labor liability.
- Cash-flow risk: longer payment cycles, higher take rates, promo deposits frozen → you front the float.
- Future risk: pensions, unemployment, retraining—fully individualized; the busier you are, the less time to self-insure.
Slice B | The Content Mill
Ami edits three clips and posts two every day, steering by platform recommendations. Followers grow; her voice feels more foreign. She doesn’t dare pause—pausing means algorithmic amnesia.
5) Statistical invisibility tricks
- Category relabeling: “flexible work / self-employment” looks like healthy employment on the report.
- Denominator magic: “active” means logged in within 7/30 days; slow exits get averaged away.
- Dignity over reality: the city’s “vitality index” rises while the life rate falls.
Slice C | The Illusion of Freedom
Old Chen says, “I set my own hours.” In truth, hot zones, surge pricing, take rates, and performance targets set his schedule. He quit the firm and entrusted his life to the system.
6) The big-platform bog: neither up nor out, sinking deeper
Not bad enough to rebel, not good enough to get free.
The most dangerous thing isn’t exploitation, but the comfortable self-employment illusion:
KPIs set by yourself, expectations lowered by yourself; hit today’s quota for today’s cash, then log off.
Day after day, life is down-spec’d on a long-term basis.
This is a gentle-looking yet rock-solid chronic entrusting of survival:
you think you’re using the platform; gradually, the platform is using you.
7) When the painkillers fail and all the pain rushes back (flashpoint)
- Costs spike: fuel/power, take rate, equipment, rent all climb—every “¥5 candy” stops working.
- Health snaps: one illness or injury breaks your streak; ratings reset, you start over.
- Algorithm revamp: rules upgrade, your mastery resets, old methods expire.
- Demand collapses: off-season or shocks; the task stream cliffs—there is no safety net.
- Family events: a parent’s illness, a child’s schooling, a partner’s job loss—you need month-sized time blocks, but only hour-sized fragments remain.
When real hardship exceeds the platform’s life-support setting,
the analgesic fails en masse—the pain doesn’t return gradually; it surges back at once,
and cities, industries—even society—flare together.
Closing
This isn’t employment; it’s entrusting survival.
Don’t mistake “flexible hours” for freedom; don’t mistake pain relief for a life.
The road ahead is not to sprinkle more candy, but to reclaim time blocks, bargaining ports, and the right to upgrade.
III. Functional Paralysis of the Middle Class & the “Intimacy Freeze Rate”
The middle class ought to be society’s pressure booster. Well-educated, decently paid, respectable and busy, they should be best positioned to convert today’s efficiency into tomorrow’s reproduction and caregiving. Yet under the structure of excess performance × humanistic deficit, they are first drained by work, then frozen by uncertainty: by day they surrender energy to KPIs; by night only silence and screens remain. Marriage is delayed, childbirth is delayed—even intimacy itself is delayed. This isn’t moral decline; it’s structural incapacity.
[Methods Note]
Strictly speaking, few countries publish nationally representative sexual-behavior or fertility-intention data disaggregated by a unified “middle class” definition. In this section, we use nationwide survey metrics as proxy variables—e.g., no sexual activity in the past year, months without sex among married couples, total fertility rate (TFR), ideal/intended number of children—and interpret them with attention to populations that substantially overlap with the middle class (higher education, urban residence, dual-income households, etc.). Please interpret with caution accordingly.
Japan — Marital Intimacy Freeze alongside Low Fertility
- Sex (official/academic definitions): In the 16th National Fertility Survey (2021) by Japan’s National Institute of Population and Social Security Research (IPSS), using “no intercourse in the past month = sexless,” about 60% of first-marriage couples with wives under 50 met the “sexless” criterion; among all couples with wives under 50, the share with intercourse in the past month was 37.9% (i.e., sexless ≈ 62.1%). [J1][J2]
- Sex (media supplement): nippon.com cites recent polling that classifies ~44% of married people as “sexless” and ~24% as “nearly sexless,” totaling ~68% in a (near) low-sex state. [J3]
- Fertility: 2023 TFR = 1.20 (record low); Tokyo fell below 1.0 for the first time. [J3]
- Mechanism side-evidence (MHLW): Materials from the Ministry of Health, Labour and Welfare list post-marital/childbearing fatigue, role shifts, and “bothersome/tired” as leading reasons for reduced sexual activity—consistent with a behavioral mechanism. [J4]
United States — Overall Decline in Sexual Activity and Diverging Fertility Intentions
- Sex: A JAMA Network Open analysis (national sample) shows men 18–24 reporting no sex in the past year rose from 18.9% (2000–2002) to 30.9% (2016–2018); rates also increased for ages 25–34. [U1]
- Fertility: CDC/NCHS provisional data for 2023: TFR ≈ 1.616, 3.59 million births; a 2024 Pew report notes that “just don’t want to” is the most cited reason (57%) among adults without children who say they’re not too/not at all likely to have children. [U2][U3]
China — Declining Births, Persistently Low Stated Intentions
- Births: According to the National Bureau of Statistics, 9.02 million births in 2023, crude birth rate 6.39‰. For robustness, we report “birth counts + international TFR range estimates”: 2023 TFR ≈ 1.0–1.1 (World Bank/UN series; official annual TFR not published each year). [C1][C2][C4]
- Intentions: The 2017 National Fertility Survey reports ideal number ≈ 1.96 and intended number ≈ 1.76 among women of childbearing age—both long below replacement. [C3]
Comparison Table — Key Metrics on Sex & Fertility (comparable definitions)
Country “Intimacy-freeze” rate (representative definition) 2023 TFR / births Notes on fertility intentions Japan Married, strict “sexless” ≈ 62% (IPSS: wife <50, no intercourse in past month). Media composite “(near) sexless” ≈ 68%. TFR = 1.20; Tokyo <1.0 Persistently low; MHLW materials cite postpartum fatigue / “bothersome” feeling among top reasons for reduced sexual activity. United States Young men reporting no sex in past year rose 18.9% → 30.9% (2000s → 2010s). TFR ≈ 1.616; 3.59M births Reasons for not having children are diversifying; “just don’t want to” accounts for 57%. China (Authoritative sex-frequency data by class are scarce; use fertility & intention as proxies.) 9.02M births; TFR ≈ 1.0–1.1 (international estimates) Ideal ≈ 1.96; intended ≈ 1.76 (persistently below replacement). - Assessment. The “intimacy-freeze rate” is not a statistic of shame—it’s a developed symptom of structural incapacity: when intimacy is persistently deferred, reproduction and caregiving naturally ebb. The middle class is best at risk assessment, and also easiest to be locked by risk—trading today’s steady state for tomorrow’s blank space.
Footnote — Why report China’s TFR as “range + births”
- Official releases: In recent years, the national TFR has not been published annually; yearbooks emphasize birth counts / crude birth rates, so academic citations often use international estimate series (World Bank / UN).
- Need for a range: Different institutions’ estimates for the same year can differ by ±0.05–0.10; a range is more robust than a single point.
- Sources of discrepancy: household-registration vs. resident-population bases; under/late reporting adjustments; differences in ASFR models; the definition of the mid-year population; and timing shifts from migration and delayed marriage/childbearing.
- Interpretive value: Presenting TFR ≈ 1.0–1.1 alongside 9.02M births lets readers grasp both the structural trend (low fertility) and the annual magnitude (birth counts) at once.
- Below is a copy-paste-ready, clickable list of references (keeping your numbering).
- J1. IPSS (National Institute of Population and Social Security Research). The Sixteenth Japanese National Fertility Survey (2021) — English Summary. PDF link
- J2. IPSS. 第16回出生動向基本調査(夫婦調査) 主報告(日本語)— 第Ⅱ部,妻<50歳の夫婦:過去1ヶ月性交なし(sexless)≈6割。 PDF link
- J3. Nippon.com. Two in Three Marriages in Japan Show “Sexless” Tendency(并引生育率与东京<1.0)。 Article
- J4. 厚生労働省. 男女の生活と意識に関する調査(婚后性生活减少主因:疲劳/麻烦等)。 PDF link
- U1. Ueda, P., Mercer, C. H., Ghaznavi, C., & Herbenick, D. (2020). Trends in Frequency of Sexual Activity and Number of Sexual Partners Among Adults Aged 18–44 Years in the US, 2000–2018. JAMA Network Open. Journal page · OA (PMC)
- U2. CDC/NCHS. Provisional Number of Births and Fertility Rates, 2023. Vital Statistics Rapid Release 35. PDF link
- U3. Pew Research Center. The Experiences of U.S. Adults Who Don’t Have Children. 2024-07-25. Report
- C1. National Bureau of Statistics of China. Communiqué on the National Population Changes in 2023. 2024-02-29. Page
- C2. World Bank Data. Fertility rate, total (births per woman) – China (2023). Data explorer
- C4. UN DESA. World Population Prospects 2024 — Data Explorer(China TFR series). Data explorer
- C3. Zhuang, Y., et al. (2020). Fertility intention and related factors in China: findings from Chinese National Fertility Survey (2017). Humanities and Social Sciences Communications. Article
IV. Cultural Workers vs. the “Republic of Ideals”
- Professionals well-trained by the system (teachers, engineers, researchers, media workers) are often tasked with maintaining procedures, yet are denied interfaces to any “republic of ideals.” History shows repeatedly: when society withholds narrative and stage, these “cultural workers” either (a) ally with grassroots actors to build their own narratives and organizations, or (b) leave behind institutional and mnemonic legacies in on-site defeats—shaping later political and social processes via “delayed victory.” To avoid over-attribution, the comparisons below use cautious phrasing such as “mainstream historiography holds / many scholars argue.”
[Methods & Scope]
- Selection principle: Choose representative cross-regional events, balancing three types—peasant/grassroots-led, culture-worker/knowledge-class–centered, and alliance models (where the two are coupled).
- Indicator framework: Compare trigger → process → outcome → long-run effects, using three elements as anchors:
- Narrative production (ideas/manifestos)
- Organizational interfaces (unions/parties/student groups/religious networks)
- Institutional uptake (constitution/elections/fiscal policy/diplomacy)
- Sources: Use Encyclopaedia Britannica (English editions) as primary entries, supplemented by long-form historical pieces from outlets like TIME; links appear at the end.
- Limits & risks: Each event carries historiographical disputes and differing emphases; judgments of “success/failure” depend on time scale (short vs. long term). The table is a comparative summary; details should follow the primary entries and first-hand sources.
- Terminology note: “Cultural workers” refers to knowledge groups with narrative production and organizational mobilization capacity (teachers, engineers, researchers, journalists/editors, etc.). It carries no moral valuation.
Table A — Uprisings Led Mainly by Peasants/Grassroots
Event Time/Place Trigger & Leadership Key Process Points Short-Term Outcome Long-Run Impact / Notes (cautious phrasing) Peasants’ Revolt (England) 1381 · England Poll tax & oppression; leader: Wat Tyler [1][2] Entered London; forced short-term royal concessions Quickly suppressed; leaders executed Many historians argue it exposed cracks in taxation and rule; institutional uptake was limited, with effects mainly in later bargaining and public-order adjustments. German Peasants’ War 1524–1525 · German states Sparked by Reformation; anti-rent/serfdom; associated figure: Thomas Müntzer [3][4] Spread widely but organizationally diffuse Bloodily suppressed by princely coalitions Mainstream historiography views it as an overlap of religious and socio-economic conflicts; subsequent impacts were largely indirect and long-term. White Lotus Rebellion 1796–1804 · Mountainous central China Religious revolt + fiscal–military corruption [5] War of attrition strained Qing finances Suppressed Many scholars note it exacerbated fiscal–military pressures on the Qing, foreshadowing 19th-century crises; assessments of its nature and scale diverge. Taiping Rebellion 1850–1864 · China Religious–political narrative + peasant mobilization; Hong Xiuquan [6] Seized Nanjing; ruled 10+ years; massive casualties Crushed by coalition of regional forces and foreign aid Evaluations vary; substantial work highlights its agenda-setting effect for late-Qing reforms in finance, military organization, and local governance. Table B — Movements/Uprisings with Cultural/Knowledge Elites as Hubs
Event Time/Place Hubs & Alliances Key Process Points Short-Term Outcome Long-Run Impact / Notes (cautious phrasing) Revolutions of 1848 (Europe) 1848 · multiple European states Liberal intellectuals + citizens + artisans [7] Uprisings and parliamentary experiments across regions Mostly failed on the spot Mainstream view: supplied agendas and vocabulary for constitutionalism and nation-state formation; institutional legacies realized gradually via later reforms. Easter Rising (Ireland) 1916 · Dublin Planned by poets/teachers/intellectuals; volunteers & citizens joined [11] Armed revolt quickly suppressed Leaders executed Often seen as catalyzing nationalist waves and providing symbolic capital and mobilizing resources for subsequent state-building. May Fourth Movement (China) 1919 (1917–1921) · China Students and intellectual circles [12] Non-violent linkage of intellectual, cultural, and political action Immediate political gains limited Commonly treated as a key node in China’s modern intellectual and political transformation; institutional effects emerged via education reform, parties, and media practice. Prague Spring → Velvet Revolution (Czechoslovakia) 1968 → 1989 · Czechoslovakia Intra-party reformers + intellectuals; later fused with civil society [8][9][10] 1968 reforms crushed by invasion; 1989 student protests sparked nationwide peaceful mobilization 1968 failed; 1989 succeeded Historiography often stresses “short defeat, long win”: reform narratives and networks bore institutional fruit in 1989. Poland’s Solidarity 1980–1989 · Poland Worker–intellectual alliance; Wałęsa et al. [13][14] Repeated bans and returns; ultimately negotiated elections Peaceful transformation within the system Widely seen as a key precursor/template for the Eastern Bloc transitions, emphasizing cross-sector interfaces among union–church–intelligentsia. Iranian Revolution 1978–1979 · Iran Religious intellectuals + broad urban alliances [15] Mass protests and general strikes Monarchy overthrown; Islamic Republic established Scholarly opinions diverge; most acknowledge powerful narrative and high institutional uptake, with contested evaluations of subsequent political trajectories. Haitian Revolution (alliance type) 1791–1804 · Haiti Revolt of the enslaved + literate/military leadership [17][18] Multi-sided struggle incl. external wars Independence achieved Mainstream scholarship: the only successful slave revolt to found a state; structurally disrupted Atlantic slavery and colonial orders. American Revolution (alliance type) 1775–1783 · Thirteen Colonies Local militias + Enlightenment leadership [19] War between colonies and metropole Independence; constitution framed Often assessed as forming a comparatively complete narrative–legal–fiscal loop, underpinning later institutional stability. Arab Spring (divergent outcomes) 2010–2011 · MENA Urban middle class/youth/professionals + grassroots [16] Region-wide cascades of contention Varied: Tunisia relatively successful; Egypt reversed; some civil wars Research stresses military stances, state resource endowments, and external factors in shaping divergence; long-run effects still unfolding. Scope note: We use cautious claims such as “mainstream historiography holds / many scholars argue.” Success/failure judgments depend on time horizon; tables are comparative summaries—see primary entries for detail.
Takeaway. Durable change needs anger × narrative × institutions. Historically, grassroots eruptions punch hard but rarely stick; culture-centered coalitions translate heat into charters, unions, constitutions, coalitions, leaving legacies even after short-run failure.
Today’s hypothesis: if teachers/engineers/researchers/media ally with squeezed urban middle classes and platform-era precarity, expect narrative capture plus a rewrite of code/content infrastructure. That might be a creative path out—or, as some scholars warn, a possible systemic fracture point.References (copy-paste ready)
[1] Encyclopaedia Britannica. Peasants’ Revolt. https://www.britannica.com/event/Peasants-Revolt
[2] Encyclopaedia Britannica. Wat Tyler. https://www.britannica.com/biography/Wat-Tyler
[3] Encyclopaedia Britannica. Peasants’ War. https://www.britannica.com/event/Peasants-War
[4] Encyclopaedia Britannica. Germany: The revolution of 1525. https://www.britannica.com/place/Germany/The-revolution-of-1525
[5] Encyclopaedia Britannica. White Lotus Rebellion. https://www.britannica.com/event/White-Lotus-Rebellion
[6] Encyclopaedia Britannica. Taiping Rebellion. https://www.britannica.com/event/Taiping-Rebellion
[7] Encyclopaedia Britannica. Revolutions of 1848. https://www.britannica.com/event/Revolutions-of-1848
[8] Encyclopaedia Britannica. Prague Spring. https://www.britannica.com/event/Prague-Spring
[9] Encyclopaedia Britannica. Velvet Revolution. https://www.britannica.com/topic/Velvet-Revolution
[10] TIME. Czechoslovakia’s Velvet Revolution Started 30 Years Ago—But It Was Decades in the Making. https://time.com/5730106/velvet-revolution-history/
[11] Encyclopaedia Britannica. Easter Rising. https://www.britannica.com/event/Easter-Rising
[12] Encyclopaedia Britannica. May Fourth Movement. https://www.britannica.com/event/May-Fourth-Movement
[13] Encyclopaedia Britannica. Solidarity. https://www.britannica.com/topic/Solidarity
[14] Encyclopaedia Britannica. Lech Wałęsa. https://www.britannica.com/biography/Lech-Walesa
[15] Encyclopaedia Britannica. Iranian Revolution. https://www.britannica.com/event/Iranian-Revolution
[16] Encyclopaedia Britannica. Arab Spring. https://www.britannica.com/event/Arab-Spring
[17] Encyclopaedia Britannica. Haitian Revolution. https://www.britannica.com/topic/Haitian-Revolution
[18] Encyclopaedia Britannica. Haiti: The Haitian Revolution. https://www.britannica.com/place/Haiti/The-Haitian-Revolution
[19] Encyclopaedia Britannica. American Revolution. https://www.britannica.com/event/American-RevolutionV. Four-Country Lesion Scan: Same Illness, Different Manifestations
With similar modern hardware, societies display different lesion patterns. This section sketches structural symptoms for four countries using comparable hard metrics, with clickable sources listed at the end (official stats, OECD/World Bank, peer-reviewed/authoritative media). Advance verdict: the common etiology is an outdated operating system—inadequate to power today’s version of life.
Japan — “Drowning in Stability”
Senior incumbents hold seats for long periods; power handover is slow; population aging coincides with low mobility.
- Super-aging: As of Oct 1, 2023, people 65+ are 29.1% of the population—among the world’s highest tiers. [1]
- Low mobility / seniority pay: OECD notes “low labor-market mobility + seniority-based wages.” Mid-career moves often come with pay cuts; a rising share of non-regular employment drags on wages and productivity. OECD repeatedly recommends easing the strong tenure / weak mobility structure to improve mid-career and older-worker employment. [2][3]
- Low productivity: Japan’s labor productivity ranks 29th of 38 OECD economies (2023). [4]
South Korea — Credential Bubble × Rigid Roles
Elites ace the exams, but the structure under-rewards them; morale sags.
- Degrees “everywhere”: Among ages 25–34, roughly 71% have tertiary credentials—the highest in the OECD (2023/2025 vintages). Yet bachelor’s wage premia vs. lower education are relatively low, signaling weak transmission from credential → job returns. [5]
- Fertility signal: TFR = 0.72 in 2023 (record low). Early 2024 ticked up to ~0.75, still extremely low. [6]
China — “Title-Deed Middle Class”
Balance-sheet assets look good; cash flow and mobility lanes are narrow. Low financial literacy amplifies fragility.
- Assets concentrated in housing: By PBoC measures, housing ≈ 59% of household assets in 2019; the CHFS shows tier-3 cities with >70% in housing—low liquidity, high sensitivity to price cycles. [7]
- Low financial literacy: S&P’s global survey puts Chinese adult financial literacy at ~28% (four basic-concept test). [8]
United States — “Tools of Freedom Intact, Visions Thin”
Median wealth whipsaws over decades; three big rigid costs sit high.
- Median net worth: The Federal Reserve’s SCF shows real median household net worth +37% (2019→2022)—the largest three-year gain in modern SCF history; but 2001–2016 was a long stretch of stagnation/decline and slow repair. Translation: “richer on paper,” unevenly and cyclically. [9]
- Rigid costs:
- Health spending $4.9T in 2023 ($14,570 per capita; 17.6% of GDP). [10]
- College tuition & fees up ~63% since 2006 (CPI subindex). [11]
- Housing: recent Census and media aggregates show mortgage and rent growth outpacing headline inflation; median mortgage ≈ $2,035/month (higher for 2024 entrants); median rent ≈ $1,307. [12]
Summary
Japan’s seniority–low mobility–super-aging mix biases organizations toward steady states; innovation and handovers are slow.
South Korea’s high credentials–low returns–ultra-low fertility pushes rational elites into wait-and-see.
China’s asset-heavy housing–weak cash flow–low financial literacy amplifies pro-cyclical fragility.
The United States’ wealth whiplash–three big fixed costs erodes the middle class’s freedom to plan long-term.Common cause: not a shortage of resources, but an outdated operating system—old narratives and institutional interfaces that can’t run today’s version of life.
References (copy-paste ready, clickable)
[1] Statistics Bureau of Japan. Current Population Estimates as of Oct 1, 2023 — 65+ = 29.1%. https://www.stat.go.jp/english/data/jinsui/2023np/index.html
[2] OECD. Economic Surveys: Japan 2024 — low labour mobility & seniority-based wages; rise of non-regular workers. (PDF) https://www.oecd.org/content/dam/oecd/en/publications/reports/2024/01/oecd-economic-surveys-japan-2024_9289b572/41e807f9-en.pdf
[3] OECD. Addressing Demographic Headwinds in Japan (2024) — seniority wages hinder mid-career mobility; retirement/eligibility ages. (PDF) https://www.oecd.org/content/dam/oecd/en/publications/reports/2024/04/addressing-demographic-headwinds-in-japan-a-long-term-perspective_85b9a67f/96648955-en.pdf
[4] Nippon.com (Japan Productivity Center). Japan’s labor productivity rank (2023). https://www.nippon.com/en/japan-data/h02240/
[5] OECD, Education at a Glance — Korea country profile (2025/2023): 25–34 tertiary attainment ≈ 71%, degree premium low. https://gpseducation.oecd.org/CountryProfile?primaryCountry=KOR&topic=EO&treshold=10
[6] Statistics Korea (KOSTAT). Birth Statistics in 2023 — TFR = 0.72. (press release) https://kostat.go.kr/board.es?act=view&bid=11773&list_no=433208&mid=a20108100000
[7] NBER Working Paper w30519 (2022), citing PBoC & CHFS: housing ≈ 59% of household assets (2019, national); >70% in tier-3 cities. (PDF) https://www.nber.org/system/files/working_papers/w30519/w30519.pdf
[8] S&P Global Financial Literacy Survey (2014) — China adult financial literacy ≈ 28%. (country scores PDF) https://gflec.org/wp-content/uploads/2016/02/Gallup-country-list-with-score.pdf
[9] Federal Reserve. Survey of Consumer Finances 2022 — Changes in U.S. Family Finances (real median net worth +37% from 2019). (PDF) https://www.federalreserve.gov/publications/files/scf23.pdf
[10] CMS. National Health Expenditure Accounts (2023) — $4.9T; $14,570 per capita; 17.6% of GDP. https://www.cms.gov/data-research/statistics-trends-and-reports/national-health-expenditure-data/nhe-fact-sheet
[11] BLS. CPI factsheet — College tuition and fees (≈ +63% since Jan 2006). https://www.bls.gov/cpi/factsheets/college-tuition.htm
[12] The Washington Post (2025-09-11) summarizing Census data — 2024 entrants’ median mortgage ≈ $2,225; overall median $2,035; median rent $1,307; housing costs outpacing inflation. https://www.washingtonpost.com/nation/2025/09/11/mortgage-rent-costs-census/
VI. Misaligned Education Scripts in the AI Era (with Figure 6-1)
Education still runs on an industrial-age assembly line: memorize, rank, obey. What reality needs, however, are abilities to build, verify, and deploy in collaboration with AI. The result is a new cohort each year with the wrong script: good at tests, bad at life; able to start a job, unable to upgrade.
Figure 6-1 | PISA 2018 → 2022 Change (Mathematics) — OECD average / China / Japan / South Korea / United States
Note: Schematic figure; see OECD PISA releases for definitions and country coverage.
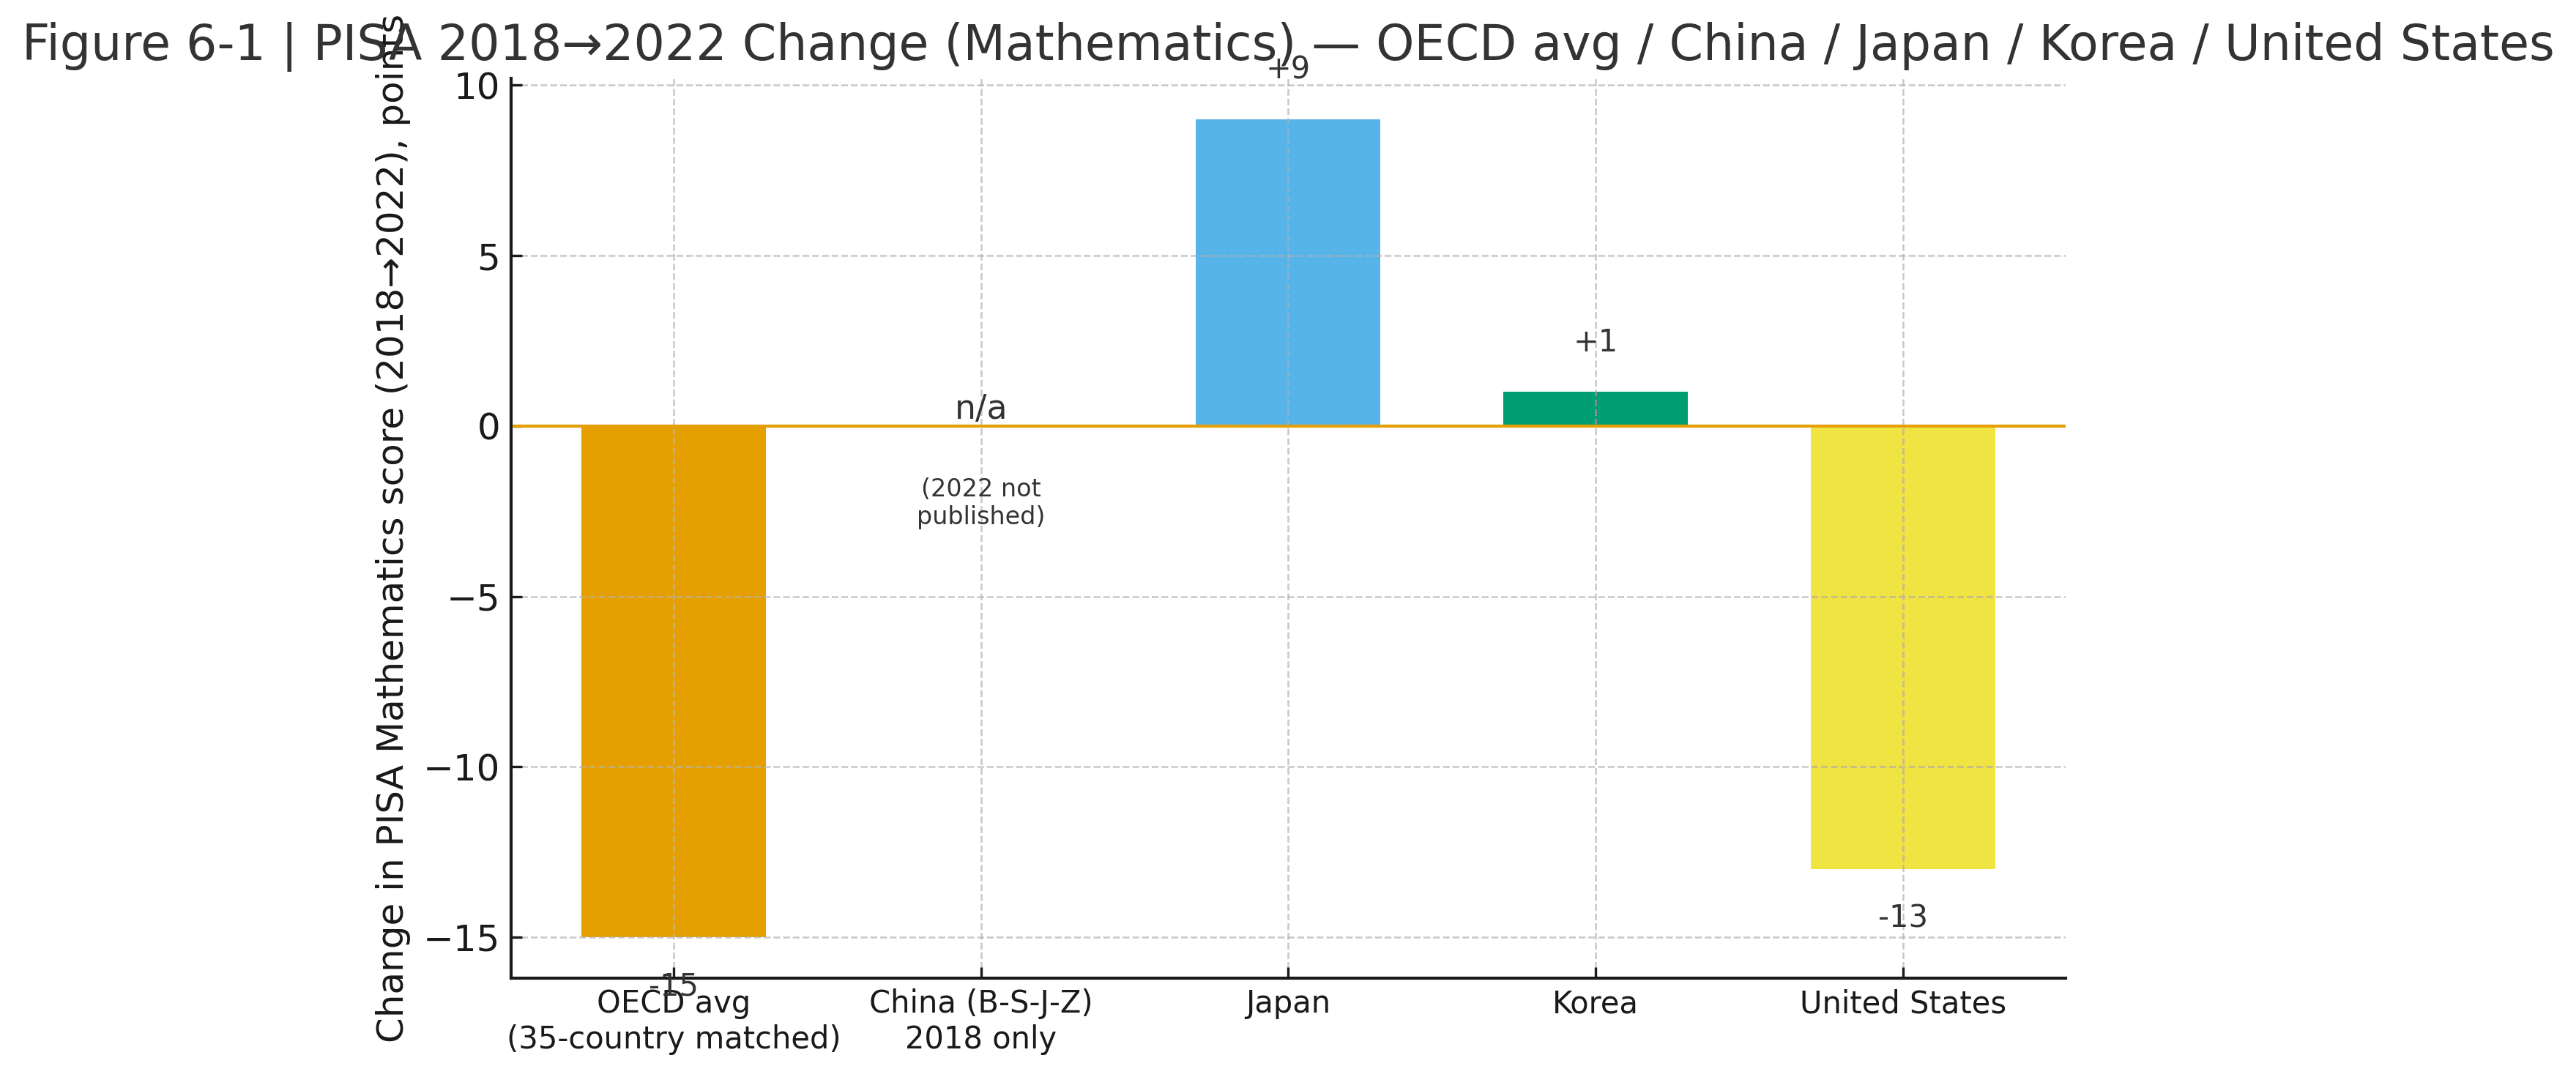
Figure note: Data source: OECD PISA. The OECD “average” refers to the 35-country matched sample change. China (B-S-J-Z) did not publish 2022 results and is therefore not comparable.
Old script | Centered on the “quantifiable”
Classroom practice and assessment still revolve around standardized items and one-way transmission; students move through a tunnel of memorize → reproduce → rank. By contrast, leading global education frameworks now foreground future-facing capacities such as creating new value, reconciling tensions, and taking responsibility. [1][2]
New demand | “Build–verify–deploy” in collaboration with AI
Employer skills scans indicate that by 2027 the most needed abilities are not single-subject knowledge but analytical thinking, creative thinking, AI & big-data literacy, and broader human–AI collaboration skills. [3][4] In entry-level hiring, employers rank problem solving, teamwork, and written/oral communication as the top three qualities. [5]
Data Nails — Twin Warnings on Learning Quality & Innovation Capacity
- Overall slide in learning quality: PISA 2022 recorded an “unprecedented decline” across many economies: versus 2018, reading fell by ~10 points and mathematics by nearly 15 points—roughly three quarters of a school year. [6][7]
- Creativity assessed at scale for the first time: PISA 2022 Creative Thinking (released 2024) shows systems that perform well on creativity also tend to do well in core subjects—suggesting innovation vs. academics is not zero-sum. [8]
- Adult adaptive problem-solving is weak: PIAAC Cycle 2 reports only about 5% of adults across participating countries reach the top level (Level 4). [9] In the U.S., ~32% are at Level 1 or below, and only ~6% at Level 4—precisely the baseline capacities needed to decompose and iterate complex tasks with AI. [10]
Conclusion — “Good at Tests, Bad at Deployment”
When schools still train for a single correct answer, but the workplace needs build–falsify–ship with AI in iterative loops, you mass-produce a script mismatch: high scores on standardized tests do not translate into posing real problems, organizing evidence, and debugging solutions in the wild.
This is not a failure of individual students. It is the system printing from the wrong script: hardware (devices, networks, models) is ample, while software (curricula, assessment, credentialing) lags behind. To avoid training a generation of answer-only operators, educational goals and metrics must align with the task structure of the AI era.
References (copy-paste ready, clickable)
[1] OECD. The OECD Learning Compass 2030 — Overview & framework. https://www.oecd.org/en/data/tools/oecd-learning-compass-2030.html
[2] OECD. Transformative Competencies for 2030 (create value / reconcile tensions / take responsibility). (PDF) https://www.oecd.org/content/dam/oecd/en/about/projects/edu/education-2040/concept-notes/Transformative_Competencies_for_2030_concept_note.pdf
[3] World Economic Forum. The Future of Jobs Report 2023. (PDF) https://www3.weforum.org/docs/WEF_Future_of_Jobs_2023.pdf
[4] World Economic Forum. Most in-demand skills in 2023 (explainer). https://www.weforum.org/stories/2023/05/future-of-jobs-2023-skills/
[5] NACE. Job Outlook 2024. (PDF) https://www.naceweb.org/docs/default-source/default-document-library/2023/publication/research-report/2024-nace-job-outlook.pdf
[6] OECD. PISA 2022 Results, Volume I — overview page (2018→2022: reading −10, math −15; “unprecedented decline”). https://www.oecd.org/en/publications/pisa-2022-results-volume-i_53f23881-en/full-report.html
[7] OECD. PISA 2022 Results, Volume I — full report. (PDF) https://www.oecd.org/content/dam/oecd/en/publications/reports/2023/12/pisa-2022-results-volume-i_76772a36/53f23881-en.pdf
[8] OECD. New PISA results on creative thinking (PISA in Focus, 2024). (PDF) https://www.oecd.org/content/dam/oecd/en/publications/reports/2024/06/new-pisa-results-on-creative-thinking_7dccb55b/b3a46696-en.pdf
[9] OECD. Adult problem-solving skills (PIAAC Cycle 2) — overview. https://www.oecd.org/en/topics/sub-issues/adult-problem-solving-skills.html
[10] OECD. Survey of Adult Skills 2024 — Country Note: United States. https://www.oecd.org/en/publications/survey-of-adults-skills-2023-country-notes_ab4f6b8c-en/united-states_427d6aac-en.html
Figure 6-1 data footnotes (clickable)
• USA — 2018 math = 478 (NCES PISA 2018 Highlights): https://nces.ed.gov/surveys/pisa/pisa2018/pdf/PISA2018_compiled.pdf ; 2022 math = 465 (OECD GPS USA): https://gpseducation.oecd.org/CountryProfile?primaryCountry=USA&topic=PI
• Japan — 2018 math = 527 (World Bank PISA 2018 Japan brief): https://documents1.worldbank.org/curated/en/641131593351382002/pdf/Japan-PISA-2018-Brief.pdf ; 2022 math = 536 (OECD GPS Japan): https://gpseducation.oecd.org/CountryProfile?primaryCountry=JPN&topic=PI
• Korea — 2018 math = 526 (World Bank PISA 2018 Korea brief): https://documents.worldbank.org/curated/en/439371593351778846/pdf/Korea-PISA-2018-Brief.pdf ; 2022 math = 527 (OECD GPS Korea): https://gpseducation.oecd.org/CountryProfile?primaryCountry=KOR&topic=PI
• OECD average change — ≈ −15 (35-country matched sample; “Changes in performance”): https://www.oecd.org/en/publications/pisa-2022-results-volume-i_53f23881-en/full-report/changes-in-performance-and-equity-in-education-between-2018-and-2022_036321c5.html
• China (B-S-J-Z) — 2022 results not published; see Wikipedia summary (notes on data collection limits): https://en.wikipedia.org/wiki/Programme_for_International_Student_Assessment#PISA_2022_ranking_summary ; and HK Government appendix on participation definitions: https://gia.info.gov.hk/general/202312/05/P2023120500451_441263_1_1701773769080.pdf
VII. Pensions and the Collapse of Trust: Fiscal Gaps Are the Symptom, Structural Mismatch Is the Disease
The “gap” isn’t that the money is gone—it’s that the software is outdated: a misfit across the price side (indexation) × asset side (investment constraints) × demographics (dependency ratio / tax base) × institutional parameters (eligibility rules).
Judgment. What’s called a “pension crisis” is less a fiscal crisis than a structure–mechanism mismatch. In plain language, the chain runs like this:
inflation indexation (benefits linked to CPI) → social-security savings eroded by inflation → true returns depressed by investment/regulatory constraints → deteriorating contribution base & dependency ratio → public trust collapses in the system’s ability to “catch” them.
The U.S. and China travel different paths, but share a core problem: old software (indexation rules, investment ranges, demographic parameters, eligibility settings) can’t power the new mix of population–prices–assets.
Mechanism Chain | Four Coupled Sides
A. Price side (indexation). Benefits are tied to price indices (e.g., CPI/CPI-W). When prices rise, the benefit baseline is ratcheted up.
B. Asset side (investment constraints). Fund portfolios face statutory/policy limits on asset classes and duration; nominal yields struggle to outpace price-linked benefit growth over time.
C. Demographic side (dependency ratio / tax base). The worker-to-beneficiary ratio declines; tax-base ceilings or limited elasticity cap contribution growth.
D. Institutional side (eligibility parameters). Retirement age, vesting years, pooling radius, and the pace/amplitude of adjustments determine cash-flow sustainability.
(1) Accounting Identity & the “Scissors Gap”
Payable this period
= Contributions this period (tax rate × wages × number of workers)
- Last period’s balance × this period’s yield
− This period’s benefits (incl. indexation/parametric adjustments)
± Fiscal transfers.
So long as benefit growth (anchored by inflation or rules)
contribution growth + real returns on balances,
the shortfall isn’t cyclical noise—it’s a structural trend.
Figure 7-1 | Pension OS Coupling
Prices (indexation) ↔ Assets (investment constraints) ↔ Demographics (support ratio / tax base) ↔ Policy (eligibility parameters)
Note: Schematic; illustrates feedbacks among the four sides of the system rather than measured flows. Terms follow definitions in the text.
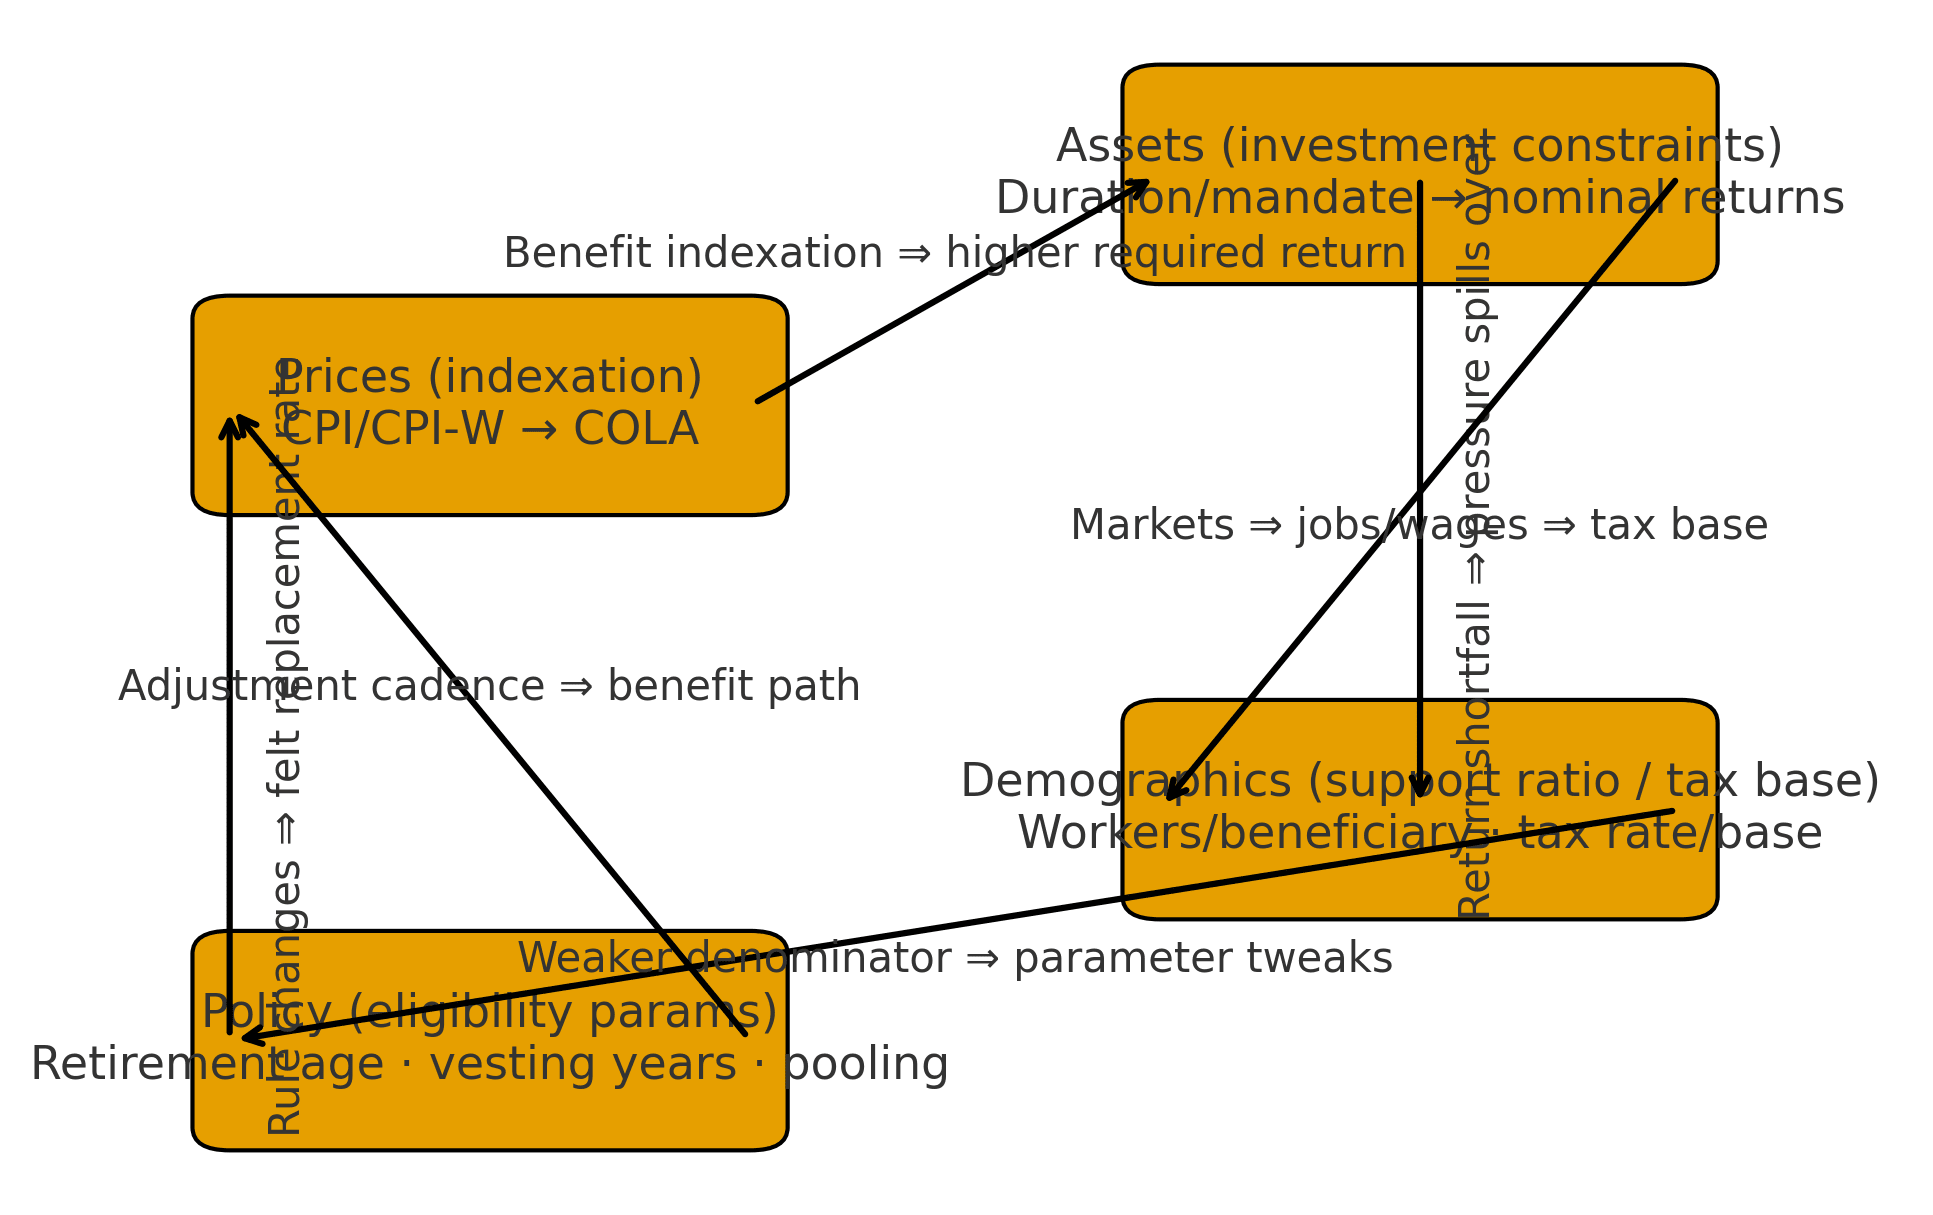
Note: Schematic illustration. For sources and definitions, see SSA, NBS, NCSSF, and ILO references at the end of this chapter.
(2) United States: Inflation → COLA ratchet → Special-Treasury constraint → Denominator drift
- Benefits indexed to inflation. Social Security applies an annual COLA based on CPI-W. Officially set: 2025 COLA = 2.5% (was 3.2% in 2024; 8.7% in 2023). [1][2][3]
- Asset side constrained by law. Trust funds may invest only in special-issue U.S. Treasury securities, with rates set monthly by statute; when inflation rises and rate adjustments lag, nominal returns can trail benefit indexation. [4][5]
- Denominator weakening (workers per beneficiary). The worker/beneficiary ratio has trended down from 3–4:1 decades ago to about 2.7:1 in recent years. The payroll tax rate is fixed at 12.4% by law, and the taxable wage base has an annual cap ($176,100 in 2025). [6][7]
- Mechanics (no bankruptcy; proportional payouts). Under current law, even after reserves are depleted, payroll taxes keep coming in, so benefits don’t go to zero—they are paid at a uniform proportion of incoming revenue. 2025 Trustees’ median scenario: OASI ≈ 77% from 2033; OASDI ≈ 81% from 2034. [8][9]
(3) China: Low-volatility inflation + prudent investment bounds → limited real returns; rely on pooling & later retirement as offsets
- Demographics / denominator reality. 2024 births: 9.54 million; deaths: 10.93 million; total population: 1.40828 billion. Old-age dependency keeps rising; the contribution base cannot “expand naturally.” [10]
- Fund returns & bounds. NSSF investment return in 2023 ≈ 0.96% (≈ 1.02% ex-nonrecurring). Entrusted investment for the basic pension posted ≈ 2.42% in 2023. Given price/benefit constraints, long-run real returns are tight. [14][15]
- Institutional offsets. Since 2022-01-01, enterprise employees’ basic pension has advanced toward national pooling / central adjustment; starting 2025, a 15-year gradual increase in statutory retirement ages (men 60→63; female cadres 55→58; female workers 50→55), and from 2030 the minimum contribution years will be raised from 15 → 20. [13][11][12]
- Key mechanic. There is no “automatic proportional cut” clause; sustainability leans on national pooling + parametric reform (retirement age, required years, contribution base) to maintain cash flow and equalize across regions.
(4) Side-by-Side Mechanics: U.S. vs. China
Dimension United States (Social Security) China (Urban Employees’ Basic Pension / National Pooling) Price indexation Automatic COLA tied to CPI-W (hard-wired in law). [1][2][3] Annual/policy adjustments (administrative decisions). Asset allocation May hold only special-issue U.S. Treasuries (statutory constraint). [4][5] Entrusted investment as the core, with clear risk bounds; prudence-oriented mandate. [14][15] Denominator / tax base Workers per beneficiary ≈ 2.7 and trending down; payroll tax fixed at 12.4%; annual cap on taxable wage base (2025: $176,100). [6][7] Old-age dependency rising; expand the denominator via later retirement and higher minimum contribution years. [10][11] Gap trigger / backstop When reserves are exhausted → automatic proportional payouts from current payrolls (not bankruptcy). [8][9] Regional imbalances → national pooling / central adjustment; offset via parametric reforms. [13][11][12] Policy levers Change tax rate / wage-cap / benefit formula (requires Congress). Broaden pooling radius, raise retirement age, adjust years / base (administrative + legislative). Trust narrative Expectation of across-the-board proration after 2033/2034 dampens confidence among younger cohorts. Uncertainty over eventual payout and pace of later retirement fuels anxiety about “will it arrive / how much remains.” (5) Why trust collapses before the money runs out
- What people feel is the real replacement rate (post-retirement take-home / in-work income), not the balance sheet.
In the U.S., the rule-of-thumb expectation is “no bankruptcy; proportional payouts”; in China, the working path is “national pooling + parametric offsets.”
Both mean the rules will change how much you actually receive when you retire—so an early collapse of trust is a rational response. (6) Counterexamples & boundaries
- When a three-part package is used—one-off restructuring + transparent loss recognition + time-bounded support—“makeshift governance” can be reduced. Examples include Nordic post-crisis asset-management company (AMC) models, clearly defined exit clocks, and ex-ante statements about how legacy claims will be treated.
(7) Falsifiable forecasts (12–24 months)
- United States. Debate intensifies around raising the taxable wage cap / parameter tweaks; absent legislation, public awareness of 2033/2034 proportional payouts continues to rise.
- China. The coverage radius of national pooling expands further; detailed rules for later retirement and the increase of minimum contribution years become clearer; several provinces stabilize current gaps via central adjustment.
- Both countries. Younger cohorts ratchet down their expected public-pension replacement rates; personal supplementary pensions / capital-market literacy become one policy focal point.
Terms & Definitions (scope notes)
- “No bankruptcy; proportional payouts.” In the U.S. system, once the OASI trust fund balance is exhausted, Social Security does not go to zero; by law, scheduled benefits are paid at a uniform proportion of incoming payroll-tax revenue. [8][9]
- “National pooling / central adjustment.” In China, a nation-level fund pool reallocates across provinces to mitigate structural imbalances between contribution inflows and benefit outflows. [13]
- Data sources. U.S. figures from SSA (COLA, investment scope, workers-per-beneficiary). China figures from the National Bureau of Statistics and NCSSF annual reports. All links in this chapter are clickable for verification.
- References (copy-paste ready, clickable)
- [1] SSA. Cost-of-Living Adjustment (COLA) Information for 2025 — 2023 +8.7%; 2024 +3.2%; 2025 +2.5%. https://www.ssa.gov/cola/
- [2] SSA. 2025 Social Security Changes — COLA Fact Sheet. (PDF) https://www.ssa.gov/news/press/factsheets/colafacts2025.pdf
- [3] BLS. CPI — CPI-W (COLA statutory series) methods & data. https://www.bls.gov/cpi/
- [4] SSA. Trust Fund FAQs — investments only in special-issue Treasuries. https://www.ssa.gov/oact/progdata/fundFAQ.html
- [5] SSA. Social Security Interest Rates — statutory formula, monthly postings. https://www.ssa.gov/oact/progdata/intRates.html
- [6] SSA. Fast Facts & Figures 2024 — Workers-per-Beneficiary series. https://www.ssa.gov/policy/docs/chartbooks/fast_facts/2024/fast_facts24.html
- [7] SSA. Contribution and Benefit Base — 2025 taxable max $176,100; OASDI rate 12.4%. https://www.ssa.gov/oact/cola/cbb.html
- [8] SSA. 2025 OASDI Trustees Report — Highlights — OASI ≈ 77% from 2033; OASDI ≈ 81% from 2034. https://www.ssa.gov/oact/TR/2025/II_A_highlights.html
- [9] SSA. The 2025 Annual Trustees Report. (PDF) https://www.ssa.gov/oact/tr/2025/tr2025.pdf
- [10] NBS (2025-02-28). 2024 year-end population communiqué — births 9.54M, deaths 10.93M, total 1.40828B. https://www.stats.gov.cn/english/PressRelease/202502/t20250228_1958822.html
- [11] Xinhua (2025-01-02). China to implement 15-year gradual later retirement from 2025; minimum contribution years rise to 20 from 2030. https://english.news.cn/20250102/92d63633a4a940568a46868a420470df/c.html
- [12] Reuters (2024-09-13). China approves plan to raise retirement age from Jan 2025. https://www.reuters.com/world/china/chinas-legislature-approves-draft-proposal-raise-retirement-age-2024-09-13/
- [13] ILO (2022-05-12). China starts nationwide pooling of basic pension funds. https://www.ilo.org/media/373666/download
- [14] NCSSF. National Social Security Fund — 2023 Annual Report: investment return 0.96% (ex-nonrecurring 1.02%). https://www.ssf.gov.cn/portal/xxgk/fdzdgknr/cwbg/sbjjndbg/webinfo/2024/10/1730355860076084.htm
- [15] NCSSF. Basic Pension Fund Entrusted Investment — 2023 Annual Report: return 2.42%. https://www.ssf.gov.cn/portal/xxgk/fdzdgknr/cwbg/yljjndbg/webinfo/2024/10/1730355866159377.htm
VIII. The “Makeshift System” Thesis: Structural Choices for Short-Run Stability
- [Citation note | Historical cases in this section]
This section draws on the comparative cases below. In the text, we mark endnote-style references as [S8-#] and list the links at the end. - Weimar Germany (1921–1923): passive resistance + deficit monetization → hyperinflation.
- Zimbabwe (2007–2008): enforced price caps + coercive “price policing” → empty shelves, hyperinflation.
- Venezuela (2003–2020s): price/FX controls + nationalization → chronic shortages and outflows.
- Sri Lanka (2019–2022): tax cuts + defended FX peg + fertilizer ban → sovereign default & political upheaval.
- Lebanon (1990s–2020s): fixed FX + “financial engineering” → banking-system collapse.
- Greece (2001–2010): window-dressed accounts + swaps to mask debt → sovereign crisis & mass protests.
- Late Soviet Union (1980s–1991): price controls + half-finished reforms → systemic shortages & dissolution.
Judgment | Why design policies that “obviously” break later?
- Because the real-world objective isn’t “the optimal solution,” it’s “the least pain right now.” When the clock only grants today, hierarchies reward stability, and budgets cover only patchwork, the system naturally picks what survives the night.
- Don’t blow up today; talk about tomorrow tomorrow.
- Spread responsibility across departments; outsource the blame.
- Short-run steady state > long-run viability.
- This isn’t a conspiracy; it’s a rewritten objective function. From the outside it looks like precision machinery; open it up and you find zip ties, duct tape, shims, and staples.
Definition | What is a “Makeshift System” (草台系统)
- “Makeshift” doesn’t mean incompetence; it is rational patchwork under hard constraints: use the cheapest materials and the fewest changes to paper over the most visible cracks so tonight’s show can go on. It doesn’t seek durability—only survival for now.
Toolkit | Eight Go-To Moves of a Makeshift System
- Metric engineering: swap statistical bases / smoothing methods / sample windows to make curves look “smoother.”
- Buffer & delay: stretch payment terms, roll pilots forward, offer temporary discounts—spread today’s pain into the future.
- Price shields: temporary subsidies, red lines, tax/fee tweaks—press down the felt pain points.
- Responsibility pass-through: outsource uncertainty to households (out-of-pocket), platforms (take rates/rules), localities (pooling/targets).
- Threshold design: set “red lines/pass lines” that steer behavior to hug the threshold (Goodhart’s Law, live on stage).
- Selective transparency: window guidance / oral policy—keep maneuvering room.
- Shadow capacity: temps, outsourcing, platform traffic, volunteers—grey capacity to catch peaks.
- Narrative stabilizers: rename without reform (“upgrade,” “optimization”)—smooth expectations with rhetoric.
Slices | Where you’ve seen it
- Power peak shaving: time-of-use pricing & staggered use flatten peaks without enlarging base capacity.
- Platform dispatch: bonuses / throttling / ratings smooth supply–demand—and shift the volatility onto labor.
- Fiscal balancing: deferrals / cross-adjustments / one-off funds plug this year’s gap while long-run rules lag.
- Education/health KPIs: indicators look “pretty”; problems migrate to queues, household burden, off-campus time, etc.
Side Effects | Stabilize today, hollow out tomorrow
- Path lock-in: tech debt + institutional debt stack up; every patch makes reconstruction harder.
- Innovation suppression: error-averse culture favors compliant but ineffective solutions.
- Trust erosion: take-home experience worsens / rules keep shifting—trust falls before funds run out.
- Household balance-sheet blowout: risks swell on families (co-pays, overdrafts, time fragmentation).
- Capacity evaporation: shadow capacity is normalized; when a real crisis hits, no buffer remains.
Spotter’s Checklist | Five tells of “makeshift-ization”
- Pilots never close: missing a hard wrap-up & reconciliation.
- Temporary policies go permanent: time-limited tools get rolled over until they become de facto rules.
- Frequent metric/base changes: narrative races ahead of data.
- Longer blame chains: more “co-owners,” harder to pin responsibility.
- Denser explanatory prose: updates/FAQs/“scope notes” multiply—signals the underlying contract is sliding.
Historical Parallels — Makeshift Policies & Consequences (brief endnotes)
◼ Weimar Germany: Passive resistance + deficit monetization → 1923 hyperinflation (see [S8-1] [S8-2])
- Time/Place: 1921–1923 · Germany
Makeshift policies: - Covered fiscal deficits and the Ruhr “passive resistance” largely by issuing paper marks (deficit monetization).
Short-run (surface) stability: - Nominal wages/subsidies kept day-to-day operations going, briefly easing the cash-flow crunch.
Outcome/aftershocks: - Prices spiraled, the currency collapsed, and political turmoil followed; the system was reset with the Rentenmark.
◼ Zimbabwe: Forced “half-price” orders + price policing → empty shelves (see [S8-3] [S8-4] [S8-5] [S8-6])
- Time/Place: 2007–2008 · Zimbabwe
Makeshift policies: - Administrative decrees cut many retail prices by ~50%, enforced by police and military.
- Simultaneous rapid monetary issuance; true inflation was obscured during periods when data publication was halted.
Short-run (surface) stability: - A short-lived sense that “prices came down,” tempering headline outrage.
Outcome/aftershocks: - Widespread shortages and a burgeoning black market; by 2008, extreme hyperinflation forced abandonment of the local currency.
◼ Venezuela: Price/FX controls + nationalization → chronic shortages & outflows (see [S8-7] [S8-8] [S8-9] [S8-10])
- Time/Place: 2003–2020s · Venezuela
Makeshift policies: - Broad price caps and multiple exchange rates (e.g., CADIVI foreign-exchange rationing), alongside nationalizations/expropriations.
- Periodic crackdowns on parallel-rate quotes and black markets (information suppression).
Short-run (surface) stability: - Temporarily suppressed sticker prices and the official FX rate; “availability” maintained on paper via administrative rationing.
Outcome/aftershocks: - Persistent shortages, recurrent (hyper)inflation, sovereign default, mass emigration, and repeated waves of protest.
◼ Sri Lanka: Tax cuts + defended FX + fertilizer ban → default & political upheaval (see [S8-11] [S8-12] [S8-13])
- Time/Place: 2019–2022 · Sri Lanka
Makeshift policies: - Large tax cuts in 2019, monetized fiscal support, and defended exchange rate; in 2021, a sudden ban on chemical-fertilizer imports / forced “organic” shift.
Short-run (surface) stability: - Briefly pressed down posted prices and massaged input-cost statistics; attempted expectation-management.
Outcome/aftershocks: - Agricultural output fell, FX reserves collapsed, fuel/medicine shortages, sovereign default, and mass protests culminating in the president’s resignation.
◼ Lebanon: Fixed FX + “financial engineering” → Ponzi-like collapse (see [S8-14] [S8-15])
- Time/Place: 1990s–2020s · Lebanon
Makeshift policies: - Long-running exchange-rate peg plus high-interest deposit schemes; “financial engineering” rolled old debts forward (Ponzi-like dynamics).
- Subsidies and dual-price systems masked true costs.
Short-run (surface) stability: - Preserved the appearance of a stable peg and banking system for a time.
Outcome/aftershocks: - Funding chain broke, banks collapsed, poverty spiked; sustained protests after 2019.
◼ Greece: Cosmetic accounts + swaps as cover → sovereign crisis & mass protests (see [S8-16] [S8-17] [S8-18] [S8-19])
- Time/Place: 2001–2010 · Greece
Makeshift policies: - Multiple rounds of fiscal data “revisions” and ESA95 non-compliance; offshore swaps used to prettify debt metrics.
Short-run (surface) stability: - Briefly met euro-area fiscal appearances, delaying adjustment.
Outcome/aftershocks: - 2009–2010 sovereign-debt crisis, harsh austerity, mass protests; reforms in statistical governance.
◼ Late Soviet Union: Price controls + half-built reforms → systemic shortages & dissolution (see [S8-20] [S8-21])
- Time/Place: 1980s–1991 · USSR
Makeshift policies: - Long-term price controls and planned rationing; amid downturn, half-measures toward marketization plus wage hikes and monetary expansion.
Short-run (surface) stability: - Temporarily eased the tension between nominal incomes and controlled prices.
Outcome/aftershocks: - Persistent shortages, fiscal imbalance, and ultimately political dissolution.
Summary
- Across these cases, surface stability never substitutes for structural repair. Once buffers—reserves, credibility, enforcement capacity—are overdrawn, the system tends to settle accounts more violently later on.
- References (copy-paste ready, clickable)
- [S8-1] Encyclopaedia Britannica. Hyperinflation in the Weimar Republic. https://www.britannica.com/event/hyperinflation-in-the-Weimar-Republic
[S8-2] Encyclopaedia Britannica. Germany: Years of crisis 1920–23. https://www.britannica.com/place/Germany/Years-of-crisis-1920-23
[S8-3] The Guardian. Government orders prices halved; violators face heavy penalties. https://www.theguardian.com/world/2007/jul/05/zimbabwe.topstories3
[S8-4] VOA. Price-cut enforcement forces firms to shut. https://www.voanews.com/a/a-13-2007-10-18-voa12/400665.html
[S8-5] IMF Working Paper (2007). High Inflation Countries & Zimbabwe context. https://www.imf.org/external/pubs/ft/wp/2007/wp0799.pdf
[S8-6] Hanke & Kwok (2009). Measuring Zimbabwe’s Hyperinflation. https://www.centerforfinancialstability.org/hfs/Hanke_Kwok_Zimbabwes_Hyperinflation.pdf
[S8-7] Brookings (2018). Price/FX controls and supply collapse in Venezuela. https://www.brookings.edu/wp-content/uploads/2018/10/FP_20181023_venezuela.pdf
[S8-8] U.S. CRS (2022). Background on price and exchange-rate controls. https://sgp.fas.org/crs/row/R45072.pdf
[S8-9] U.S. GAO (2021). Causal discussion of shortages & high inflation. https://www.gao.gov/assets/gao-21-239.pdf
[S8-10] IMF Executive Board Statement (2018). On Venezuela. https://www.imf.org/en/News/Articles/2018/05/02/pr18158-statement-by-the-imf-executive-board-on-venezuela
[S8-11] World Bank (2023/2024). Quantitative assessment of fertilizer ban. https://documents1.worldbank.org/curated/en/099557412122318720/pdf/IDU104598f2e1bdd714d911a7781a48abca1ac80.pdf
[S8-12] The Guardian (2022). Protests escalate; president resigns. https://www.theguardian.com/world/2022/jul/09/sri-lanka-protests-thousands-storm-presidents-residence-colombo
[S8-13] AP / IMF tracker (2023). Reform & relief progress. https://apnews.com/article/cd7b2fde23d6dd2fc7091e451323e559
[S8-14] World Bank (2022). Lebanon’s ‘Ponzi finance’ press release. https://www.worldbank.org/en/news/press-release/2022/08/02/lebanon-s-ponzi-finance-scheme-has-caused-unprecedented-social-and-economic-pain-to-the-lebanese-people
[S8-15] Reuters (2021). How Lebanon’s meltdown happened (Ponzi-like dynamics). https://www.reuters.com/world/middle-east/lebanons-financial-meltdown-how-it-happened-2021-06-17/
[S8-16] EU/Eurostat (2010). Report on Greek government deficit & debt statistics. https://ec.europa.eu/eurostat/documents/4187653/6404656/COM_2010_report_greek/c8523cfa-d3c1-4954-8ea1-64bb11e59b3a
[S8-17] European Commission / Eurostat (2004). Revision report. https://ec.europa.eu/eurostat/documents/4187653/5765001/GREECE-EN.PDF/2da4e4f6-f9f2-4848-b1a9-cb229fcabae3?version=1.0
[S8-18] ESM (2020). Origins of the Greek crisis — overview. https://www.esm.europa.eu/sites/default/files/esmdp9.pdf
[S8-19] The Guardian (2010). Goldman swaps & hidden debt. https://www.theguardian.com/business/2010/feb/28/goldman-sachs-investment-banking-greece
[S8-20] Encyclopaedia Britannica. Why did the Soviet Union collapse? https://www.britannica.com/story/why-did-the-soviet-union-collapse
[S8-21] Encyclopaedia Britannica. The Gorbachev era: perestroika and glasnost. https://www.britannica.com/place/Russia/The-Gorbachev-era-perestroika-and-glasnost IX. Seniority Mechanisms & Version Lock-In
- (Asia focus: Japan/Korea → China → transition to the West)
- Thesis. This isn’t about a few “old guys refusing to step down.” It’s an old operating system that hard-codes seniority = permissions into the division of labor:
- Decision layer runs on old cognition while holding new interfaces.
- Young people are treated as stability patches, without upgrade permissions.
- The system neither crashes nor reboots—it just idles in a low-innovation steady state.
A. Japan: From nenkō-joretsu to the military’s “seniority first”
- Corporate side. The long-standing bundle of lifetime employment + nenkō-joretsu (seniority-based pay/promotion) ties compensation and advancement to years-in-post, reducing mobility and slowing role refresh (noted across multiple OECD assessments).
- Institutionalized seniority ordering. In the prewar IJN, the colloquial “Hammock number” (ハンモックナンバー) denoted seniority within a cohort and affected etiquette and command precedence. [1]
- Pearl Harbor command choice and seniority logic. In April 1941, Nagumo Chūichi was appointed commander of the First Air Fleet—English-language scholarship and encyclopedic sources frequently note the choice was primarily based on seniority rather than carrier expertise. [2][3] Here we treat “seniority deciding key posts” as a systemic tendency, not a single-cause determinant.
B. South Korea: Steep seniority wages, mandatory retirement, and “peak wage”
- Pay structure. OECD comparisons show one of the steepest seniority–pay curves in the OECD; the peak-wage system trades continued employment near retirement for step-down pay cuts. [4][5][6]
- Outcome indicators. Elderly relative poverty has long ranked among the highest in the OECD (PAG and targeted evaluations). [4][7]
- Rights & media debate. A 2025 HRW report and multiple outlets flag age discrimination and side effects of peak-wage, prompting renewed debate on retirement age and wage design. [8]
C. China: Coupling of age norms and seniority ladders
- Age–promotion rules. Scholarship documents age ceilings/steps; for provincial–ministerial ranks, norms such as “step off at 65” operate as institutionalized (though partly unwritten) thresholds. [9][10][11]
- Organizational behavior. Age norms + relationship networks co-determine promotion and placement, amplifying first-come-first-served path dependence. [11][15]
- Structural result. When technology and task structures turn over quickly, younger cohorts are fixed in compatibility-patch roles—without version control.
D. Transition to Europe/US: Looser forms, but ports still “stuck” to old versions
- Senate seniority tradition. Official materials and scholarship confirm that seniority still shapes committee seats and chairmanships (even after party time-limit reforms, etc.). [12][5][16][17]
- Age structure. Pew and CRS (2025) report median age ~64–65 in the Senate and ~57–58 in the House for the 119th Congress. [13][14]
- Organizational takeaway. In fast-iterating domains (AI, cybersecurity), if interface designers are generationally misaligned with interface users for long stretches, version switching slows systemically.
Judgment & Strategy
- Common pattern. Systems hard-code seniority = order = risk control into their core, buying stability—but freezing the version.
- Cost. When tasks demand rapid iteration and cross-disciplinary collaboration, seniority-first delays interface upgrades, keeping younger cohorts stuck in “patch roles.”
- Strategy.
- Convert seniority from an exclusive gate to a transferable credit (mentorship rights, review authority, risk-control sign-off).
- Build dual tracks—expert and managerial—so advancement doesn’t require people to abandon technical depth.
- Create intergenerational co-review for interfaces and budget approvals, ensuring version changes are vetted by both incumbents and next-gen users.
References (clickable, copy-paste ready)
[1] ハンモックナンバー(日本語) — https://ja.wikipedia.org/wiki/%E3%83%8F%E3%83%B3%E3%83%A2%E3%83%83%E3%82%AF%E3%83%8A%E3%83%B3%E3%83%90%E3%83%BC
[2] Chūichi Nagumo — Wikipedia — https://en.wikipedia.org/wiki/Ch%C5%ABichi_Nagumo
[3] WW2DB|Chuichi Nagumo 时间线 — https://ww2db.com/person_bio.php?person_id=11
[4] OECD Reviews of Pension Systems: Korea (2022) (PDF) — https://www.oecd.org/content/dam/oecd/en/publications/reports/2022/09/oecd-reviews-of-pension-systems-korea_057d3b66/2f1643f9-en.pdf
[5] OECD Working Better with Age: Korea (2018) (PDF) — https://www.oecd.org/content/dam/oecd/en/publications/reports/2018/10/working-better-with-age-korea_g1g96de2/9789264208261-en.pdf
[6] OECD Inclusive Growth Review of Korea (2021) (PDF) — https://www.oecd.org/content/dam/oecd/en/publications/reports/2021/02/inclusive-growth-review-of-korea_632789cf/4f713390-en.pdf
[7] The Korea Times|Korea suffers OECD’s highest old-age poverty rate (2023) — https://www.koreatimes.co.kr/business/banking-finance/20231219/korea-suffers-oecds-highest-old-age-poverty-rate
[8] Human Rights Watch (2025)|Punished For Getting Older — https://www.hrw.org/report/2025/07/08/punished-for-getting-older/south-koreas-age-based-policies-and-older-workers
[9] FERDI|Mandatory Retirement Age at Provincial Level (China) — https://ferdi.fr/dl/df-h6H73d7XH2oKLhZHUoLXPFvo/document-the-effect-of-political-institutions-in-china-liu-d-t.pdf
[10] Asia-Pacific Journal: Japan Focus (2022)|Age-limit norm — https://apjjf.org/2022/19/li
[11] Shih, Adolph & Liu (2012), APSR|Getting Ahead in the CCP — https://faculty.washington.edu/cadolph/articles/ChinaRank.pdf
[12] U.S. Senate|Seniority(官方) — https://www.senate.gov/about/traditions-symbols/seniority.htm
[13] Pew Research (2025-03-03)|The changing face of Congress — https://www.pewresearch.org/short-reads/2025/03/03/the-changing-face-of-congress-in-7-charts/
[14] CRS (2025-05-21)|Membership of the 119th Congress: A Profile (PDF) — https://www.congress.gov/crs_external_products/R/PDF/R48535/R48535.2.pdf
[15] Wikipedia|Seniority in the United States Senate — https://en.wikipedia.org/wiki/Seniority_in_the_United_States_Senate
[16] U.S. Senate|About the Committee System: Committee Assignments — https://www.senate.gov/about/origins-foundations/committee-system/committee-assignments.htm
[17] CRS (2025-08-14)|Rules Governing Senate Committee and Subcommittee Leadership (R46806) — https://www.congress.gov/crs-product/R46806
X. Risks & Consequences: Sinking, Not Collapse
Verdict. What’s ahead is not an explosive collapse, but a slow sinking. Headline data look steady while structure erodes from below—an almost silent delayed death sentence. Below, “cold variables” trace the pathway and close the loop with Sections I–IX.
1) Invisible evaporation of labor: ledgers hold, vitality falls
Pattern. Aggregate employment/output can be maintained, yet the meaning density of work and the threshold for upward moves decline. For individuals, time is sliced into billable shards; the window for skill sedimentation and career leaps narrows.
- (↔ Sec. I) Hardware surplus × software lag: devices and platforms ensure “work exists,” but the upgrade script is missing.
- (↔ Sec. II) Task atomization, scoring, and penalties convert labor into statistical survival, not an accumulable career.
- (↔ Sec. IX) Version lock-in monopolizes interfaces; the new stack doesn’t get deployed.
- (Measurement effect) “Flexible work / self-employment” counts as employment in stats, averaging away the loss of vitality.
2) Retreat of intimacy & births: household capital frays, social reproduction weakens
Pattern. Marriage and childbirth are deferred, intimacy-freeze rates rise, TFR falls; the middle class trades today’s steady state for tomorrow’s blank space.
- (↔ Sec. III) Long-run uncertainty + high costs (housing/education/eldercare spillovers) push the expected return on intimacy & births below zero.
- (↔ Secs. II & VII) Platform time-slicing and weaker pension replacement expectations crowd out month-sized time blocks, shrinking the window for household investment.
- (Intergenerational effect) As the care/education chain weakens, public and human-capital formation slows—further lowering growth potential.
3) Erosion of public trust: state–platform–individual devolves into a low-trust game
Pattern. More micro-tuning of rules, metric engineering, and discounted policy promises → declining compliance and civic participation.
- (↔ Sec. VII) “No bankruptcy, proportional payout” and later-retirement/pooling stabilize the books, but felt replacement rates fall—trust collapses first.
- (↔ Sec. VIII) The makeshift system optimizes for least pain now, buying short-run calm while forwarding the bill.
- (↔ Sec. II) Platforms offload risk onto household balance sheets; individuals downgrade expectations of the system’s ability to catch them.
4) Civilizational Mode: A lukewarm disappearance, not a dramatic reboot
Pattern. There is no grand rupture—only long friction in culture and institutions. The show goes on, the lights dim, exits come earlier.
- (↔ Sec. IV) With scarce narratives and stages, cultural workers migrate to enclaves and platforms; what remains is a conservative organizational core.
- (↔ Sec. VI) School still trains memorize → rank, while the front line needs build → verify → deploy—graduating cohorts are mass-mismatched.
- (↔ Sec. V) Across four countries, distinct paths converge on the same outcome: old software can’t drive new cohorts and new tasks.
5) Causal chain
Hardware surplus × software lag → Platform life-support (task atomization / scoring / rewards & penalties) → Middle-class freeze (risk assessment locks you in) → Education mismatch (“good at tests, bad at deployment”) → Seniority lock-in (interfaces occupied) → Makeshift stabilization (metrics / buffers / price shields) → Pension-trust erosion (parametric stability, felt decline) → Labor evaporation × intimacy retreat × trust erosion → Sinking.
6) Why sinking, not collapse
- Buffers remain: family mutual aid, shadow capacity, platform traffic, statistical smoothing, one-off funds.
- Risk is dispersed, not concentrated: each node survives in a barely-livable band, avoiding system-wide liquidation.
- Indicator armor: a dashboard centered on employment/GDP/prices is insensitive to “life rate / upgrade rate.”
7) Five cold indicators to monitor (early signals of sinking)
- Career-upgrade rate: share moving to a higher-skill stack within 3 years of entry (age- and industry-stratified).
- Length of continuous free time blocks: monthly median of >4-hour non-work segments (a proxy for build capacity).
- Household net cash flow (post “big three” costs): share of households persistently negative.
- Public participation / compliance willingness: turnout, volunteering, union/association participation, and their long-run trends.
- Institutional credibility proxies: frequency of parametric tweaks (pensions, taxes, education metrics) and the density of “oral policy” (non-codified guidance).
VIII) Conclusion — Swap life-support interfaces back for the permission to live
Sinking won’t bounce back on its own. Without rewriting the operating system, subsidies and statistical cosmetics only delay the verdict. Three keys to turn life-support into life:
- Return the right to upgrade. Shift from a patch culture to an upgrade culture: free up interfaces and term limits, and allow planned break-compatibility windows.
- Reclaim time blocks. Curb task atomization’s erosion of life and give month-sized time back to families and learning.
- Recode assessment. Replace pretty, purely quantitative dashboards with upgrade rate, replacement rate, continuous free-time blocks, and public participation as headline metrics.
Epilogue — The enemy isn’t “out there.” It’s in the operating system.
It isn’t a mob or a cartel; not one faction, and not one country. The real enemy is that the human operating system we’re running on is out of date.
We don’t lack hardware anymore: power grids, networks, logistics, AI, platforms, and schools can keep people alive quite reliably. We lack software: refreshed narratives, institutions, credentialing, and intergenerational order.
So we get: platforms as life-support, slicing work into billable fragments; the middle class as a stability buffer, trading tomorrow for today; assembly-line schooling, mistaking test-taking for life competence; pensions “stabilized” by parameter tweaks, treating trust like a renewable resource; a makeshift governance style that optimizes for least pain now, pushing long pain forward; and incumbents monopolizing the ports, keeping upgrade rights on the old version.
You’ve tried countless times, and it wasn’t “failure”—you were never designed to succeed. Macro data stay presentable while micro lives grayscale, frame by frame. This isn’t a collapse; it’s a sinking—a quiet, delayed verdict.
If we want to stop sinking, the answer isn’t to push life-support harder. It’s to rewrite the OS:
- Return interfaces to the public: open and regularly hand over data, budget, and approval ports.
- Convert seniority into transferable credit: shift from seat-holding to mentorship rights, review authority, and risk-control sign-offs.
- Give back time blocks to individuals: curb task atomization’s erosion of life; restore month- and week-scale discretionary time.
- Recode assessment: replace pretty, purely quantitative dashboards with upgrade rate, replacement rate, continuous free-time blocks, and public participation.
- Normalize exploration: budget for trial and error; set planned break-compatibility windows; use clear exit clocks and settlement rules.
Society is not a precision lathe; it’s a system that needs regular reboots. Rebooting isn’t smashing the machine—it’s loading new versions, making failure non-fatal, and letting the next generation actually inherit maintenance rights.
If one judgment must be remembered, let it be this:
Stop mistaking life-support for life. Stop letting old versions hog the ports.