ProbabilityEnjoyer
Bio
I'm working on:
- Carlo: uncertainty analysis in Google Sheets
- Probly: a Python-like language for probabilistic estimation
- MakeDistribution: a web interface and API for creating probability distributions from human judgement
Posts 3
Comments3
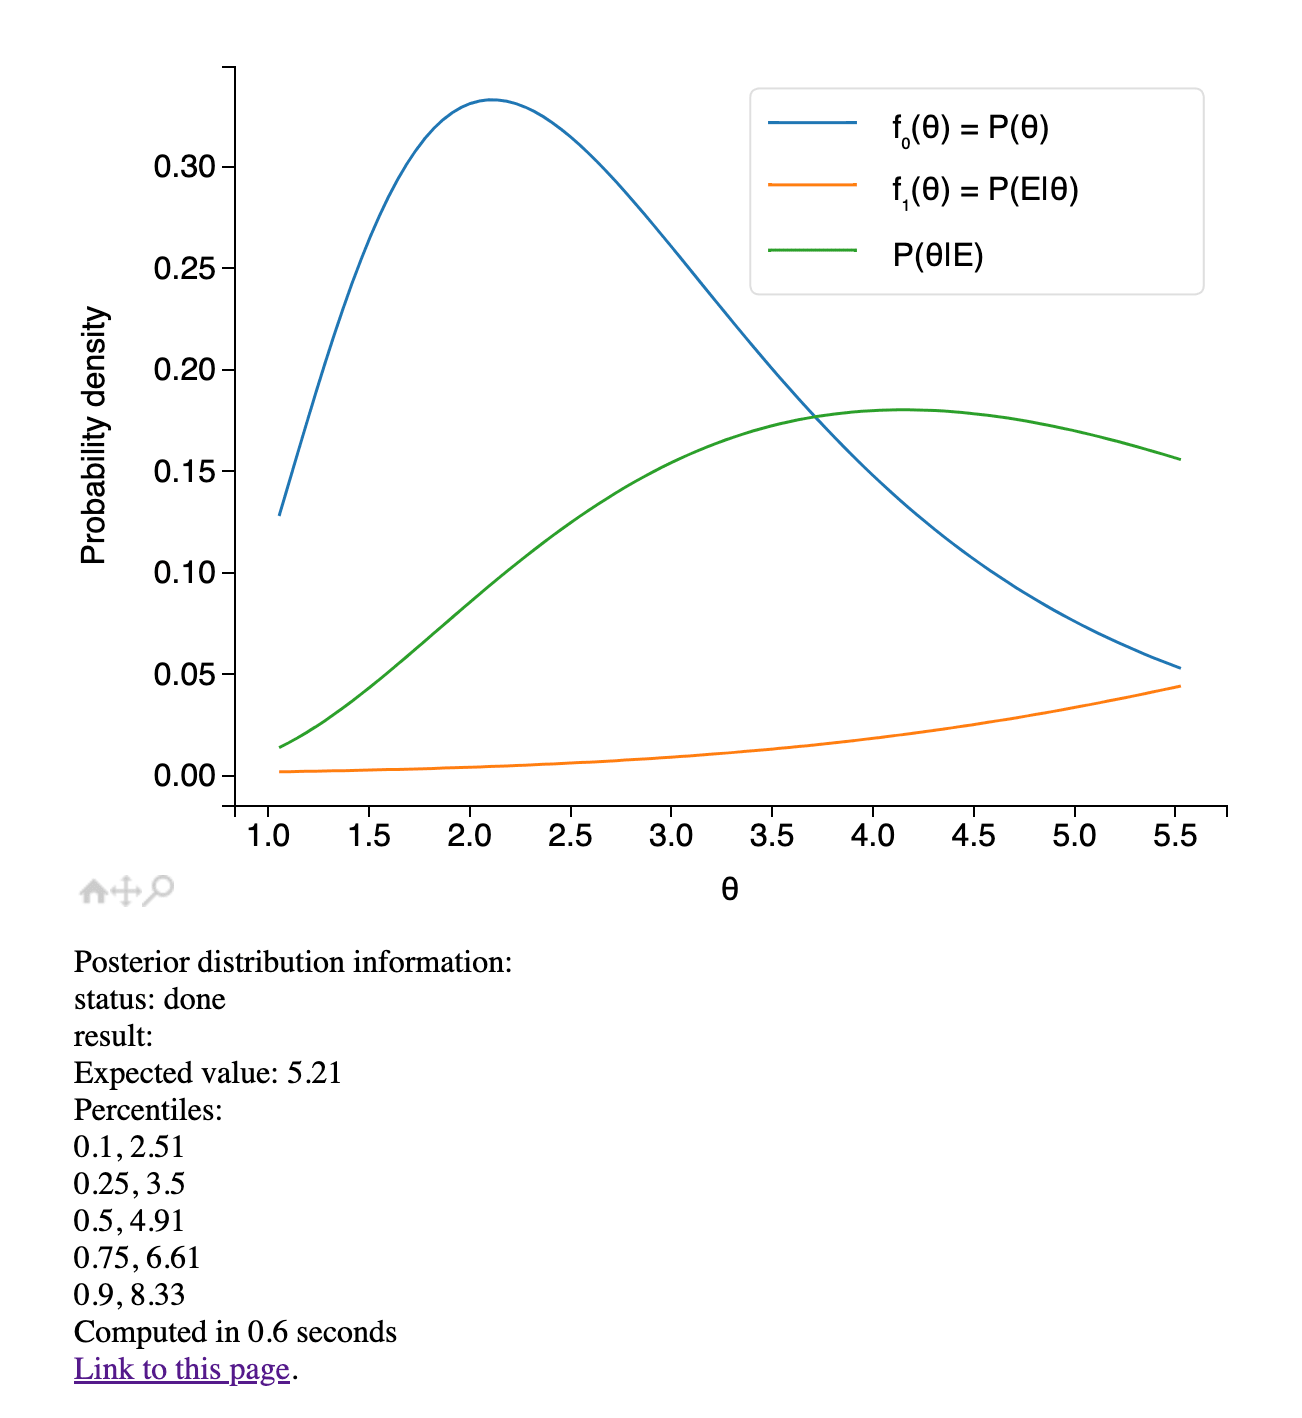
A lognormal prior (and a normal likelihood function) might be a good starting point when adjusting for the statistical uncertainty in an effect size estimate. The resulting posterior cannot be calculated in closed form, but I have a simple website that calculates it using numerical methods. Here's an example.
Worth noting that adjusting for the statistical uncertainty in an effect size estimate is quite different from adjusting for the totality of our uncertainty in a cost-effectiveness estimate. For doing the latter, it's unclear to me what likelihood function would be appropriate. I'd love to know if there are practical methods for choosing the likelihood function in these cases.
GiveWell does seem to be using mostly normal priors in the document you linked. I don't have time to read the whole document and think carefully about what prior would be most appropriate. For its length (3,600 words including footnotes) the document doesn't appear to give much reasoning for the choices of distribution families.
I've fully rewritten the spreadsheet tool, available at carlo.app:
The major improvements are:
- More flexible input format
- Interactive — histograms update as you edit the spreadsheet (this also means you can collaborate in real time)
- Overhauled UI with dozens of new features
Other improvements include:
- Simulations run many times faster — this is especially noticeable for the sensitivity analysis
- You no longer need to manually type in the result cell coordinate
- Multiple output variables are now supported
Do you just mean that the change in the posterior expectation is in the correct direction? In that case, we know the answer from theory: yes, for any prior and a wide range of likelihood functions.
Andrews et al. 1972 (Lemma 1) shows that when the signal
Bis normally distributed, with meanT, then, for any prior distribution overT,E[T|B=b]is increasing inb.This was generalised by Ma 1999 (Corollary 1.3) to any likelihood function arising from a
Bthat (i) hasTas a location parameter, and (ii) is strongly unimodally distributed.