Comments
18 March 2024: I've decided to split the two input formats after all, so Dagger has been replaced by Carlo (spreadsheet) and Probly (programming language). Old URLs redirect to the appropriate place.
Dagger (usedagger.com) is a new tool for calculations with uncertainty. It uses Monte Carlo simulation.
There are two ways to specify your simulation model:
- Import an existing spreadsheet
- use Probly, a Python dialect designed for probabilistic simulation
ℹ️ Each of the two links above has 4 interactive examples. You might want to start there.
Spreadsheet
Example
In this 15-second video, we take a complex existing spreadsheet (100+ rows) from GiveWell and turn it into a Monte Carlo simulation
The sheet already gives us "optimistic/pessimistic" values, so it's as simple as adding one column to specify the distribution as (e.g.) uniform
(Longer version of this video)
Features
Dependency graph
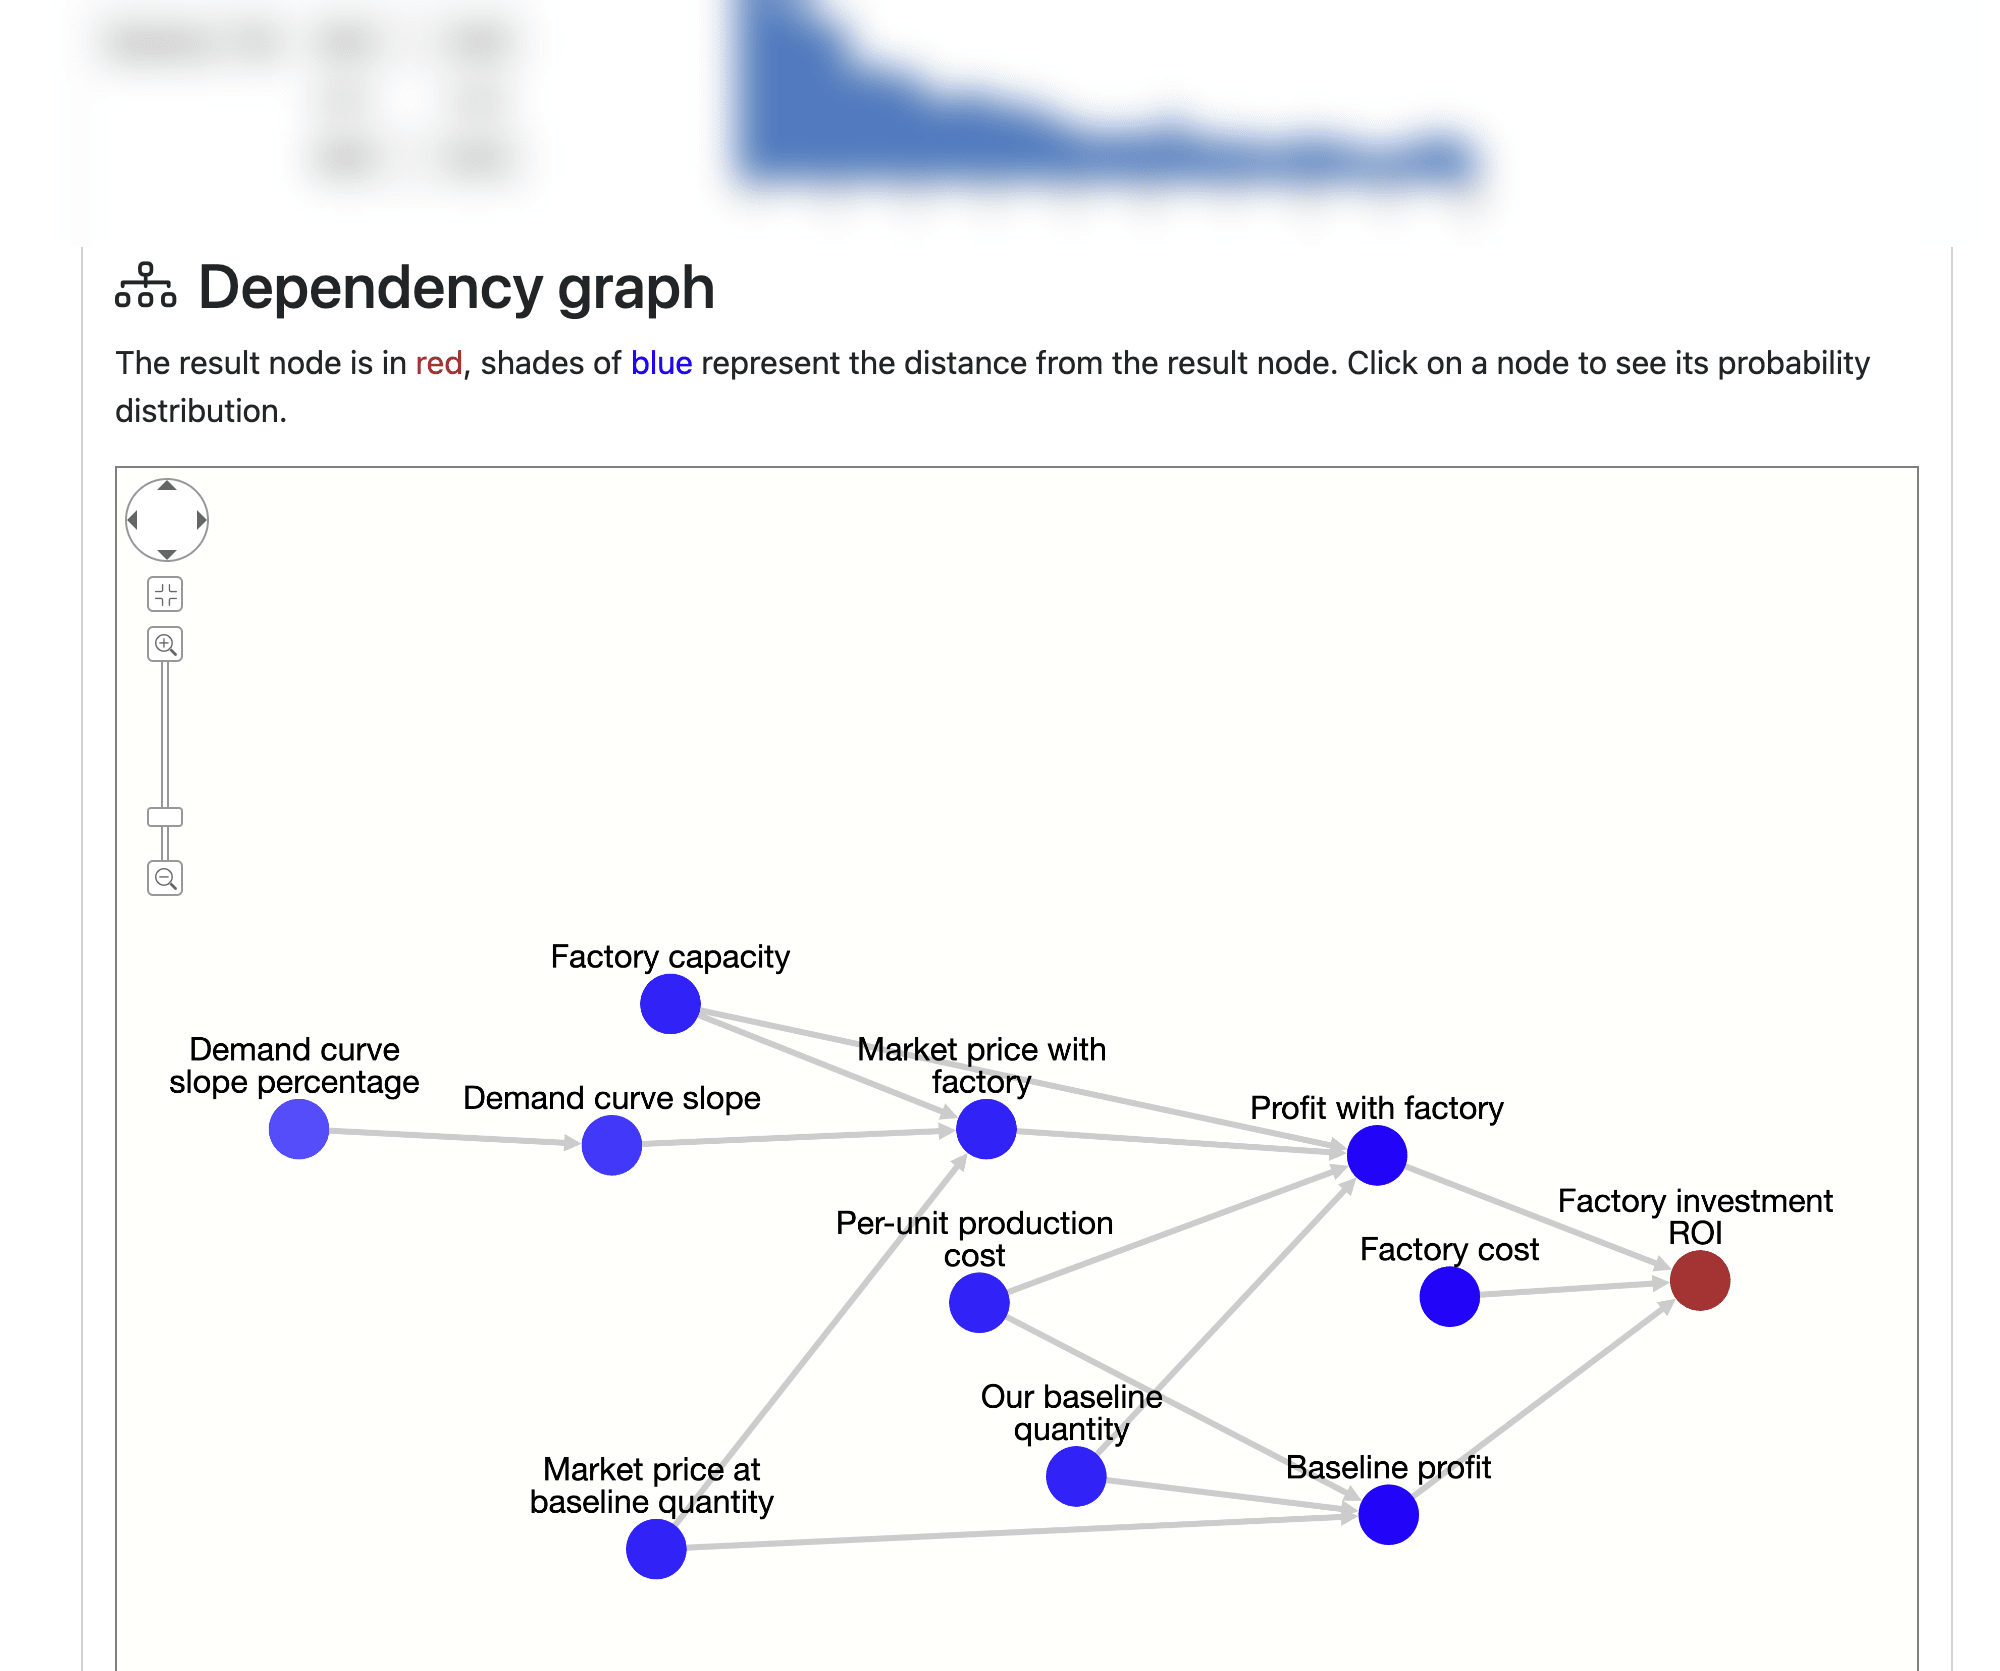
Intuitive and mathematically rigorous sensitivity analysis
Our sensitivity analysis uses Sobol’ global sensitivity indices. The approach and the intuition behind it are explained in more detail here.
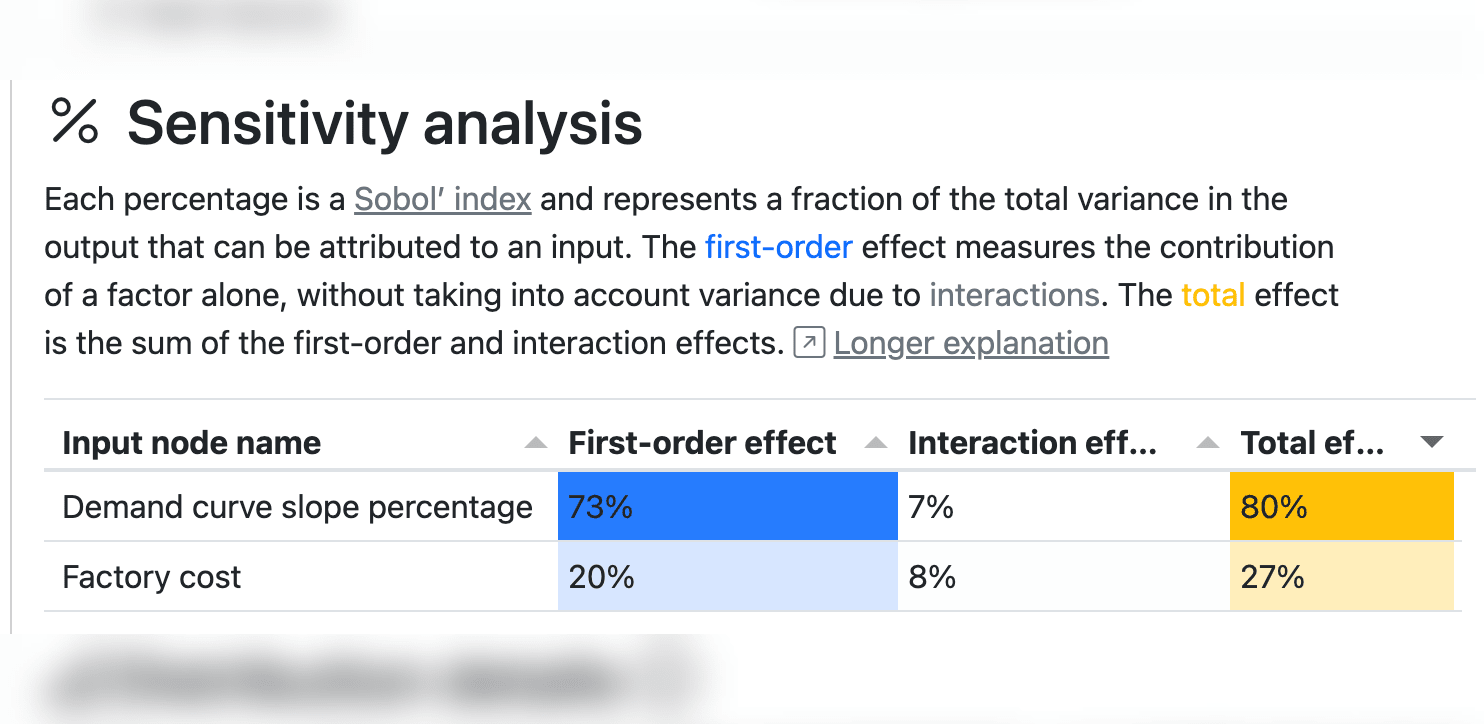
ℹ️ You need to enable the sensitivity analysis under "Advanced options"
Summary table
This table exposes the structure of your model by showing the dependency graph as a tree. Similar to Workflowy, you can zoom to any variable, or expand/collapse.
Probly
Probly feels very like Python, except that any number can also be a probability distribution:

Example
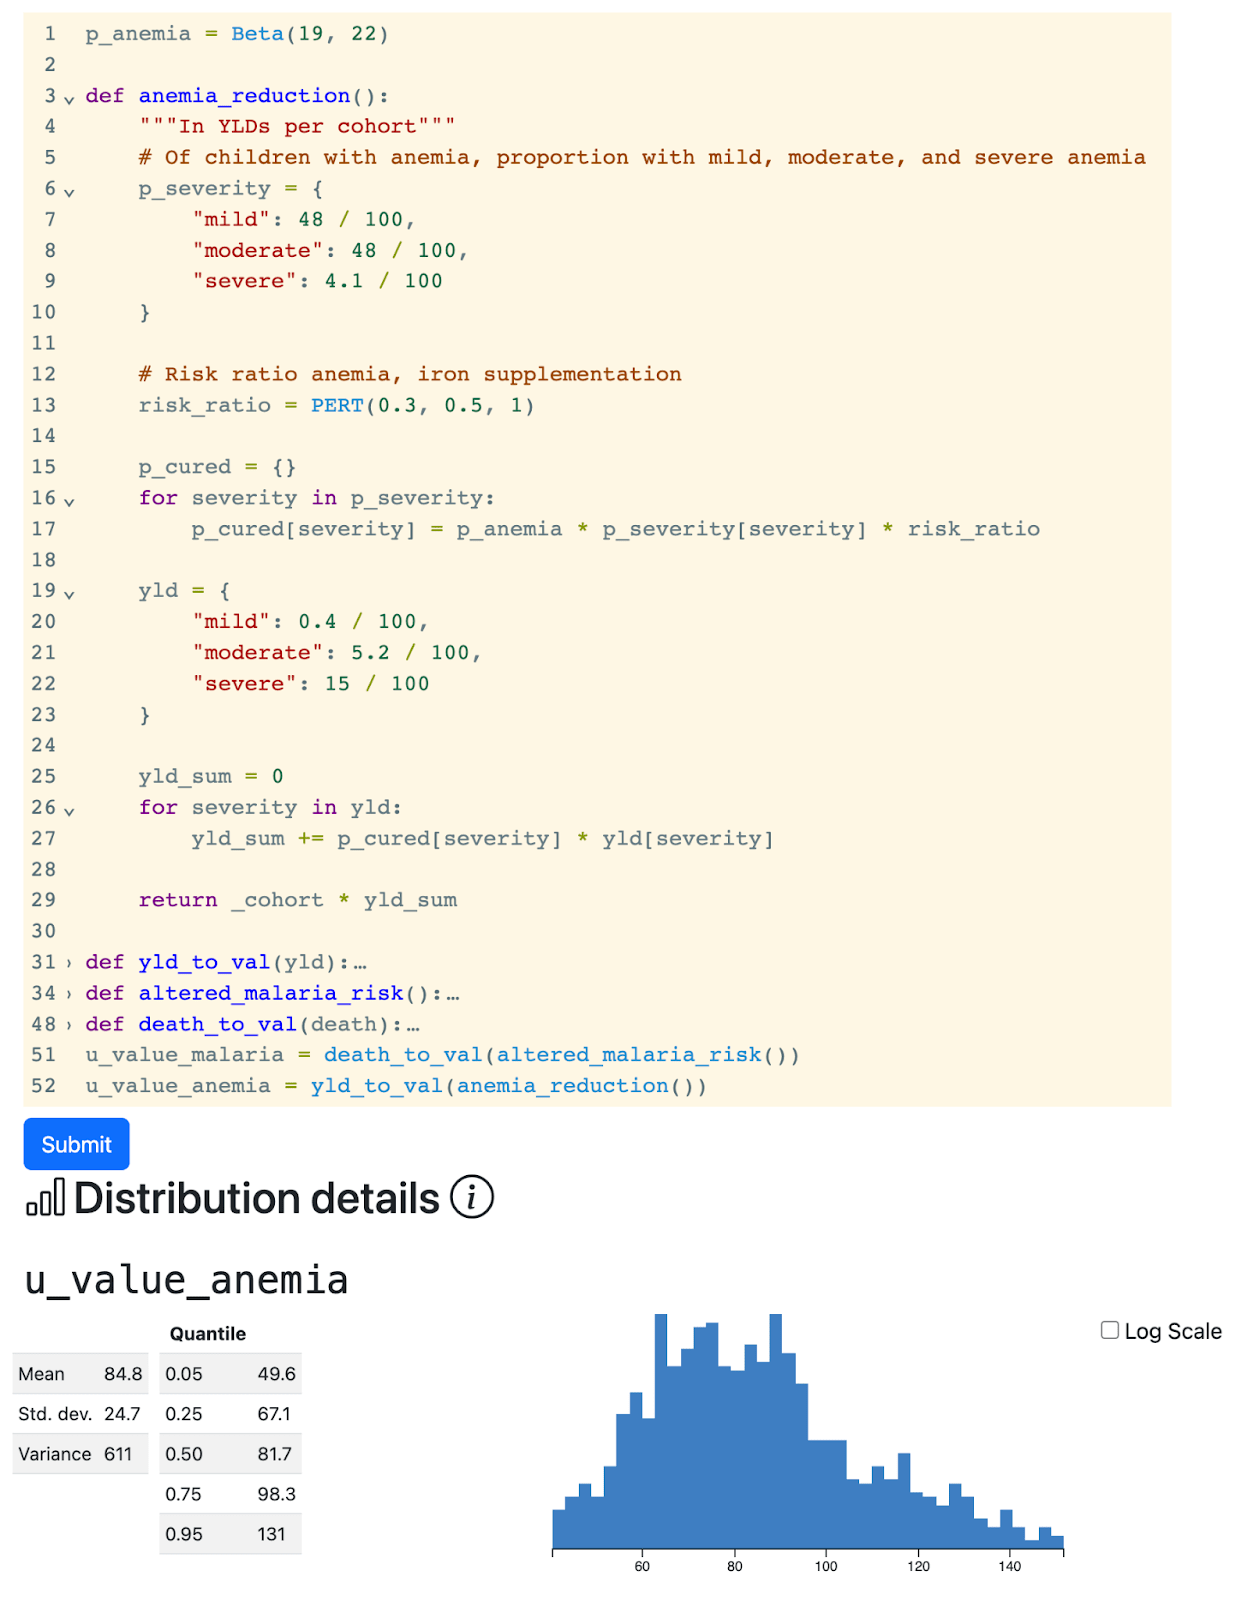
Here's a fuller example of the syntax and resulting output. It's part of a GiveWell CEA of iron and folic acid supplementation.
Distribution support
Probly supports 9 probability distributions. Each can be constructed in multiple ways.
For example, you can construct a normal distribution in 5 ways:
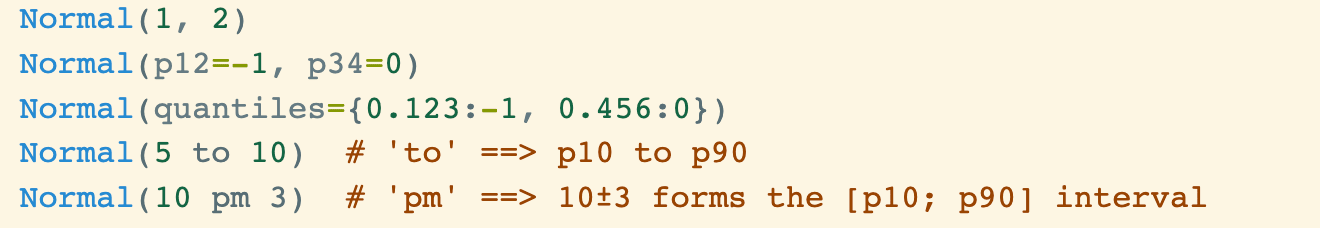
This clickable table shows you everything that's supported, and includes example code:
ℹ️ Shortcut:
probly.devredirects tousedagger.com/probly
Limitations
There are at the moment numerous limitations. A small selection of them:
- Probly:
- Doesn’t support the Sobol' sensitivity analysis
- Doesn't show the dependency graph
- Spreadsheet
- There is no UI in Dagger to edit the model. All changes must go via the spreadsheet.
- The spreadsheet must specify probability distributions in a specific format.
- All models are public


I've fully rewritten the spreadsheet tool, available at carlo.app:
The major improvements are:
Other improvements include: