Comments
53

By: Miguel A. Peñaloza
This project was carried out as part of the “Carreras con Impacto” program during the 14-week mentorship phase. You can find more information about the program in this entry.
This paper focuses on the collection and modeling from scaling laws of a dataset oriented to speech recognition models, with the aim of estimating trends in their capabilities. The dataset was created by reviewing 172 studies related to speech recognition, collecting variables such as the number of model parameters, floating-point operations (FLOP), and word error rates (WER). The main challenges in developing this research include difficulties encountered when the number of FLOP is not reported in the reviewed studies. It was found that the architectures with the lowest error rates (WER) are Transformer (2.6% WER) and E-Branchformer (1.81% WER). Change rates in trends for different benchmarks were estimated (Common Voice Spanish 5 months, LibrarySpeech Test Clean 7 months, LibrarySpeech Test Other 10 months). Finally, the high uncertainty of the estimates was noted due to the small sample size, and potential future research directions were suggested.
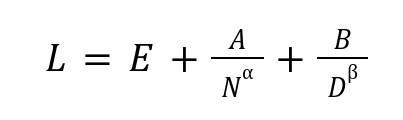
Since the emergence of Chinchilla’s Scaling Law in language models, a fundamental question has arisen regarding the optimal resources required to train various artificial intelligence models. Hoffman et al. (2022), in their study on the training of the Chinchilla model, examined the optimal model size and the number of tokens required under a defined computing budget. The authors concluded that for optimal training, both the model size and the number of tokens must scale proportionally (Equation 1).
Such relationships, consistent with scaling laws, have been observed in various areas of artificial intelligence, such as computer vision (Erdil & Besiroglu, 2023), language models (Ho et al., 2024), and speech recognition (Droppo & Elibol, 2021; Gu et al., 2023). However, scaling laws have shown several limitations, as some authors have pointed out the lack of fit or generality in modeling relationships between different variables during AI model training (Sorscher et al., 2022; Tay et al., 2022; Besiroglu et al., 2022), and Chinchilla's scaling law has a poor fit as well as very tight confidence intervals (Besiroglu et al., 2024).
Based on the above, the research question that motivated the development of this project is: What is the rate of advancement in the capabilities of speech recognition models?
Data was collected through the review of 171 research articles related to the field of speech recognition, covering the period from 2016 to 2023. Initially, 17 models from the "notable models" dataset of Epoch AI were considered, using their inclusion criteria. However, these criteria proved too strict, complicating the estimation of variables such as training cost. Subsequently, 154 additional models were selected based on the evaluation of benchmarks such as LibriSpeech Test Clean (33%), LibriSpeech Test Other (28%), AISHELL 1 (8%), Common Voice Spanish (4%), WSJ Eval 92 (8%), Common Voice German (8%), and LRS2 (4%), reported in the Browse State of The Art repository collaborative environment with its core team at Meta AI Research.
The selected benchmarks consist of datasets useful for evaluating the performance of models in natural language processing (NLP) and automatic speech recognition (ASR). The Libri Speech Benchmark is based on audiobook recordings from the "LibriVox" project and is divided into two parts: test-clean and test-other. WSJ Eval 92 is a subset of the Wall Street Journal corpus, which includes recordings of speakers reading newspaper articles. The AISHELL-1 benchmark is a dataset designed for Mandarin voice recognition. The Common Voice benchmark is a Mozilla project consisting of voice recordings in various languages such as German, French, and Spanish. Finally, the LRS2 (Lip Reading Sentences) benchmark focuses on lip-reading research and contains videos of people speaking.
Following the literature review, various relevant variables were organized for estimating trends in speech recognition models, based on the methodology proposed by Droppo & Elibol (2021). These variables include word error rate (WER), floating-point operations (FLOP), and model parameters.
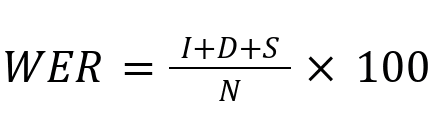
The WER (Word Error Rate) metric is the standard used to evaluate the performance of large-vocabulary continuous speech recognition systems. The number of errors is calculated as the sum of substitutions (S), insertions (I), and deletions (D), divided by the total number of words (N) and multiplied by 100:
The number of floating-point operations (FLOP) was estimated using methodology number two reported by Sevilla et al. (2022), which involves considering the reported training time, GPU model performance, and training computation estimation, resulting in:
(training time) X (# of cores) X (# peak FLOP) X (utilization rate)
Finally, the number of model parameters, which refers to the total adjustable values the model uses for inference, was considered. These are reported in the studies reviewed.
Due to challenges in constructing the dataset, such as most of the studies not reporting the computation used (FLOP) or parameters for estimation, the analysis continued using only the WER metric. The complete dataset can be consulted here.
The method used to evaluate trends in speech recognition models was through fitting linear regression models by least squares, aiming to represent the relationship between two variables by fitting a linear equation to the observed data. A linear regression model is an equation of the form:
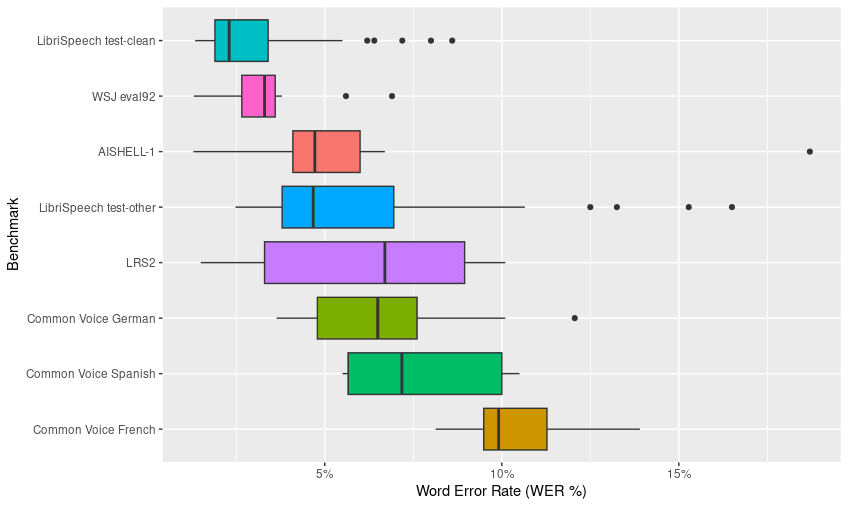
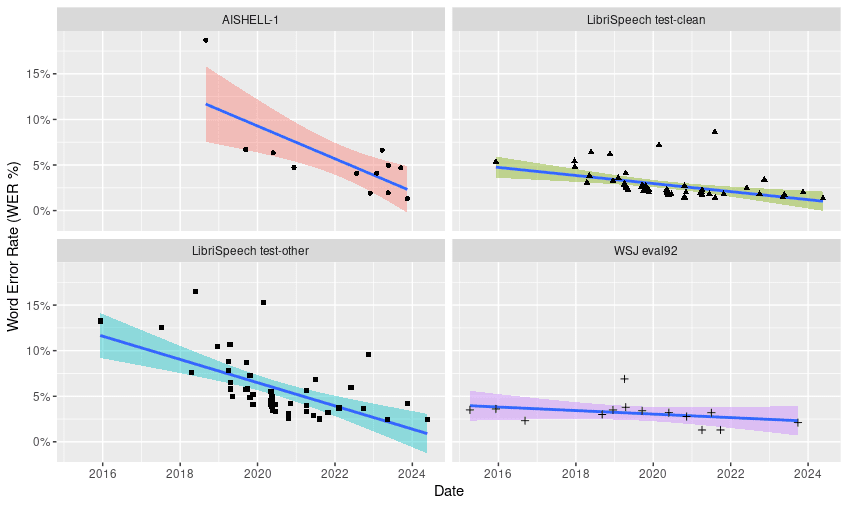
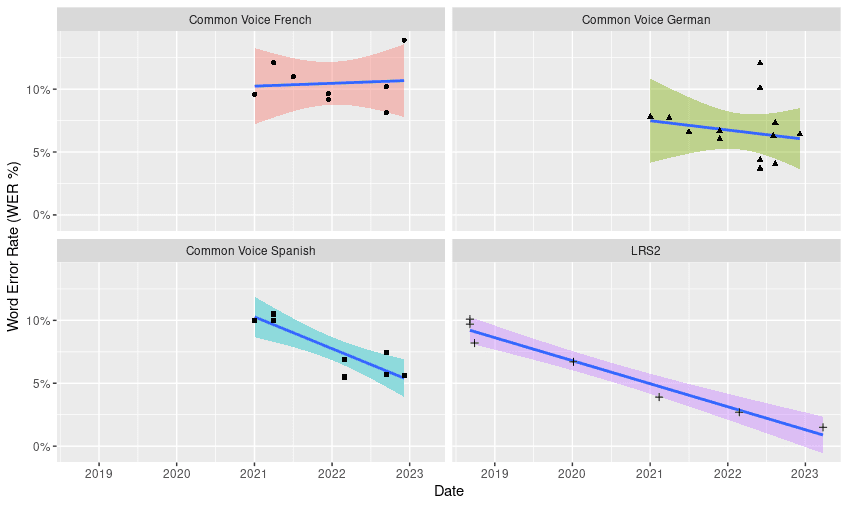
According to the exploratory analysis of the constructed dataset, it was found that the Common Voice French benchmark (WER 10.5%) and Common Voice Spanish benchmark (WER 7.5%) show the highest word error rates. In contrast, the benchmarks with the lowest error rates were LibriSpeech Test Clean (WER 3%) and Wall Street Journal (WSJ 92) (WER 3.3%) (Figure 1).
Finally, trend lines were fitted for the AISHELL-1, LibriSpeech Test Clean, LibriSpeech Test Other, and Wall Street Journal (WSJ Eval 92) benchmarks, analyzing the relationship between error rate (WER) and publication dates (Table 1). It is important to mention that the estimates shown in Table 1 have high uncertainty due to the small sample size. Additionally, the rate of change was not calculated for models with an adjusted R^2 lower than 0.2 due to the poor fit of the model to the data.
Table 1. Trend adjustments for different speech recognition benchmarks. The sample sizes, summary of the adjusted models, determination coefficient, and rate of change in months are shown (which is the value that the variable x has to take for there to be a decrease of one unit in y e.g. Common Voice Spanish y = 24.28- 0.2(5) = 23.28). Normality and variance homogeneity tests can be consulted in the supplementary material.
| Benchmark | Sample Size | Adjusted Model (WER) | R^2 | Exchange rate |
| Common Voice Spanish | 8 | y=24.28-0.2(x) | 0.78 | 5 months |
| LRS2 | 7 | y=15.29-0.15(x) | 0.74 | 7 months |
| AISHELL-1 | 14 | y=17.76-0.15(x) | 0.52 | 7 months |
| LibriSpeech test-other | 48 | y=12.5-0.10(x) | 0.35 | 10 months |
| LibriSpeech test-clean | 57 | y=17.76-0.15(x) | 0.2 | 7 months |
| WSJ eval 92 | 15 | y=3.96-0.01(x) | 0.11 | - |
| Common Voice German | 14 | y=11.79-0.06(x) | 0.03 | - |
| Common Voice French | 8 | y=9.46-0.01(x) | 0.02 | - |
According to the trend adjustment analysis, the Common Voice Spanish benchmark showed the fastest rate of change (5 months), followed equally by AISHELL-1, LibriSpeech Test Clean, and LRS2 (7 months). In contrast, the LibriSpeech Test Other (10 months) benchmark showed the slowest rate of change. Finally, we avoided reporting the rate of change for the WSJ eval 92, Common Voice German and French benchmarks due to the poor fit of the R^2 < 0.2 model. (Figure 3).
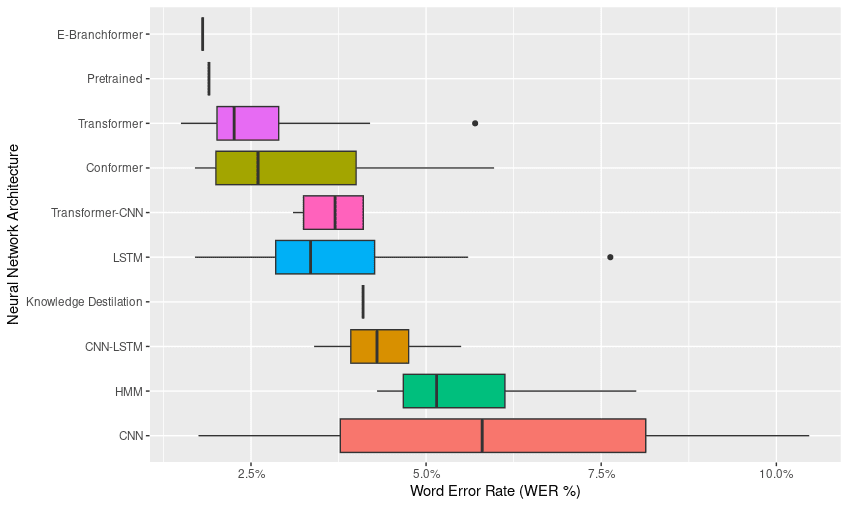
Based on the collected dataset, it was identified that the architectures with the lowest error rates are Transformer and Conformer. Additionally, the models evaluated on the Libri Speech Test Clean benchmark presented the lowest word error rate (WER).
On the other hand, it was observed that few speech recognition models are trained in languages other than English, leading to higher error rates and adding uncertainty regarding trends in the progress of these models, as well as in optimal training in terms of the number of parameters and sample size. There were 14 models for German, 8 models for Spanish, and 8 models for French. The fastest rate of change in terms of WER reduction over time was found in Common Voice Spanish (5 months), while the slowest rate of change was observed in Libri Speech Test Other (10 months).
Unfortunately, there is high uncertainty in estimating trends for speech recognition models. It is important to note that the trend adjustments for the analyzed benchmarks yielded R^2 values lower than 0.78, indicating an insufficient fit of the models to the data. Additionally, the small sample size limits the ability to generalize the results and inaccurately reflects the real behavior of trends in speech recognition models.
It was not possible to apply scaling laws to the speech recognition models due to difficulties in collecting and constructing the dataset. These challenges are not new, as authors like Sevilla et al. (2023) have reported similar issues, including a lack of information about computing time or, in some cases, a lack of details about the hardware used and the training time for the models.
The main difficulties encountered during the project were related to the collection and construction of the dataset, resulting in a small sample size and a poor fit of the trends in speech recognition models. Consequently, the results obtained are not easily generalizable, and the coefficient estimates for the adjusted trend models show high uncertainty. Additionally, there is a possibility that biases are being introduced, distorting the true behavior of current speech recognition models.
In future work, it is suggested to increase the sample size and include the variable of the number of training hours for the models. Additionally, it is recommended to explore the adjustment of potential regression models as a more suitable alternative to scaling laws for both speech recognition models and language and computer vision models.
Regarding the research methodology, it was observed that following the inclusion criteria for notable models from Epoch AI is a highly rigorous process. Therefore, if this methodology is to be used, it is essential to allow sufficient time for continuous literature screening.
Lastly, the "Browse State of The Art" repository is a good starting point for building datasets in areas related to artificial intelligence and the sciences in general.
Having a model that optimally fits offers numerous benefits, including faster advancements in model capabilities, efficient use of computational resources, and ultimately, efficient use of material resources. Furthermore, having a model that adequately represents trends in the growth of artificial intelligence capabilities is essential for effective governance and the mitigation of potential future risks.
Developing this project was a challenging and enriching experience, where I applied my research, writing, critical thinking, and modeling skills. This experience allowed me to understand the importance of reporting computational usage in research projects, while also improving my skills in planning and executing research projects, as well as setting clear and achievable objectives.
Additionally, I learned that automatic scientific literature search engines, like Research Rabbit, often face difficulties in selecting quality and accessible bibliography for consultation.
Finally, the development of this project and my participation in the "Carreras con Impacto" program have provided me with valuable tools to increase my chances of success in the scientific field and to realign my professional goals towards greater global impact.
Droppo, J., & Elibol, O. (2021). Scaling laws for acoustic models. arXiv preprint arXiv:2106.09488.
Erdil, E., & Besiroglu, T. (2022). Algorithmic progress in computer vision. arXiv preprint arXiv:2212.05153.
Gu, Y., Shivakumar, P. G., Kolehmainen, J., Gandhe, A., Rastrow, A., & Bulyko, I. (2023). Scaling laws for discriminative speech recognition rescoring models. arXiv preprint arXiv:2306.15815.
Ho, A., Besiroglu, T., Erdil, E., Owen, D., Rahman, R., Guo, Z. C., ... & Sevilla, J. (2024). Algorithmic progress in language models. arXiv preprint arXiv:2403.05812.
Hoffmann, Jordan, et al. Training Compute-Optimal Large Language Models. arXiv, 29 Mar. 2022. arXiv.org, https://doi.org/10.48550/arXiv.2203.15556.
Jaime Sevilla et al. (2022), "Estimating Training Compute of Deep Learning Models". Published online at epochai.org. Retrieved from: 'https://epochai.org/blog/estimating-training-compute' [online resource]
Jaime Sevilla, Anson Ho, and Tamay Besiroglu. ‘Please Report Your Compute’. Commun. ACM 66, no. 5 (May 2023): 30–32. https://doi.org/10.1145/3563035.
Sorscher, Ben, et al. Beyond Neural Scaling Laws: Beating Power Law Scaling via Data Pruning. arXiv, 15 Nov. 2022. arXiv.org, https://doi.org/10.48550/arXiv.2206.14486.
Tay, Yi, Mostafa Dehghani, et al. Scaling Laws vs Model Architectures: How Does Inductive Bias Influence Scaling? arXiv, 21 July 2022. arXiv.org, https://doi.org/10.48550/arXiv.2207.10551.
Su, X., Yan, X., & Tsai, C. L. (2012). Linear regression. Wiley Interdisciplinary Reviews: Computational Statistics, 4(3), 275-294.
Tamay Besiroglu, Ege Erdil, Matthew Barnett, and Josh You. ‘Chinchilla Scaling: A replication attempt’. ArXiv [cs.AI], 2024. arXiv. https://arxiv.org/abs/2404.10102.
Supplementary Material
Code
The code generated during the analysis can be accessed in this GitHub repository.
Charts and Tables
Table 2. Descriptive statistics regarding the Word Error Rate (WER%) by type of benchmark. The total number (n), minimum (min), maximum (max), mean, and standard deviation (sd) of the WER metric for different speech recognition model benchmarks are shown.
| Word Error Rate (WER %) por Benchmark | |||||
| Benchmark | n | min | max | mean | sd |
| LibriSpeech test-clean | 57 | 1.3 | 8.6 | 3.0 | 1.7 |
| LibriSpeech test-other | 48 | 2.5 | 16.5 | 5.9 | 3.3 |
| WSJ eval92 | 15 | 1.3 | 6.9 | 3.3 | 1.5 |
| AISHELL-1 | 14 | 1.3 | 18.7 | 5.4 | 4.2 |
| Common Voice German | 14 | 3.6 | 12.1 | 6.6 | 2.4 |
| Common Voice French | 8 | 8.1 | 13.9 | 10.5 | 1.8 |
| Common Voice Spanish | 8 | 5.5 | 10.5 | 7.7 | 2.2 |
| LRS2 | 7 | 1.5 | 10.1 | 6.1 | 3.4 |
Table 3. Descriptive statistics regarding the Word Error Rate (WER%) by type of neural network architecture. The total number (n), minimum (min), maximum (max), mean, and standard deviation (sd) of the WER metric for different neural network architectures in speech recognition models are shown.
| Word Error Rate (WER%) por Tipo de Arquitectura | |||||
| Arquitectura | n | min | max | mean | sd |
| Conformer | 1 | 2.6 | 2.6 | 2.6 | |
| E-Branchformer | 1 | 1.81 | 1.81 | 1.81 | |
| Knowledge Destilation | 1 | 4.1 | 4.1 | 4.1 | |
| Pretrained | 1 | 1.9 | 1.9 | 1.9 | |
| Transformer | 1 | 4.2 | 4.2 | 4.2 | |
| CNN | 3 | 1.75 | 10.47 | 6.007 | 4.364 |
| CNN-LSTM | 4 | 3.4 | 5.5 | 4.375 | 0.877 |
| HMM | 4 | 4.3 | 8 | 5.65 | 1.642 |
| Transformer-CNN | 4 | 3.1 | 4.11 | 3.652 | 0.529 |
| LSTM | 8 | 1.7 | 7.63 | 3.842 | 1.919 |
| Conformer | 12 | 1.7 | 5.97 | 3.22 | 1.408 |
| Transformer | 14 | 1.5 | 5.7 | 2.571 | 1.12 |
Table 4. Regression model coefficients for the AISHELL speech recognition benchmark. The estimated coefficients, standard error (Std. Error), t-value, and associated probability values (Pr(>|t|)) are shown.
| AISHELL Benchmark | |
| Coefficients: | r^2 |
| Estimate Std. Error t value Pr(>|t|) | 0.52
|
| (Intercept) 17.76523 3.46717 5.124 0.000252 *** | |
| meses -0.15025 0.04104 -3.661 0.003257 ** | |
| LibriSpeech Test Clean | |
| Coefficients: | r^2 |
| Estimate Std. Error t value Pr(>|t|) | 0.20
|
| (Intercept) 17.76523 3.46717 5.124 0.000252 *** | |
| meses -0.15025 0.04104 -3.661 0.003257 ** | |
| LibriSpeech Test Other | |
| Coefficients: | |
| Estimate Std. Error t value Pr(>|t|) | r^2 |
| (Intercept) 12.50138 1.38047 9.056 8.65e-12 *** | 0.35
|
| meses -0.10656 0.02134 -4.994 8.98e-06 *** | |
| WSJ EVAL 92 | |
| Coefficients: | r^2 |
| Estimate Std. Error t value Pr(>|t|) | 0.11
|
| (Intercept) 3.96235 0.74929 5.288 0.000192 *** | |
| meses -0.01637 0.01306 -1.254 0.233874 | |
| Common Voice French | |
| Coefficients: |
|
| Estimate Std. Error t value Pr(>|t|) | |
| (Intercept) 9.46672 6.82656 1.387 0.215 | |
| meses 0.01242 0.08462 0.147 0.888 | |
| Common Voice German | |
| Coefficients: |
|
| Estimate Std. Error t value Pr(>|t|) | |
| (Intercept) 11.79894 8.08738 1.459 0.170 | |
| meses -0.06299 0.09813 -0.642 0.533 | |
| Common Voice Spanish | |
| Coefficients: | r^2 |
| Estimate Std. Error t value Pr(>|t|) | 0 .78
|
| (Intercept) 24.28987 3.59647 6.754 0.000514 *** | |
| meses -0.20634 0.04449 -4.638 0.003548 ** | |
| LRS2 | |
| Coefficients: | r^2 |
| Estimate Std. Error t value Pr(>|t|) | 0.74
|
| (Intercept) 15.29338 0.87166 17.55 1.1e-05 *** | |
| meses -0.15154 0.01362 -11.13 0.000102 *** | |

Great article!!