This is a crosspost from the new Animal Welfare Alignment Newsletter by Anima International. You can subscribe on Substack if you are interested in following these efforts. Audio reading also available on Substack.
The goals of this post are to:
1. Raise a question I see as crucially important to the goal of aligning AI to animal welfare...
Hello! I'm Justin Portela. I got hired by GWWC to make YouTube videos after AI in Context did such a kickass job.
My channel is using that same cinematic, high-production value beauty to talk about everything in the EA universe that isn't AI.
...
I used AI to fix transcription errors, rerrarange the ideas, and suggest tweaks to the title and some sentences.
Three of the most exciting projects to come out of EA in recent years are, in a vague sense, CEA spinouts:
* Kairos is directly a spinout of CEA and now handles most support for university AI safety groups. Basically everyone I've found who knows them is really excited about what they do
* NEST is an opinionated ideas-fi...
This project was conducted as part of the "Careers with Impact" program during the 14-week mentoring phase. You can find more information about the program in this post.
1. Contextualization of the problem
In recent years, Generative Artificial Intelligence, which we will henceforth refer to as "AI," has evolved at a dizzying pace, transforming entire industries and revolutionizing the way work gets done. This technology, which combines natural language processing, deep learning and cognitive automation, has the potential to exponentially increase overall productivity. However, it also poses an urgent challenge: the replacement of human workers in tasks that, until recently, were considered exclusively human.
The relevance of this problem is undeniable. According to the International Monetary Fund (2024), AI could affect 40% of jobs globally; , Goldman Sachs (2023) estimates that more than 300 million jobs could be altered by this technological disruption, especially in sectors such as financial, administrative, legal and office services. This level of transformation is comparable, albeit more accelerated, to that of past technological revolutions, such as the mechanization of agriculture or industrial automation in the 20th century. The speed with which AI is surpassing human performance in certain fields increases the need to focus our attention on studying, understanding and preventing adverse effects on the economy.
The International Labor Organization (ILO) puts this phenomenon into perspective by comparing it with previous technological transitions. In its article "Minimizing the Negative Effects of Unemployment
AI-induced technological progress".Berg, J. (2024) explains that, historically, technological progress has replaced certain jobs but generated new ones. However, the current speed of change, much faster than in previous eras, exceeds the capacity of educational, social and labor systems to adapt, leaving millions of workers vulnerable. The ILO warns that without transition policies, AI could deepen inequality, erode labor rights and reduce aggregate demand due to loss of income and consumption.
Despite multiple studies estimating which occupations are at risk, there is a gap in the economic literature: few analyses have quantitatively assessed the effect of AI-generated unemployment on countries' economic growth, particularly on Gross Domestic Product (GDP). This research seeks to close that gap.
The main objective of this project is to estimate the impact of unemployment generated by AI on GDP in different countries, considering key factors such as sectoral susceptibility to AI, the possibility of remote work, national preparedness (measured through BCG's ASPIRE index), and the differential impact of unemployment on consumption in each country, allows us to build a comprehensive view of the problem. The expenditure approach takes on special importance considering that private consumption between 52% and 78% of GDP in the countries analyzed, and that unemployment is one of the factors that most directly affects it.
The results will allow comparison between countries at different levels of development, revealing not only the degree of exposure to technological unemployment, but also the potential impact on the aggregate economy. For example, countries with high technological readiness and high dependence on consumption, such as the United States and the United Kingdom, could be more vulnerable to the economic impact of automation, despite being better positioned technologically.
Therefore, this study not only contributes to the understanding of the link between AI, unemployment and economic growth, but also proposes a novel and quantitative approach that could guide more effective public policies. The integration of historical evidence,
sectoral analysis and economic modeling makes it possible to anticipate the effects of automation and act in time. In a context of accelerated disruption, recognizing and mitigating the risks of technological unemployment becomes a necessary condition for a just transition to an inclusive digital economy.
2. Research Question.
What is the impact on Gross Domestic Product (GDP) in countries at different levels of development of unemployment possibly generated by the replacement of the labor force in the sectors most susceptible to automation by AI?
3. Objectives
3.1 General
The objective of this research is to analyze the possible impact of unemployment generated by AI in various countries. To this end, variables such as the composition of sectors in employment and within GDP, the impact on consumption, the readiness of countries to adopt AI, and the susceptibility of each sector to be replaced by AI were considered.
3.2 Particular (Specific) Objectives
Identifify the sectors most likely to be replaced by Artificial Intelligence and their percentage of susceptibility, using previous studies and relevant data to build a global picture.
Determine the sectors' share of GDP and national employment in each country.
Calculate the impact by the expenditure method GDP derived from the affectation in consumption due to unemployment generated by AI within each country to obtain a comparative view.
Find the impact of AI-generated unemployment on GDP by industry.
3.3 Personal Objectives
My main interest is to integrate my financial and economic knowledge with the dynamics of emerging technologies. I believe that Artificial Intelligence is a tool that can benefit humanity, however, we cannot use it lightly without first thinking about the implications that this may entail for society and the economy. , I am passionate about being one of people who contribute to make visible this global risk and in the future, generate economic risk mitigation strategies, in addition to learning about all the dimensions that Artificial Intelligence has.
I consider the skills in seeking out research to nurture this project, engaging in conversations with my peers on relevant topics, performing information analysis, and constructing appropriate visualizations of data to be skills that will positively contribute to my career taking a high-impact path in the area of Artificial Intelligence.
4. Methodology
This chapter describes the methodology used to estimate the impact of AI-induced unemployment on the GDP of various countries. To this end, a quantitative and comparative approach was designed, based on secondary sources and calculations derived from recognized economic and technological research. The analysis integrates key variables such as sectoral susceptibility to automation, the proportion of tasks that can be performed remotely, the sectoral share of employment and GDP in each country, national readiness to adopt AI, and the decrease in consumption caused by unemployment. Based on these data, two methods of estimating the impact on GDP were developed: one using the expenditure method and the other using the sectoral method. The sources, assumptions, weights and procedures used for each variable included in the model are detailed below.
4.1 Selection of countries for the study
Six countries were selected for this research: China, United States, Mexico, United Kingdom, Brazil and Switzerland. The choice of these countries
responds to the intention of evaluating the impact of AI-generated unemployment in diverse economic contexts. These countries represent different levels of economic development, sectoral employment structures and relative weight of consumption in GDP, which allows us to contrast how the effect of AI on unemployment and economic growth varies in heterogeneous scenarios.
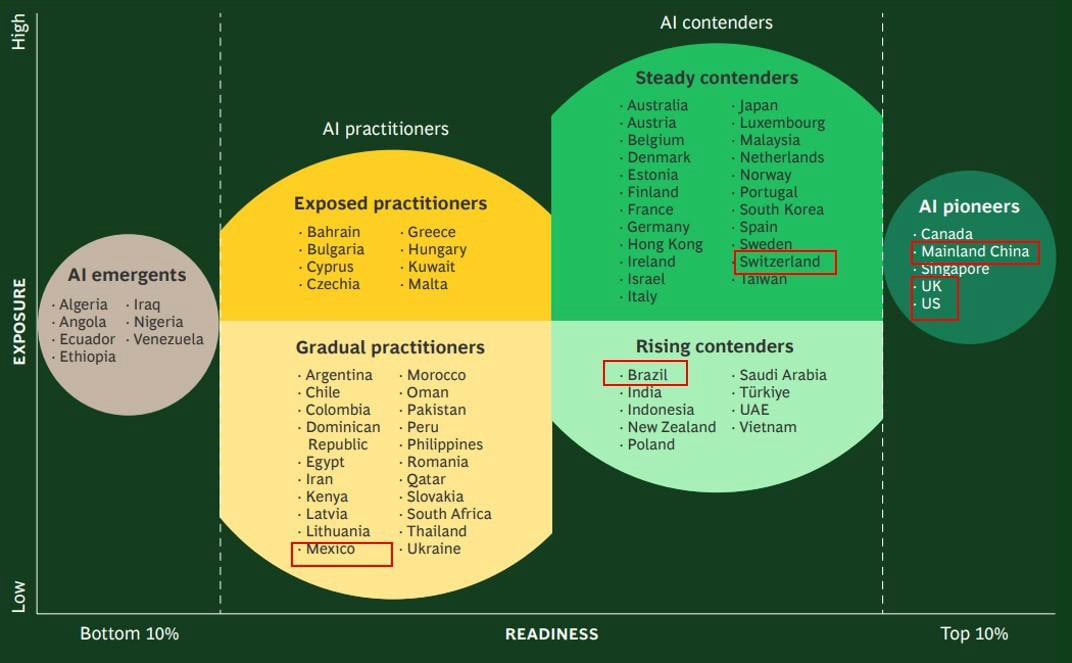
Additionally, the selection was based on Boston Consulting Group (2024) in its AI Maturity Matrix article, where it classifies countries according to six dimensions: ambition, skills, policies and regulation, investment, research and innovation, and digital ecosystem. As shown in Figure 1, according to this ranking, the United States, the United Kingdom and China represent economies with high technological readiness, ranking as leaders in AI adoption and development.
Switzerland shows solid readiness, standing out for its advanced digital infrastructure and strong investment in research. Mexico and Brazil are at a lower level of maturity, with limitations in specialized human capital, public policies and technological ecosystems, which makes them key cases to observe how AI impacts emerging economies. This variety of archetypes allows us to analyze how technological readiness modulates the pace and magnitude of AI-induced unemployment, as well as its macroeconomic consequences.
Figure 1. Distribution of economies under the AI adoption archetype, 2024 Source: The AI Maturity Matrix Boston Consulting Group (2024).
4.2 Sectoral susceptibility to generative artificial intelligence
Determining the susceptibility of the sectors, starting from the specific jobs is really complex due to the diversity of jobs that exist in each of the companies, so the best approach to assess susceptibility is to study the tasks that are performed in the jobs belonging to each of the sectors, thus establishing what percentage of the tasks can be performed by the AI.
Likewise, susceptibility to AI can vary from sector to sector, because the tasks and specific skills required in each of them differ in level of knowledge, periodicity, tools used and other characteristics of the nature of the task being performed. In order to determine the most affected sectors and calculate their susceptibility, variables such as: remote or on-site work, the nature of the tasks, the maturity of the technology in the sector and the specialization of the jobs were found in the literature.
Two variables were used for this research, the first one the percentage of tasks that can be performed by AI and the second one, the percentage of tasks that can be performed remotely. The first variable was selected thanks to the fact that its calculation takes into account intrinsic aspects of the tasks, such as level of dificulty, technology used to perform it and the specialization of the task; the second variable was chosen because it is considered important given that a task that is performed remotely has greater ease of being automated as will be explained in the following section. Now, we will go deeper into each of these variables:
Percentage of tasks that can be performed by AI: The amount of repetitive tasks a job has and the amount of tasks related to data analysis and rule-based decision making are key criteria for determining whether a job is amenable to automation (Goldman Sachs, 2023). Additionally, the latest AI innovations mark a real break with the technological changes of the past, moving from physical automation to cognitive automation, which impacts creative jobs (International Monetary Fund, 2024).
For this variable, we use the data obtained by Goldman Sachs at its publication Global Economics Analyst The Potentially Large Effects of Artificial Intelligence on EconomicGrowth (2023), where they highlight 13 job activities, out of a total of 39 in the ONET (Occupational Network) database, an online database of the U.S. Department of Labor, for their susceptibility to automation by AI, assuming that AI is capable of completing tasks with a dificulty of up to 4 on ONET's 7-point "level" scale. They then take an importance- and complexity- weighted average of the essential job tasks for each occupation and estimate the proportion of each occupation's total workload that AI has the potential to replace.
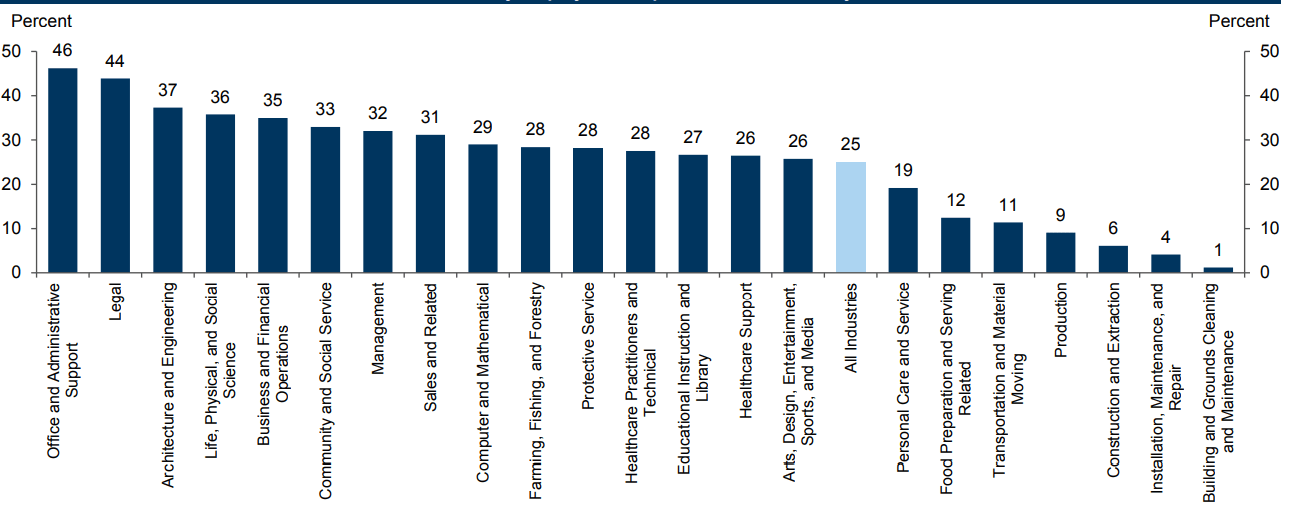
For this research, the 13 labor activities presented by Goldman Sachs were not used, but only those that had a percentage greater than or equal to 26%, to the extent that these industries are above the global average. In figure 2 the sector is presented on the X axis and on the Y axis the percentage of tasks that can be performed by AI according to Goldman Sachs (2023).
Figure 2. Share of work exposed to automation by AI by sector in the States, 2023. Source: Goldman Sachs Global Investment Research (2023).
Percentage of tasks that can be performed remotely: It is intuitive to think that sectors with a higher share of remote tasks are more vulnerable to be replaced by AI, this is because implementing AI solutions in remote jobs is easier, considering that the technology needed automation is more developed and accessible for jobs that are performed in a digital environment. This allows AI to be easily integrate into tools and platforms already in use for remote work (McKinsey Global Institute, 2023).
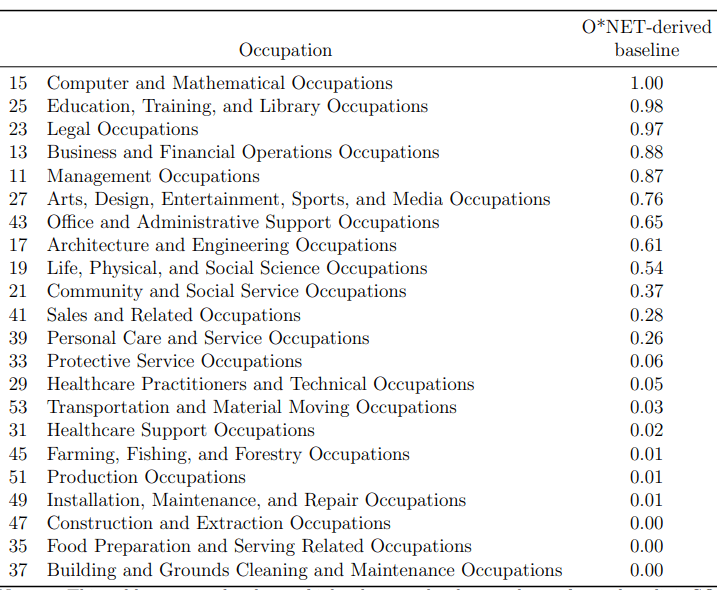
For the value of this variable, we used the results of the research conducted by Dingel and Neiman (2020), "How Many Jobs Can be Done at Home?", where they obtained the results presented in Table 1, which shows in the first column the sector to which the occupation belongs and in the second column the percentage of work that can be done from home according to ONet.
Table 1. Proportion of jobs that can be done from home by sector, 2020. Source: Dingel, J. & Neiman, B (2020).
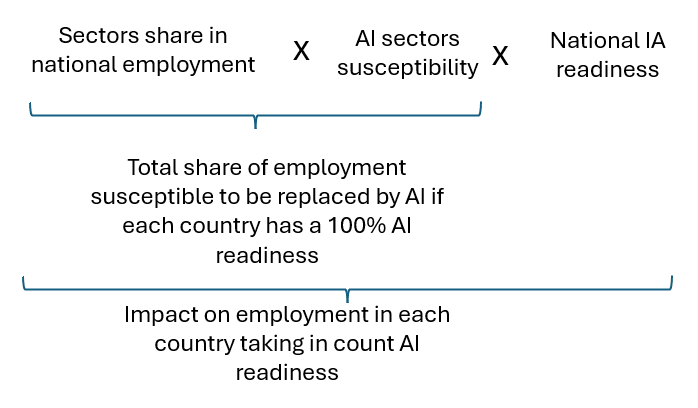
After having the data of both variables, a weighted product was made where the variable of percentage of tasks that can be performed by AI had the highest weight (70%) since it is the most determinant variable within the study, while the percentage of tasks that can be performed remotely was assigned a weight of 30% since, as mentioned above, remote jobs are more easily adopted by AI. This calculation is presented in formula 1:
Sectoral susceptibility to AI = (Percentage of tasks that can be performed by AI) X (Percentage of tasks that can be performed remotely)
Formula 1. Formula to calculate the susceptibility of the sector to be replaced by AI.
4.3 Sectoral share of employment and GDP in each country
In order to obtain the data on the participation by sectors within the GDP by industry and the participation of the sectors in the employment of each country, the data of the entities in charge of national statistics in each country were consulted, which is shown in Table 2, where the country is presented in the first column, the name of the entity from which the information on employment by sector was obtained in the second column and the entity from which the composition of the GDP by industry was extracted in the last column.
Country
Source of employment by industry
Source of GDP by industry
United States
.S. Bureau of Labor Statistics (BLS).
Federal Reserve Economic Data (FRED)
Mexico
National Institute of Statistics and Geography (INEGI)
National Institute of Statistics and Geography (INEGI)
Brazil
Annual Social Information Report
(RAIS)
Economic Commission for Latin America and the Caribbean (ECLAC)
Unite d Kingd om
Ofice of National Statistics (ONS).
Ofice of National Statistics (ONS).
China
Census and Statistics Department (CSD)
National Bureau of Statistics of
China (NBSC).
Switzerland
European Employment Services (EURES)
State Secretariat for Economic Affairs (SECO)
Sources of information on sectoral shares of GDP by industry and sectoral shares of employment in each country.
One of the main methodological limitations of this study lies in the collection and standardization of data on employment and sector participation in GDP. Given that each country reports this information under different classifications and nomenclatures, it was necessary to carry out a homologation process to group the data into common sectoral categories. Although every effort was made to preserve the consistency and fidelity of the information, this procedure may introduce a certain margin of error or loss of precision, which could affect the accuracy of some results. Nevertheless, this methodological decision was indispensable to allow for a consistent international comparison and to advance the proposed analysis.
After the homologation, the sectors were purged in order to select only the sectors that in the numeral 4.2 were identified as susceptible to be automated by AI. It is important to highlight that due to the dificulty of finding certain information, it was not possible to have the data for the same year for all countries, however, all data are from the year 2021 onwards.
4.4 Preparedness by country to adopt AI
It is no secret that technology is more easily adopted in certain countries, especially those with greater technological investment and economic development; this represents a competitive advantage in technological terms, however, it can be counterproductive at a social level, since the transition from tasks performed by human workers to those performed by AI would be easier. For this reason, country readiness to adopt AI is included as an important variable in the modeling.
Therefore, we rely on the research conducted by Boston Consulting Group (BCG) in their publication AI Maturity Matrix (2024) where they assess the readiness of each economy to take advantage of AI's growth potential and mitigate potential risks according to six variables:
Ambition: Corresponds to the existence of strategies related to
artificial intelligence and related government agencies.
Skills: Refers to the concentration of AI specialists, public contributions on GitHub, number of package downloads for Python, among others.
Policy and regulation: Includes aspects such as regulatory quality, governance effectiveness, data governance and free economy index.
Investment: value of AI unicorns, percentage of market capitalization of technology companies over GDP, financialization of AI companies, among others.
Research and innovation: Covers publications and patents related to AI, ranking of universities in the field of data science and AI, and number of AI startups.
Ecosystem: Includes concepts such as electricity prices, download speed, online services indexes and infrastructure, among others.
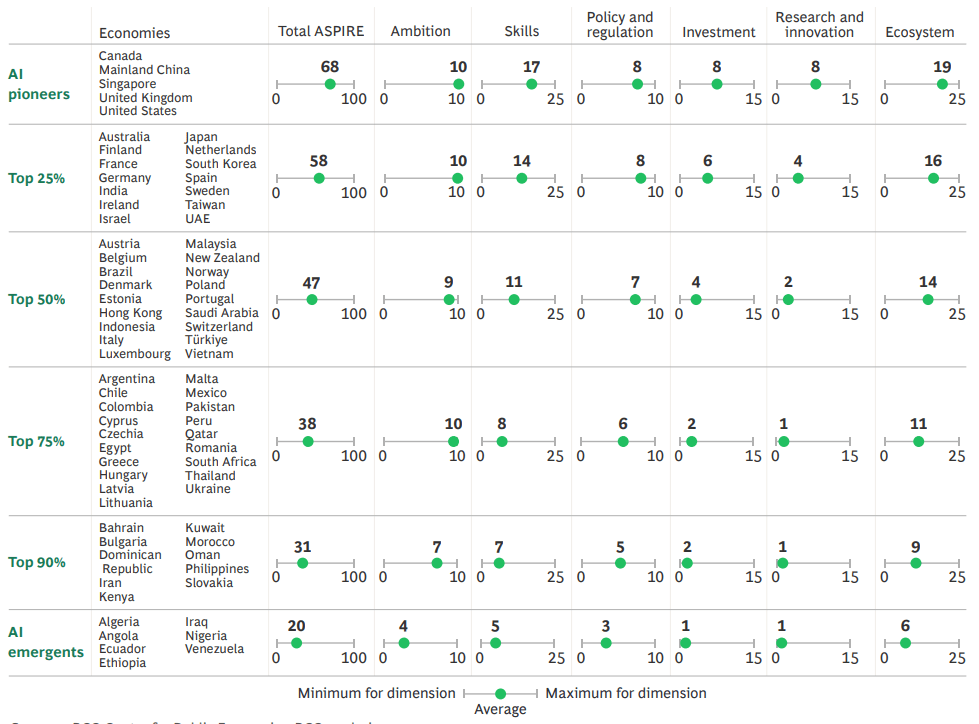
According to these variables, BCG assigns a qualification (called ASPIRE index) to determine the country's readiness to adopt AI on a scale of 0 to 100. The results obtained in the aforementioned research are presented in Table 3, which groups the countries with similar characteristics and their qualification in the six variables mentioned, as well as the final result of the ASPIRE Index.
Table 3. ASPIRE INDEX, 2024. Source: Boston Consulting Group (2024).
For this research, qualification was employed as a percentage, i.e., a country with an ASPIRE of 100% would be a nation fully ready to adopt AI, while a nation with 0% would imply that it has no capacity to implement AI at the moment.
4.5 Decrease in consumption due to unemployment in each country
The relevance of this variable is manified in that, although consumption decreases when people lose their jobs, it is not correct to assume that they will stop acquiring 100% of the goods or services they purchased while they were employed. This variability in the decrease in consumption is due to the persistence of certain essential expenditures and to the adaptation of the patterns of
This is crucial for understanding the dynamics of consumption in periods of unemployment.
After an exhaustive search, this variable was found for four of the six countries studied, with each study evaluating different factors. The studies by country and the factors they considered are presented below.
United Kingdom:
The study conducted for the Structural Economic Analysis Division of the Bank of England was used, in which the following factors were evaluated:
Distribution of occupational safety
Age and type of work
Purchase of durable goods
Estimated permanent income
United States:
Research by Melvin Stephens Jr for the National Ofice of Economic Research (2024) evaluated the following factors:
Disposable Income
Unemployment Insurance Benefits
Access to Credit
Consumption Models
Number of months without employment
Future Expectations
Necessary vs. Discretionary Expenses
Brazil:
The study conducted by Gerard, François, and Naritomi (2021) was used to study the following factors
Alternative consumption models
Exhaustion of unemployment insurance benefits.
Impact of the extension of unemployment insurance benefits.
China:
In the study prepared by Zhao, Guo and Song for the Journal of Shanghai University of Finance and Economics (2024), the following variables were used:
Consumer spending categories
Social security
Unemployment insurance
Accumulated wealth
Mexico and Switzerland:
As for Mexico and Switzerland, it was not possible to find the percentage decrease in consumption due to unemployment, which represents a gap in the literature and an impediment to analyze these two countries.
Table 4 shows the results of the research mentioned above, in the first column is the country and in the second column the percentage decrease in consumption due to unemployment. In most of them they obtained a range of percentages, while only for the case of China only one percentage was obtained.
Country
Percentage decrease
United Kingdom
2,7% a 11%
United States
17% a 30%
Brazil
14,1% a 17,3%
China
6%
Table 4. Percentage decrease in consumption due to unemployment by country.
4.6 Calculate the impact of the expenditure method on GDP.
GDP by expenditure method is a way of calculating the total value of all the final goods and services produced in an economy during a given period. This method sums the expenditures made by the different economic agents on consumption, investment, government spending, and net exports (exports minus imports), as presented in formula 2:
GDP by expenditure= Consumption+ Investment+ Public expenditure+ Net exports
Formula 2. Formula for calculating GDP by the expenditure method.
The GDP by expenditure methodology provides a complete and consistent view of the evolution of expenditures on goods and services,
(INEGI, 2023). This method was selected for the research thanks to the fact that one of its components is private consumption, a variable that is directly affected when changes in the level of employment materialize. When people lose their jobs, they experience a drop in their income, economic uncertainty and decreasing or cancelling access to credit, which directly affects their ability to spend on goods and services (Ganong & Noel, 2019). Additionally, private consumption represents the largest share of total spending in an economy, emphasizing the importance of studying this variable.
Although this method has four variables, in the research only the impact of unemployment on consumption is evaluated due to time limitations when developing the study, nevertheless it is important to evaluate in future research how unemployment can affect other variables. However, it is important to consider that unemployment can also have significant effects on other macroeconomic variables. For example, a reduction labor income could lead to a decrease in the volume of imports, while public spending could increase as a result of higher transfers and subsidies destined for the unemployed population. This increase in spending, in turn, can generate tensions, especially if it is accompanied a reduction in tax revenues from consumption and labor income taxes.
The following variables were included in the calculation of the impact on consumption:
The weight of private consumption in GDP by expenditure in each of the countries by 2023.
Sectoral susceptibility to IA (Obtained in section 4.2).
The sectoral share of employment in each country (obtained in section 4.3).
The variable corresponding to the country's readiness to adopt the IA (obtained in section 4.4).
Finally, we considered the percentage of household consumption that decreases due to unemployment in each country (obtained in section 4.5).
After having all the variables collected, the following procedure was carried out for each country (except for Switzerland and Mexico since, as mentioned above, the variable of decreased consumption due to unemployment in these two countries could not be found):
The sectoral share of employment was multiplied by sectoral susceptibility to AI, thus obtaining what percentage of employment in the sector can be replaced by AI.
The sum of the previous result was grouped by country, in order to obtain the total percentage of jobs that can be replaced by AI in each country.
The above result assumes that AI will automate 100% of the tasks it is capable of performing, however, the ease with which AI can be employed in each country depends on the country's readiness to adopt it, so it is not correct to assume that 100% of the tasks will be replaced, therefore, the total percentage of jobs that can be replaced by AI is multiplied by the country's readiness variable to adopt AI.
Up to this point we already know what the impact on employment is for each country (for clarity refer to formula 3). Accordingly, the impact on consumption is calculated to finalize obtaining the impact on GDP. Thus, we multiply the percentage of jobs that AI can replace according to each country's readiness by the variable that tells us how much consumption decreases due to the loss of employment in the country. In this way, we obtain the impact on consumption due to the unemployment generated by AI.
Finally, we need to know the share of consumption in GDP, as this will be decisive to find the total impact. To do this, we multiply the impact on consumption in each country by the weight of consumption within GDP in that country, and thus obtain the total impact on GDP per country. As illustrated in formula 4.
Formula 3. Formula for calculating unemployment triggered by generative AI in the country
Total impact on the GDP per expenditure method= Impact of the unemploymen generated by AI on consumption X Consumption share on GDP X Country GDP 2024
Formula 4. Formula to calculate the impact on GDP per expenditure of unemployment generated by AI in the country.
4.7 Calculating the impact the GDP method by industry
GDP by industry, also called sectoral GDP, quantifies the economic contribution of each branch of activity to a country's total GDP. This indicator makes it possible to analyze how the production of goods and services is distributed among different economic sectors.
This method was selected because it distinguishes the participation of each of the sectors within the GDP, allowing to capture the susceptibility to AI of each sector in the calculation of the impact of unemployment on the GDP.
The following variables were considered to calculate the impact on GDP:
The sectoral share of each country's GDP (obtained section 4.3).
Sectoral susceptibility to IA (obtained in section 4.2 ).
The variable corresponding to each country's readiness to adopt the IA (obtained in section 4.4)
Once all the variables were collected, the following procedure was used to obtain the impact on GDP in each country:
The sectoral share of GDP was multiplied by the sectoral susceptibility to AI, thus obtaining the percentage of the sector that can be replaced by AI.
The above result was summed for each country to obtain the total percentage of the sector that can be replaced by AI in each country.
The above result, as in GDP per expenditure, assumes that AI will automate 100% of the tasks it is capable of performing, however, the ease with which AI can be employed in each country depends on the country's readiness to adopt it, so it is not correct to assume that 100% of the tasks will be replaced. Therefore, the total percentage of the sector that can be replaced by AI in each country is multiplied by the country's AI readiness variable.
The above procedure is illustrated in formula 5:
Formula 5. Formula to calculate the impact on GDP by industry of unemployment generated by AI in the country.
5. Results and Discussion
5.1 Sectoral susceptibility to AI
Next, the results of the proposed models are presented, which allowed us to identify the sectors most susceptible to be automated by generative AI and to evaluate the impact of unemployment on GDP by expenditure and industry. Subsequently, these findings are discussed in terms of previous studies and the implications they might have.
First, in order to determine how unemployment generated by generative AI impacts GDP, it is necessary to know the extent to which this technology affects different sectors, therefore in the
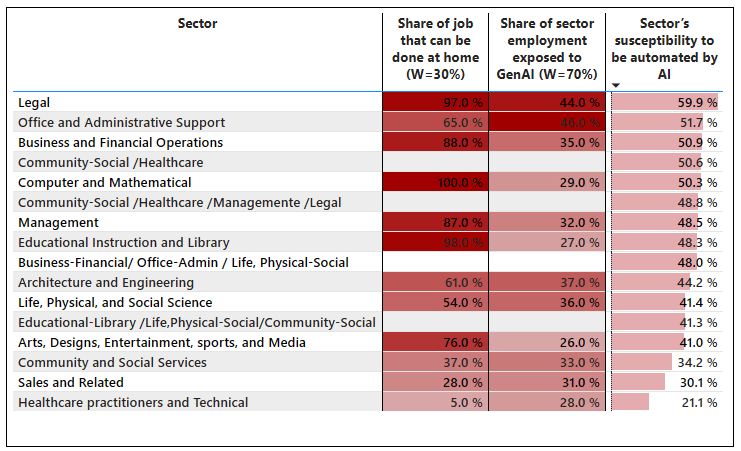
Table 5 shows in the first column the sector evaluated, in the second column the percentage of tasks that can be performed remotely, in the third column the percentage of tasks that can be performed by the generative AI, and in the last column the result of the calculation using formula 1 described earlier in the methodology.
Now, going deeper into the top three most susceptible sectors, we find that the legal sector presents 59.9% susceptibility, the highest among all sectors, leveraged by a high percentage of remote tasks (97%), as well as high percentage of tasks that can be performed by generative AI (44%). In second place is the administrative and office support sector which despite having a higher percentage of tasks exposed to AI than legal (46%), obtains a lower percentage of susceptibility (51.7%) due to the fact that only 65% of its tasks can be performed remotely. In third place is the commercial and financial operations sector, explained mainly because 88% of the tasks in this sector can be performed remotely, while generative AI can perform 35% of its tasks.
The IT and mathematics sector presents an interesting result because although 100% of its tasks can be done remotely, only 29% can be performed by AI, obtaining a susceptibility to AI of 50.3%; it should be noted that this 29% was calculated in 2023 when AI has not yet surpassed human performance in certain areas, however, according to Boston Consulting Group, AI will surpass the level of human mathematical competence in 2024.
Table 5. Percentage of sectoral susceptibility to generative AI. Own elaboration based on data from Goldman Sachs (2023) and Dingel, J. & Neiman, B (2020).
These results are partially aligned with those obtained by BCG in its publication IA Maturity Matrix 2024 where financial services present a high exposure to IA; however in the sales sector we obtained differences, since for BCG it is a sector of high exposure, while according to our data it is not one of the most exposed sectors due to the relatively low percentage of remote tasks performed in this sector (28%).
To better understand these results we will analyze the reasons behind the data presented:
Legal sector
The high percentage of remote work (97%) in the legal sector can be attributed to technological advances, such as secure communication tools and cloud-based document management systems, which facilitate tasks such as legal research, document drafting, and client communication (The Franklin Law, 2025). However, certain tasks, such as court appearances, depositions, and sensitive client meetings, still require in-person assistance.
AI is transforming the legal sector by automating tasks such as document generation, legal research, contract review, and predictive analytics (Contini, 2024)
However, complex legal strategy, client advice and negotiations remain areas where human expertise is indispensable, so the tasks that can be replaced by generative AI is about 44%.
Administrative and office support sector:
Jobs in this sector can, to a large extent, be performed remotely thanks to communication tools and project management platforms, which allow for efficient handling of administrative tasks such as scheduling, data entry and document management. Even so, some tasks require being face-to-face, such as handling physical documents, supporting events and meetings, or managing office teams.
In terms of the percentage of tasks that AI can perform are document generation, data analysis and programming (Amado et al., 2024), which have a significant share in the sector, while human expertise is needed for complex problem solving, personalized communication and strategic planification.
Commercial and financial operations sector:
This sector has embraced remote work and is eficient to handle tasks such as financial planning and analysis, advisory services and business negotiations.
, AI can tasks such as financial analysis, automation of transactional processes, data processing, validation and prediction, reporting and trend identification (Cambridge University Press, 2023). On the other hand, complex problem solving, personalized customer interactions, and strategic decision making are tasks that AI would not replace for the time being.
On the other hand, examining the three sectors with lower susceptibility to AI but which have more than 26% of tasks which can be performed by generative artificial intelligence, we observe the following sectors:
Health professionals and technicians sector:
The low percentage of remote work for healthcare professionals and technicians can be explained by the nature of their work, which often requires in-person interactions and direct patient care to perform procedures. However, in recent years, the involvement of telemedicine and remote patient monitoring has increased, so the behavior of this variable may change (Tursunbayeva & Renkema, 2022).
The percentage of tasks automated or performed by generative AI explains why AI performs very well in medical knowledge management, medical image analysis, and patient monitoring. However, the integration of AI into healthcare remains a complex and evolving process, and there are concerns about the impact of the technology on job design and the roles of healthcare professionals (McKee & Correia, 2024).
Sales and related industries
Research conducted by Dingel & Neiman (2020) indicates that the sales and related industry has 28% of tasks suitable for remote work. Neiman (2020) indicates that the sales and related sector has 28% of tasks suitable for remote work, despite this, it is considered that since June 2020 that such research was conducted, sales dynamics have changed and it is considered that this percentage may be higher today, especially since according to Gartner, one of the most important global IT research and consulting companies, by 2025, it is expected that 80% of B2B sales interactions between buyers and sellers will occur in digital environments (2025).
In contrast, according to Goldman Sachs, generative AI can perform 31% of the tasks in this sector, yet it is considered that this percentage will continue to increase, since AI has the ability to generate personalized mailings, to suggest the tone and brand positioning aligned with the target audience of customers and , it has been integrated into various functions of e-commerce , and its use continues.
expanding as technology advances and becomes more widely adopted(Shopify, 2024).
Social and community work sector:
The nature of many social and community work roles allows a part of the tasks to be performed remotely through the use of technology and the provision of virtual services, despite this, the study used in this research afirms that only 37% of the tasks can be performed remotely. This can be explained by some activities related to care for vulnerable families, older adults or people with certain disabilities who are denied access to technological means.
Many administrative, case management, and information gathering tasks in social work can be automated or assisted by AI- powered tools. However, the central human element in social work remains essential, and full automation of these tasks may diminish the quality of service delivery.
5.2 Impact of AI-generated unemployment on GDP by expenditure
This section will show the values obtained for each of the variables used in the calculation and their incidence on unemployment and Gross Domestic Product by the expenditure method in the countries studied. To begin with, it is important to understand the values found for the variables in each of the countries:
Readiness to adopt AI and the share of consumption in GDP:
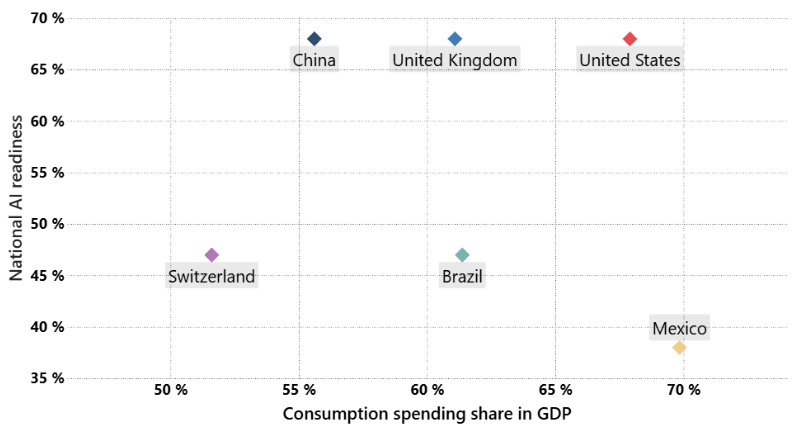
Figure 3 shows the share of private consumption in GDP on the X axis and AI readiness on the Y axis; additionally, each of the diamonds on the plane represents a country. It shows that China, the United States and the United Kingdom have the same AI , which is 68%, Switzerland and Brazil are at the same level with 47% readiness, while Mexico has the lowest readiness, which is 38%. These data mean that the more prepared a country is, the faster and easier the transition from employment to AI will .
A similar behavior is present in the participation of private consumption, the more a country's GDP depends on this parameter, the greater its impact on the economy, this is because unemployment or income level directly affects the purchase of goods and services for personal and domestic use. In this case, the country that would have the least impact due to this variable would be Switzerland, since consumption only weighs 52%, while the greatest impact would be in Mexico, although the low readiness to AI in this country can counteract the effects on the overall impact. For its part, the United States has high readiness and a high concentration in consumption, which indicates a significant risk to national GDP.
Figure 3. Level of preparedness to adopt AI and percentage share of private consumption in GDP by country. Own elaboration
Sectoral share of employment in each country
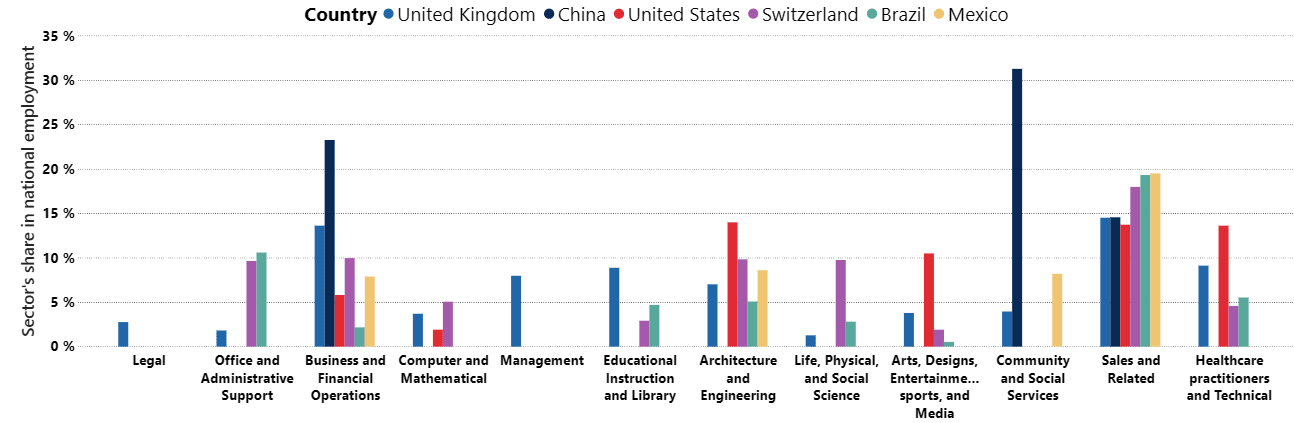
Figure 4 shows each of the sectors studied and their share of employment in each country. Each country is displayed in a different color; on the X-axis is the name of the sector, organized from highest to lowest susceptibility and on the Y-axis is displayed the percentage share of the sector in employment. In addition, each country is represented with a color indicated in the symbology above.
Figure 4. Share of employment by sector in each country. Own elaboration
In essence, it is observed that the United Kingdom is the only country where all sectors have a share because it was the country with the most detailed employment information, which allowed a more detailed allocation of employment in each of the groupings, while countries such as China, employment was concentrated in few sectors due to the low level of detail found in the sector data.
Additionally, it is evident that the commercial and financial operations sector is present in all countries and is the third most susceptible sector, which makes it a sector of global attention, especially for China and the United Kingdom, since this sector has an employment weight 23% and 14%, respectively.
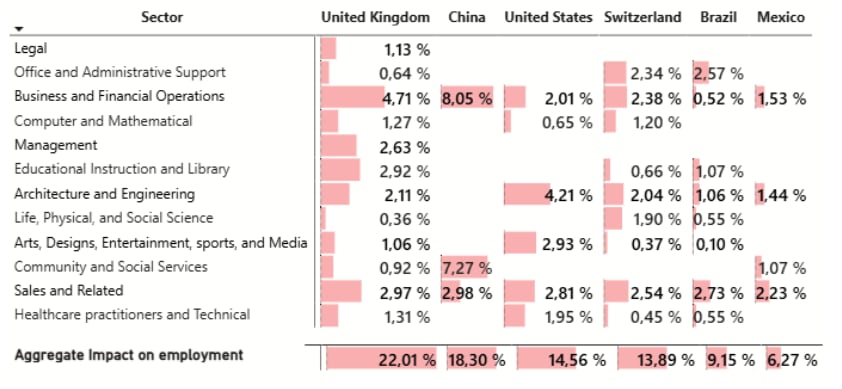
Formula 3. Formula for calculating the unemployment triggered by generative AI in the country, the following results are obtained and presented in Table 6, which shows the sector analyzed in the first column. The following columns correspond to the countries studied, in turn, the values in them evidence the impact of AI on employment in each country, i.e., the percentage of jobs that would be displaced by generative AI and finally, the bottom fila shows the total impact on employment or, in other words, the unemployment generated by AI in each country.
Table 6.Percentage of potential unemployment triggered by Generative AI by country and sector. Own elaboration
The results are very interesting, as although the UK, US and China have an AI readiness of 68% for being AI pioneers, the impact on employment varies considerably between the three countries due to the different composition of sectors within the workforce in each country. The same is true for Brazil and Switzerland, both countries have an AI adoption readiness of 47% but Switzerland has an impact four percentage points higher than Brazil. For its part, Mexico has the lowest impact on employment because its readiness to adopt AI is only 37% and it is the country with the lowest concentration of employment in the sectors identified as susceptible to AI in this research.
On the other hand, it is important to note that although the sales and related sector only has a susceptibility to AI of 30.1%, it is a sector that has an impact of more than 2.2% in all the countries studied due to its high share of employment, with a weight of between 13% and 20% depending on the country. In addition, it was previously mentioned that the susceptibility of this sector may increase in the future, making it a sector that should be closely monitored, because as susceptibility increases, its impact on unemployment will increase.
The results obtained under this methodology are more conservative
than those presented in Cazzaniga (2024) where they found the participation of the occupations with highwhich AI exposure and low complementarity, which they defined as jobs with high probability of AI replacing humans, was around 20% in Brazil and 30% in the United States and United Kingdom, while in this study the percentage of affected employment was found to be 9.15% in Brazil, 14.56% in the United States and 22.01% in the United Kingdom.
In summary, AI could generate different levels of unemployment in each of the countries, reducing between 9% and 22% of labor demand; however, the impact could be less if strategies are implemented so that people belonging to the most affected fields acquire competitive skills in the labor market.
In the same vein, unemployment as a key indicator of the labor market does not operate in isolation in the economy, but has a significant impact on the dynamics of the country, especially on the gross domestic product. Unemployment has important implications on household consumption, which is the variable with the greatest weight within the GDP calculated by the expenditure method; at this point is where it becomes relevant to know how much consumption decreases when an individual loses his or her main source of income in each country, this information is found in Table 4 presented in the methodology.
It is worth noting that this data could not be found in the literature for Mexico and Switzerland, which prevented us from calculating the impact on consumption and, therefore, the impact on GDP for these countries.
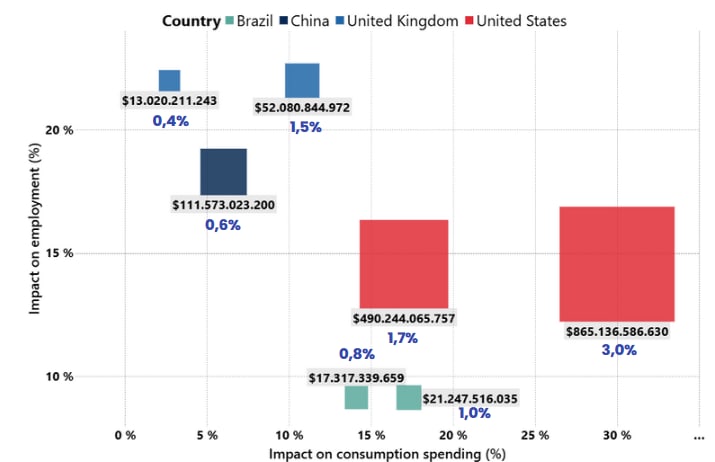
After introducing the impact on employment, the impact on consumption and the share of consumption of each country in formula 4, the results presented in Figure 5 are obtained, where on X axis is the impact of unemployment on consumption according to the research mentioned above, on the Y axis the impact on employment resulting from the methodology of this research is presented, in addition to the fact that each country is represented by a different color and the size of the square indicates the magnitude of the impact on GDP, accompanied by the value in U.S. dollars and the percentage impact.
It should be noted that some countries are represented with two squares, since the impact of consumption in these cases covers a
range from a lower to a higher value, according to the research consulted as shown in Table 4. Therefore, it was decided to represent both extremes of the range to adequately reflect the variability in the possible effects.
Under the defined methodology and the GDP data for each country in 2024, the country with the greatest impact on GDP is the United States with an impact of between US$490,244 million and US$865,136 million. It is worth highlighting that even though China has a lower percentage impact on employment (18.3%) and people living in this country decrease their consumption due to unemployment by around 6% (lower than in the United Kingdom compared to the upper limit of 10.8%), China has a higher monetary affectation than the United Kingdom due to its GDP magnitude.
Brazil is the country with the least monetary impact due to several factors, including the fact that it is the country with the lowest GDP in 2024 (US$2.19 trillion) and that the impact on employment is the lowest of the four countries analyzed.
Figure 5. Impact in U.S. dollars and % of unemployment generated by AI on GDP by country, calculated by the expenditure method. Own elaboration
In conclusion, the possible impacts on employment, consumption and GDP of labor force substitution by AI depend on the sectoral composition, the readiness to adapt to AI and the size of each country's economy. It is important to highlight that, although the percentages of likely impact obtained by this method are less than 3%, the monetary impact it could cause is very significant. To better understand these results, it is appropriate to refer to the Great Recession of 2008, where the U.S. GDP fell by 4%, in this order of ideas and with the exponential advance of AI and the possible impacts calculated, it is relevant to continue with research to generate information to mitigate possible impacts.
5.3 Impact of AI-generated unemployment on GDP by industry
This section incorporates two used variables: Sectoral susceptibility and the country's AI readiness, in addition, the sector's share within GDP is integrated as a determinant variable for this analysis and finally, the incidence of these factors on GDP by industry in the selected countries is discussed.
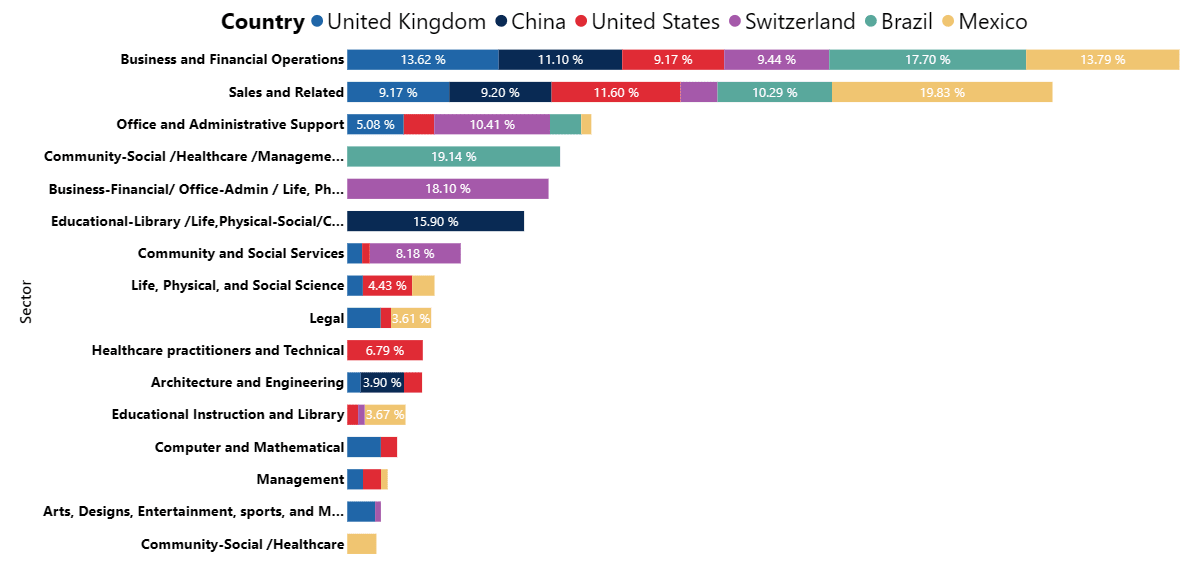
The values of the integrated variable are presented in Figure 6, which shows each sector analyzed and its share of GDP in each country, which are represented by colors. In general, it is observed that the business and financial operations sector contributes significantly to the economy of all countries, as does the sales and related sectors. It is noteworthy that, from the fourth to the sixth bar from top to bottom there are several sectors combined, this is due to the limitation mentioned above, because due to the level of information found on GDP by sector, it was not possible to group some data in a single group. To adjust this information, the most related sectors were grouped and the susceptibility of the grouping was the result of the average of the sectors.
Figure 6. Sectoral share of GDP by industry per country (%)
Continuing with the sectoral analysis, when the values Figure 6 are added up by country, it can be seen that the country with the highest percentage sectoral exposure to AI is Brazil, since susceptible sectors have a weight of almost 50%, followed by Switzerland with a weight of 48%, in third place is Mexico with 47% of GDP associated with affected industries, followed by the United States and the United Kingdom with 42% and finally China with 40%.
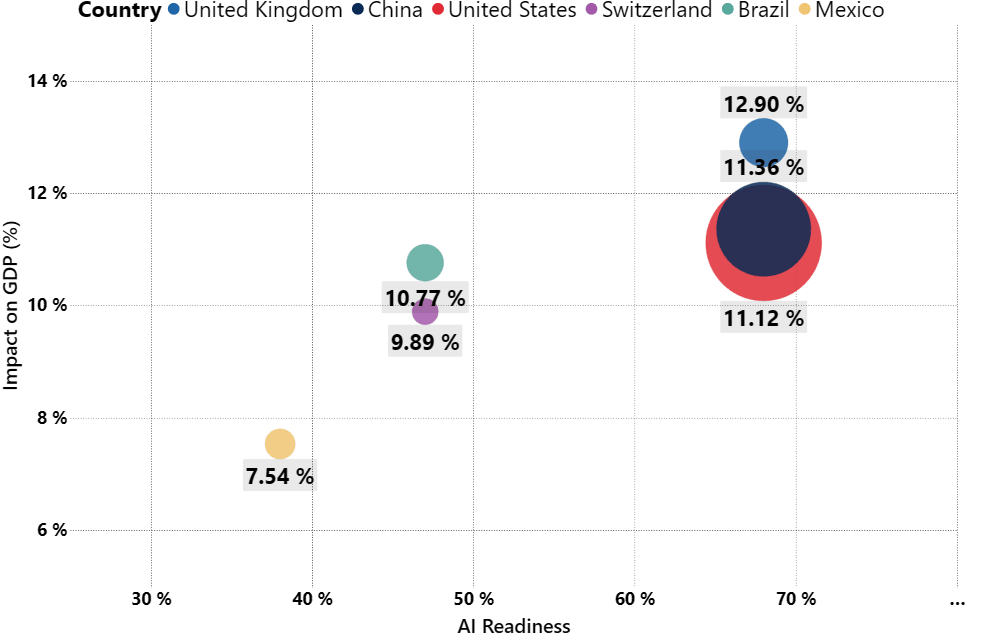
Once we had all the variables collected, we used Formula 5 to evaluate the impact in each of the countries, the results are illustrated in Figure 7, where the X axis shows AI readiness of each country and the Y axis and labels show the percentage impact of unemployment generated by AI on GDP, the size of the circle represents the magnitude of the impact in monetary terms.
In this case, as with the expenditure method, the United States has the highest monetary impact, although the percentage impact is higher in China (11.36%) and the United Kingdom (12.9%), mainly due to the fact that the GDP of the United States is the largest in the world, so small percentage changes have a large impact on it.
Mexico is the country with the lowest percentage impact even though it is the third country with the highest participation in the affected sectors due its low AI preparedness. Switzerland, on the other hand, is the country with the lowest monetary impact due to its lower GDP among the countries affected.
studied. On the other hand, Brazil and Switzerland have very close impacts, possibly because they have the same AI preparedness and similar shares of the affected sectors.
Figure 7. Impact of AI-generated unemployment on GDP by country, calculated using the GDP by industry method. Own elaboration
It is important to mention that the percentage impacts for each of the methods used differ considerably, since the GDP by industry method forecasts a greater impact, even though the impacts calculated under the expenditure method are considered to be more adjusted due to the variables involved. It would be ideal to go deeper into the method by industry to include new assumptions that allow identifying and using other variables that improve the fit of the model used.
6. Perspectives
Some possible future lines of research that are relevant based on the scope and limitations of the research are presented below:
Replicating the study in a broader set of countries to strengthen the comparability comparability y expand the understanding the impact of AI-induced unemployment in different socioeconomic contexts.
Periodically update the variables used in the model, considering that AI development is accelerated and can modificate sectoral susceptibility and technological readiness of countries in a short time.
Broaden the economic analysis to include the impact of technological unemployment on the countries' fiscal balance, contemplating effects such as the decrease in the collection of consumption taxes and labor income, as well as the potential increase in subsidies and social transfers.
Design methodologies to estimate the impact of technological unemployment in countries with limited data, as in case of Mexico and Switzerland, using imputation models or proxies based on countries with similar characteristics.
Investigate the effect of investment in AI technologies on national employment and economic growth, assessing whether this investment generates new complementary jobs or deepens labor substitution.
7. References
Amado, J. A., et al. (2024). Impact of Artificial Intelligence on Business Management. Asia Pacific Journal of Multidisciplinary Research, 6(3), 45- 60.
Berg, J. (2024). Minimizing the negative effects of the technological unemployment induced by the IA. International Labour Organization. https://www.ilo.org/es/resource/article/minimizando-los-efectos-negati vos-del-desempleo-tecnologico-inducido-por-la
Boston Consulting Group. (2024). AI Maturity Matrix. https://web-assets.bcg.com/fe/61/6962e74b44328f148c8a9ac1002d/ai- maturity-matrix-nov-2024.pdf
Cazzaniga, M., Jaumotte, F., Li, L., Melina, G., Panton, A. J., Pizzinelli, C., Rockall, E. J., & Mendes Tavares, M. (2024, January 14). Gen-AI: Artificial Intelligence and the Future of Work. Staff Discussion Notes No. 2024/001. International Monetary Fund. https://www.imf.org/en/Publications/Staff-Discussion-Notes/Issues/202 4/01/14/Gen-AI-Artificial-Intelligence-and-the-Future-of-Work-542379? cid=pr-com-SDNEA2024001.
Contini, F. (2024). Unboxing Generative AI for the Legal Professions: Functions, Impacts and Governance. International Journal for Court Administration, 15(2), 1. https://iacajournal.org/articles/10.36745/ijca.604
Dingel, J. I., & Neiman, B. (2020). Characteristics of Workers in Low Work-From-Home and High Personal Proximity Occupations. Becker Friedman Institute.
National Institute of Statistics and Geography (INEGI). (n.d.). Quarterly Gross Domestic Product by the Expenditure Method. INEGI. https://www.inegi.org.mx/temas/pibtg/
Ganong, P., & Noel, P. (2019). Consumer Spending during Unemployment: Positive and Normative Implications. American Economic Review,
Tursunbayeva, A., & Renkema, M. (2022). Artificial intelligence in health- care: implications for the job design of healthcare professionals. Asia Pacific
Journal of Human Resources. https://onlinelibrary.wiley.com/doi/full/10.1111/1744-7941.12325
McKee, M., & Correia, T. (2024). The Future of the Health Professions: Navigating Shortages, Imbalances, and Automation. The International Journal of Health Planning and Management. https://doi.org/10.1002/hpm.3865
McKinsey Global Institute (2023). Generative AI and the future of work in America. America.
The Franklin Law (2025). Remote Work in Law: Adapting to New Normal.
The Franklin Law. https://thefranklinlaw.com/remote-work-in-law-adapting-to-new-norm al/
Zhao, D., Guo, J., & Song, Z. (2024). How will Unemployment Affect Household Consumption in Urban China? Journal of Shanghai University of Finance and Economics, 26(4), 92-106.