About the CEA Groups Team
We help EA group organizers create excellent in-person and online spaces where people can deeply engage with EA principles by providing funding, training, advice, and resource curation for organizers. This overview describes the support we provide across our major program areas: university groups and city/national groups. It also covers our virtual programs platform (which will be covered by online team updates moving forward).
The following covers our work over the last 6 months – Q4 2021 and Q1 2022. We will be posting more about focus university groups in a separate update.
Some Recent Highlights
- Early Stage University Groups: The University Groups Accelerator Program pilot has been completed, with a participant NPS of +75 across the 7 groups. Thirty groups participated in the Spring version, we launched a summer internship for alumni, and started a hiring round to expand our team.
- Key location city & national groups: Grantee satisfaction from the city / national groups CBG program has increased from +28 to +65 NPS. We led a well-reviewed city / national groups retreat, had (on average) several calls each quarter with each CBG recipient, provided 8.3 FTE of funding, and supported hiring rounds in 9 locations.
- We shared more information about the concept of Highly Engaged EAs on CEA’s strategy page
Early-Stage University Groups Support
In Q3 we piloted a program that we now call the “University Groups Accelerator Program.” It is designed to help newer group organizers successfully launch a university group. The program involves regular calls, a sample semester schedule, resources and coaching for outreach (tabling, posters) as well as support running an intro fellowship and a stipend for organizers and funding for group expenses.
- Our fall pilot with 7 groups (Berkeley, Georgetown, Cornell, Carnegie Mellon, Georgia Institute of Technology, BYU Idaho, and Williams) was very successful. Despite it being a pilot it received an NPS of +75 and an LTR (likelihood to recommend) of 9.1.
- Groups we worked with helped 105 students complete a fellowship across 7 unis (average ~15 people a group)
- Several new organizers went on to be significantly engaged in the EA community - 1 took the GWWC pledge, 3 attended Lightcone’s winter program, and 1 attended Redwood’s MLAB.
- 30 groups (and more than 60 group organizers) joined the spring version of the program - including groups such as IIIT Delhi and the University of Hong Kong. We also had 12 mentors participate.
- We also accepted 7 interns for a “Summer Launch” Internship to provide the opportunity for committed organizers to work full time, with support, on their group or relevant meta projects over the summer.
- We started hiring for a University Groups Coordinator to add additional capacity to the team, help prepare incoming group organizers, and explore new areas for support.
The 2021 Q3 pilot program revealed several areas for improvement: decreasing frequency of meetings, streamlining funding, improving resource collation, and incorporating more mentors to meet demand.
Staffing:
- Jessica McCurdy - Scalable Uni Support (increased from part time to full time)
- Jesse Rothman - Broad Uni Groups Support Lead (joined part time)
City / National Groups Support
Activities:
- Rob, our city / national groups manager, ran a post-EAG London retreat for CBG group organizers. It had an NPS of +90 and an average LTR of 9.5.
- Rob has been encouraging group organizers to reach out with questions or for advice – he estimates he had 45 calls in Q4 and a similar number in Q1.
- We increased the default group expenses grant to $20,000
- We started providing more hands-on support for hiring rounds, and worked with local organizers to provide the following grants:
- Netherlands - 2 FTE (replacing individuals leaving)
- Israel - 1 FTE (additional hire)
- Norway - 1 FTE (operations hire)
- Germany - 0.5 FTE (operations hire)
- London - 1 FTE (additional hire)
- DC - 2 FTE (operations hire - expected to be short term; additional hire - as a 90 day trial)
- Czechia - 0.7 FTE (additional hire)
- We’re also offering support with the ongoing hiring rounds for EA Israel, EA France, EA Sweden, EA NYC, EA Australia, EA Germany, EA DC, and EA India (tentatively EA Bangalore and EA Delhi).
Outputs:
- Overall NPS for CEA among city / national group grantees is +66.
- The fraction of highly-engaged EAs that have a funded group organizer in their city remained constant as in Q2 at (36%).
- Our internal analysis suggested that the impact of one of our strongest city / national groups (EA Israel) is comparable to the impact of one of our strong focus university groups (EA Oxford)
Broad Groups Support
Apart from the support listed above, we also maintained our broad support for group leaders, and responded to increased demand for support.
Data:
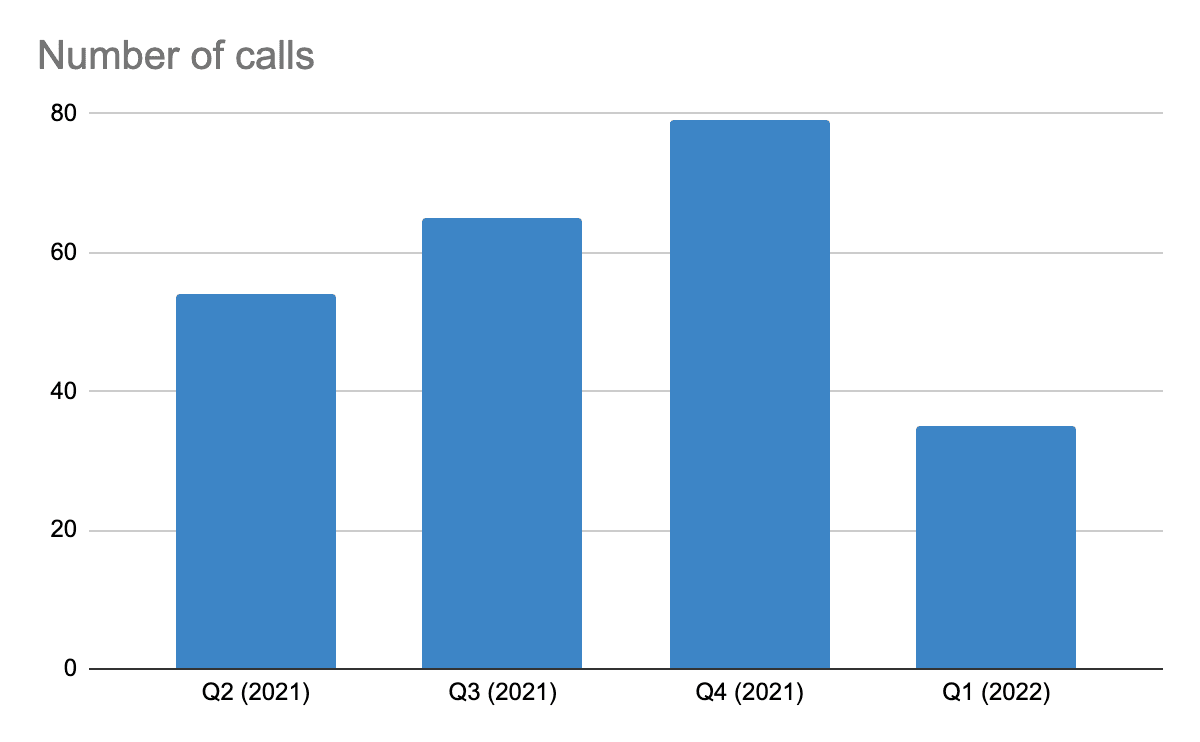
- We had around 79 calls in Q4 (vs. 65 in Q3 and 54 in Q2) and approximately 75 significant email / Slack exchanges with group leaders (vs. 125 in Q3). We received positive feedback on the calls (average likelihood to recommend of 9.8/10 in Q4 vs. 9.4/10 in Q3). We had around 35 calls and meetings in Q1 2022.
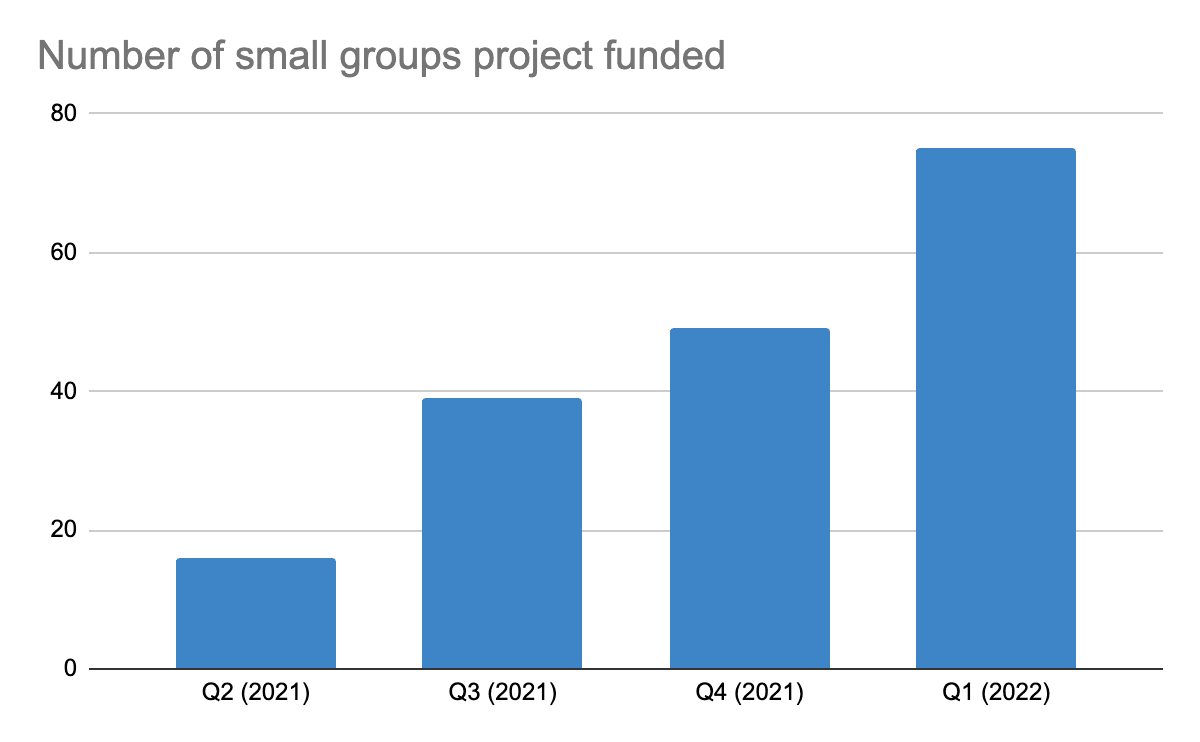
- We funded 49 small group projects in Q4, and 75 in Q1 2022 (e.g. for food, books, technology and event costs) (compared to 16 in Q2 and 39 in Q3).
Additional support activities:
- We launched a simplified basic groups funding application, including common group expenses guidelines (many fewer questions across all applications; rapid funding with a 1-3 day turnaround).
- Several organizers commented on how much easier the process is, however we still think there are interface improvements to be made.
- We migrated and updated our EA Groups Resource Centre
- We’ve heard positive feedback from organizers, but we would still like to further streamline and improve these resources.
- Jessica led a workshop session at EAG London 2021 on “Common Problems in University Groups” which had over 150 sign-ups.
- Marie Buhl (contractor) provided support to 10 group leaders running the Introductory EA Program. She also updated our fellowship advice page, worked to improve the findability of intro fellowship resources, and ran a user survey to prioritize improvements for 2022.
- We started upgrading our email and website support for groups, including helping groups use the Squarespace template (made by Sabrina Chwalek) to build websites.
Staffing:
- Brian Tan - Groups Support Contractor (joined as a part-time contractor)
- Catherine Low started splitting her time between Groups & Community Health
- Yi-Yang Chua (and EA Virtual Programs) moved from the Groups to the Online team
Appendix: Virtual programs
288 university participants went through Virtual Programs in Q4, compared to 255 in Q3 and 388 in Q2. We have two hypotheses about this high participation rate in Q2:
- Virtual Programs was launched in early 2021 and the increased attendance in Q2 was serving pent-up demand.
- COVID was still in full swing back in Q1 and Q2, so virtual programs were the preferred type of programming as compared to in-person ones. In Q3 & Q4, we think in-person programs might have met demand. For example, students were 83% of participants in the July - August round, but only 40-50% of participants in Q3 & Q4.
Key activities:
- Yi-Yang also focused on collecting attrition data, clarifying completion standards, and developing assessments of learning objectives.
- Attrition rates are hovering around ~30%.
- We’ve introduced a stricter version of completion (where people have to submit write-ups for missed attendance), and found the stricter completion rate is at around 20-55%.
- 40%-50% of participants in the introductory EA program scored 9 or above out of 10 multiple choice questions in the exit survey, indicating that concepts are being presented with reasonable fidelity.
Below are numbers for virtual programs participation.
Q4 '20 | Q1 2021 | Q2 2021 | Q3 2021 | Q4 2021 | |||||||||
| Type | Total | Focus unis | Non-focus unis | Total | Focus unis | Non-focus unis | Total | Focus unis | Non-focus unis | Total | Focus unis | Non-focus unis | Total |
| Intro fellowship | N/A | 46 | 256 | 302 | 21 | 224 | 245 | 37 | 110 | 147 | 12 | 139 | 151 |
In-Depth fellowship | N/A | 32 | 133 | 165 | 19 | 79 | 98 | 12 | 68 | 80 | 9 | 60 | 69 |
| Precipice reading group | N/A | No data on split. | 96 | 6 | 39 | 45 | 5 | 23 | 28 | 3 | 31 | 34 | |
| Legal Topics in EA | N/A | No data on split. | 59 | 0 | 0 | 0 | 0 | 0 | 0 | 16 | 18 | 34 | |
| Total | 0 | 78 | 389 | 622 | 46 | 342 | 388 | 54 | 201 | 255 | 40 | 248 | 288 |
Notes:
- All data is based on the number of people who started a fellowship in the listed quarter. Programs last for 8-10 weeks.
- The average completion rate for Virtual Programs is ~67% (defined as attending 7 out of 8 sessions).
Appendix: In person Intro Programs
Below are our estimated numbers for in-person programs.
Q4 '20 | Q1 2021 | Q2 2021 | Q3 2021 | Q4 2021 | |||||||||
| Type | Total | Focus unis | Non-focus unis | Total | Focus unis | Non-focus unis | Total | Focus unis | Non-focus unis | Total | Focus unis | Non-focus unis | Total |
| Intro fellowship | 250 | 150 | 230 | 380 | 41 | 73 | 114 | 315 | 403 | 718 | 214 | 77 | 291 |
| In-Depth fellowship | 60 | 40 | 40 | 80 | 23 | 19 | 42 | Very limited; summer | Very limited; summer | Not collected | Not collected | ||
| Total | 310 | 190 | 270 | 460 | 64 | 92 | 156 | 315 | 403 | 718 | 291 | ||
Notes:
- We expected more programs to start in Q3 as opposed to Q4 due to the nature of university scheduling.
- * Virtual Programs were formerly called fellowships. We changed the title to be more representative of the activity.