Comments
Summary
This post overviews, visualizes, and hypothesizes applications of five short-term impact evaluation methods: 1) pre-post, 2) simple difference, 3) difference in differences, 4) randomized controlled trial, and 5) regression discontinuity design. It can be used as a thought stimulating resource for persons interested in evaluating the cost-effectiveness of their and others’ programs.
Structure
Method
Compares: The values of the outcome metric that the method compares in order to estimate the program impact
Counterfactual estimate: The estimated value of the outcome metric or its change during the program in absence of the program
Assumption: Study validity requirement that is not validated by the method
Uses: Contexts where the method could be used
Examples: Hypothetical examples where the method can be applied
Methods
1. Pre-post
Compares: Participants’ metric values before and after the program
Counterfactual estimate: Zero change in participants’ metric values during the program
Assumption: Nothing would have influenced the participants’ observed metric in the absence of the program
Uses: Programs with unique outcomes and outputs
Examples:
- Health outcomes in areas where other than the program health specialists cannot operate and beneficiaries cannot travel
- Financial literacy changes after a short course uniquely providing these skills

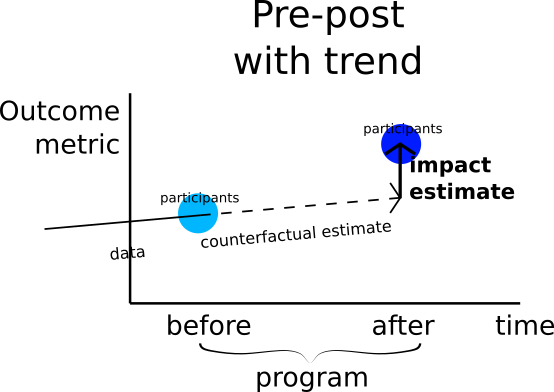
1.5 Pre-post with trend
Compares: Participants’ actual and extrapolated metric values (both) after the program
Counterfactual estimate: Participants’ metric value change based on the metric trend extrapolation
Assumption: The participants’ metric value trend continues during the course of the program
Uses: Programs with constant-trend impact metrics
Examples:
- Average distance to a clean water supply point in a region where tap water infrastructure has been improving steadily over a decade and substantial investment changes are unlikely
- HIV/AIDS incidence in an area where this incidence has constant growth and where an increased growth rate of the number or efficiency of organizations addressing this issue is unlikely
2. Simple difference
Compares: Participants’ and non-participants’ metric values after the program
Counterfactual estimate: Non-participants’ metric values after the program
Assumption: The metric value changes due to the program for participants and non-participants are comparable and secondly, participants’ and non-participants’ metric values before the program are equivalent
Uses: Studies of comparable analysis units (such as individuals or households) in constant situations
Examples:
- Chickens’ wellbeing on comparable farms with and without specific welfare improving measures
- Incomes of comparable extremely poor households in a poverty trap participating and not participating in a cash transfer program

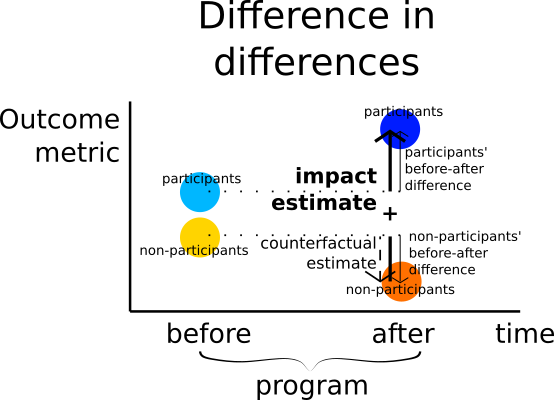
3. Difference in differences
Compares: Participants’ and non-participants’ before-after metric value differences, while participants and non-participants are not assigned randomly
Counterfactual estimate: Non-participants’ before-after metric value change
Assumption: Participants’ metric value would have changed the same as non-participants’ did
Uses: Analyses of comparable units in comparably changing situations
Examples:
- Education investments of comparable households participating and not participating in a pamphlet program in an area with a new radio program overviewing the importance of education
- COVID-19 prevention measures taken by individuals during the start of the pandemic participating and not participating in a radio program on COVID-19 prevention
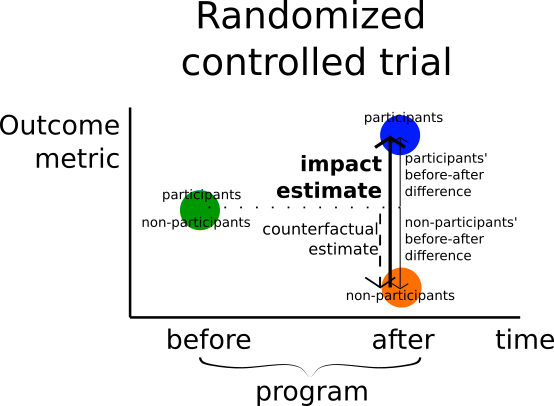
4. Randomized controlled trial
Compares: Participants’ and non-participants’ before-after metric value differences, while participants and non-participants are assigned randomly
Counterfactual estimate: Non-participants’ before-after metric value change
Assumption: Participants’ metric value would have changed the same as non-participants’ did
Uses: Analyses of diverse units in comparably changing situations
Examples:
- Revenue of different micro-enterprises (some of which participate in a revenue-increasing program and some of which do not) in a region with comparable growth of relevant economic opportunities
- Preventive healthcare measures taken by different households (some of which participate in a conditional cash transfer program and some of which do not) in an area with comparable preventive healthcare awareness programming
5. Regression discontinuity design
Compares: Non-participants’ metric value trend extrapolation and participants’ actual metric values around a program eligibility cutoff score
Counterfactual estimate: Metric value trend extrapolation of non-participants just below an eligibility cutoff score
Assumption: In absence of the program, the outcome trend of non-participants just below the program eligibility cutoff score would have continued to the eligibility scores of participants just above the cutoff score
Uses: Programs with an eligibility metric that influences the outcome
Examples:
- Attendance effects of a program for students below a certain test score level
- Healthcare-seeking behavior changes due to a program for patients above a certain distance from a clinic

Conclusion
A variety of quantitative methods can be used to evaluate programs’ short-term impact.
