TL;DR: I use a mathematical model to analyze prioritization when the potential size of a funding opportunity matters (i.e. its 'room for more funding'). I show how this relates to the ITN framework and I propose new prioritization components, including 'Scalability', as a clarification of Tractability, and two different types of 'Neglectedness'.
It would be nice if all we needed to know when prioritizing funding opportunities was their marginal value per dollar. In reality, funders always need to make two decisions: what to fund and how much.
Research, evaluation and execution takes time and effort. When we find a great opportunity we should be even more thrilled if we can put many dollars into it rather than just one. Scalability matters.
However, if we start throwing a lot of dollars at an opportunity then other funders are going to react. Coordination is hard and our dollars are likely to crowd out or 'funge' others. The extent to which this is an issue depends, among other things, on the Neglectedness of the opportunity.
These considerations, and others, arise when you think about the interaction of your funding decisions with others (i.e. as part of an 'equilibrium'). They are even more relevant when you have the ability to put so much funding into an opportunity that it changes the opportunity itself (i.e. is 'non-marginal').
In this post I share an equilibrium model that we have developed at the Total Portfolio Project (TPP) to account for these considerations. I'll refer to this as the "model". But, note that it's just one tool among many that we think is useful for reasoning about prioritization.
We developed this model out of necessity because of our goal to develop prioritization tools that work across a wide range of funding opportunities. And when size matters. Now, with the increasing wealth and ambitions of EA, it seems like these considerations are more relevant than ever to the community at large.
The goal of this post is to use math to precisely described the model. First, I review the ITN framework. Then I introduce the model and explain how its results compare to ITN.
See this post's twin for a version without the math and with more discussion.
Comments, questions and feedback are very welcome.
Basic setup and review of ITN
The model can be applied at the problem/area level and to individual enterprises (nonprofits and for profits). To be neutral, I refer to what is being assessed as the 'opportunity'.
Following Owen Cotton-Barratt (and 80,000 hours), I'll use the setup:
- I= Investment in the opportunity (of money or 'resources')
- A(I)= Activity level
- U(I)=gA(I)= 'Value of good done'
where g is the amount of 'value' produced per unit of activity.
Let I0 be the current level of investment and A0 the corresponding activity level. Then the marginal value per dollar of investment can be broken down as
∂U∂I=g∂A∂I=∂U%∂A%∂A%∂I%∂I∂I=gA0∗I0A0∂A∂I∗1I0
with %∂X=(∂X)/X. The component terms can be understood as
- Importance≡∂U%∂A=gA0
- Tractability≡%∂A%∂I=I0A0∂A∂I
- Neglectedness≡%∂I∂I=1I0
However, this ignores equilibrium effects. It also does not guide us on the size of investment to make.
Activity model
To make this analysis a bit more concrete and to allow for diminishing returns to scale, the model is defined by
∂A∂I=(1+I)−1η
with η>0 a parameter that determines the 'Scalability' of the activity. The higher the η, the more investment can be put into the activity while keeping the marginal return on investment high.
For η>1 and I>>1 this definition implies that
A(I)≈ηη−1Iη−1η
The marginal value per dollar of investment is then
∂U∂I≈gI−1η0
So, the ITN components are
- Importance=gA0
- Tractability=η−1η
- Neglectedness=1I0
Equilibrium model
As explained here, the equilibrium amount of investment will be determined by the intersection between the marginal value per dollar curve, V(I), and the marginal opportunity cost per dollar curve, C(I).
Our impact will depend on how much we can move these curves. What follows is a description of how this works. See this paper for more detailed derivations.
The model tells us what the equilibrium result of our participation in the market will be. It tells the size of funding we should plan to contribute. But, it does not tell us if participating is the optimal action we can take. We can only decide that by considering all our opportunities against each other.
With some opportunities, it may be better to leave them to the market and avoid crowding out others. For others, the amount of room for funding could be so small that its sadly not worth our time. But, there may also be some opportunities that have so much room for funding, at a reasonably high level of value per dollar, that pursuing them is a better use of resources than trying to pursue many smaller opportunities that appear more effective on the margin.
Note that the solution of the model uses many approximations, so care should be taken in the interpretation of the results (especially in extreme cases). That said, I think these approximations are useful to get a first-order understanding of the relevant considerations in equilibrium.
I'll label parameters that correspond to the market's initial beliefs with '0' and our beliefs with 'EA'.
The initial value curve, before our participation, is V(I)=g0∂A(I)∂I. g0 is the market's belief about the value produced per unit of activity. Because ∂A(I)∂I decreases with investment, the value curve will be downward sloping.
The initial cost curve is C(I)≈c0+s0W0A(I). c0 represents the market's opportunity cost per dollar. That is, the value the market would realize from investing in its marginal alternative (e.g. a benchmark charity, or an investing to give strategy). s0W0I represents 'risk-like costs' that increase with the volatility of the outcomes of the investment (by a single funder). As is standard in financial theory, these costs are expected to be inversely proportional to the initial wealth of the market, W0. γ0 is a constant that determines the slope of the cost curve.
The risk-like costs are labeled as such because in financial theory 'risk' (the volatility of the financial return) is the main such cost. The standard justification for financial risk aversion is the diminishing return to financial wealth. It is not clear that this should apply to altruistic value (e.g. because saving two lives is twice as good as saving one). For altruistic opportunities, the main 'risk-like' cost is more likely to be an increase in opportunity costs as more investment is removed from the marginal alternative. There may also be implicit costs for funder concentration or reputation risks.
Without 'risk-like' costs, the initial equilibrium investment level, would be
~I≈(g0c0)η
However, with 'risk-like' cost, the initial investment level will be
I0≈(g0c0(1+NR))η
where NR=s0W0~Iη−1ηc0 is the amount of 'risk-like' costs as a fraction of c0.
Our participation in the market will bring three potential changes. First, our beliefs about the value per unit activity, g, may be different from the market's. This is captured by the 'relative importance' or 'value neglectedness' fraction NV=gg0−1. Second, our basic opportunity costs (cEA). This is captured by the 'excess opportunity costs' fraction NK=cEAc0−1. Third, our wealth (WEA) and beliefs (sEA) about the costs of risks associated with the opportunity are also likely to differ from the market's.
There are two possibilities if we choose to enter the market for the opportunity. The market could decide our funding is too much and fully exit the opportunity. Or, because of 'risk-like' costs there could be a happy middle ground where our funding mixes with the market's. I'll focus on the latter case here.
In equilibrium, for small shifts, our participation will increase the scale of the value curve by a fraction of approximately Rsω0NV, where ω0=WEAW0+WEA and Rs=s0sEA. And, it will scale the cost curve by approximately Rsω0(NK−NR).
|
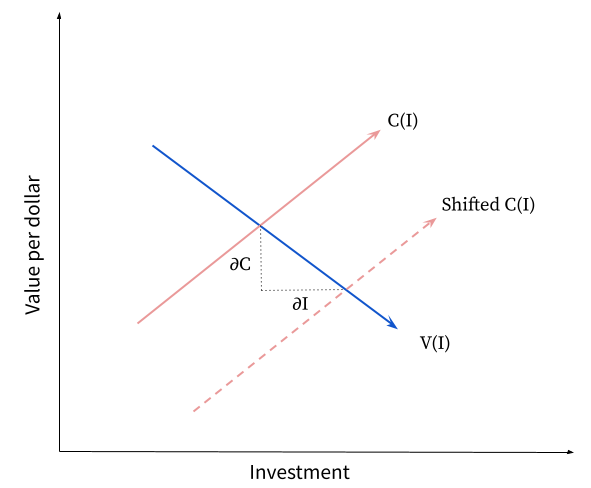 |
| This diagram shows how a local decrease in the cost curve leads to an increase in investment. The effect of a shift in the value curve is similar. |
This means that the expected net increase in investment as a result of our participation is
ΔI≈(g0(1+Rsω0NV)c0(1+NR+Rsω0(NK−NR)))η−I0≈I0∗η∗Rsω0(NV+NR−NK)
where the approximation will be most accurate for small values of NV, NR, and NK.
At the initial equilibrium point the value and cost curves intersect so that V(I0)=g0∂A(I)∂I=c0(1+NR)=C(I0). Assuming that the new equilibrium isn't too far from this point, our belief about the marginal value per dollar will be c0(1+NR)(1+NV), so the total gain in value will be
ΔU≈c0(1+NR)(1+NV)ΔI
However, the model also tells us that generating this increase in investment will require us to be a fraction
ωEA=ω0Rs(1+NV−NKNR)
of the total funding.
This means our total investment will be IEA=ωEA(I0+ΔI), and the amount of investment we will 'crowd out', or 'funge', is
ΔIF=IEA−ΔI
So when an opportunity is more risk constrained, with higher NR, the less funging there will be.
The total opportunity cost of our funding will be
CTotal≈CFixed+c0(1+NK+12NRRs)IEA−αc0(ΔIF+NR(1−12ΔIFI0)ΔIF)
where CFixed represents the fixed costs associated with the time and effort of evaluating and funding an opportunity.
c0(1+NK)IEA captures the basic opportunity cost of our investment and c02NRRsIEA represents the 'risk-like' costs borne by us. α reflects the alignment of the market. That is, it controls how much we value the alternative use of the funding we crowd out and how much we value reducing the 'risk-like' costs of the other funders in the market.
In principle, any opportunity where ΔU−CTotal>0 is worth doing. However, in practice it will only be possible to do a small subset of all the positive net value opportunities. In general, choosing which combination of opportunities creates the most value together is a hard combinatorial problem. But, one simple way to proceed is to choose the opportunity with the highest ΔU−CTotal.
The value of ΔU−CTotal will clearly depend on many factors including the alignment parameters. Here I'll just consider a few illustrative cases.
Case with general alignment
First, if the market is fully aligned (α=1) and we have the same beliefs and costs (NK=0), and fixed costs are minimal Cfixed≈0, then
CTotal≈c0ΔI+c012NR(ΔI−ΔIF)≈c0ΔI
So the ratio of impact value to opportunity costs will be
ΔUCT≈(1+NV)(1+NR)
which is simply the ratio of the marginal value per investment dollar at I0 to the basic opportunity cost per dollar. So, in terms of the marginal value per dollar cost, this case reduces to the same context as that of ITN.
For small NR, the net value created reduces to
ΔU−CT≈c0∗η∗I0∗N2V≈η∗gη−20(g−g0)2cη−10
Consider a range of opportunities with similar c0≈1. This will apply to most major opportunities that are well known and available to the market at large in a low interest rate environment.
Let's focus on the case where we are still uncertain about g−g0. That is, say we know c0 and g0 and believe that the distribution of what we will think g−g0 is after we spend time evaluating it has mean μΔg and variance σ2Δg.
Then, in choosing what subset of opportunities to prioritize for in-depth assessment, we want to maximize E[ηgη−20(g−g0)2|g0]=ηgη−20(μ2Δg+σ2Δg). For this to be increasing with g0 we need μ2Δg+σ2Δg>1ηgη−20.
As long as the process that leads our assessment of g to differ from g0 is somewhat independent from the level of g0, then this condition would seem easier to satisfy for sets of opportunities with high g0 and high η.
Also, in this context of choosing which set of opportunities to evaluate, we should prefer sets with higher σ2Δg, all else equal. One way to put this is that such sets have higher 'option value'.
Case with high fixed costs
Second, suppose fixed costs dominate. For example, this may be the case if, for operational reasons, there is only a fixed number of opportunities that we can fund per year. In this case we really only care about maximizing ΔU. Removing the factor of WEA from ΔU because this is constant, we want to maximize:
ΔUWEA≈c0(1+NR)(1+NV)ηI0W0(NV+NR−NK)Rs
Case with financial value
Suppose the value generated per unit activity includes financial value that is a fraction f of the value there market sees. This makes the calculations of value changes different, because unlike with impact value (which is a public good), with financial value we care who it goes to. Before we invest we only regard this financial value as valuable if the others in the market are aligned. If they're not aligned and we do invest then acquiring this financial value can offset our opportunity costs.
The overall result is that α in the formula for CTotal should be replaced by
α′=α∗(1−f)+f.
If f=1, so that market only sees financial value, then α′=1. This is the same as for full alignment with no financial value (α=1,f=0). So we can say that financial value generated effects similar to alignment.
Decomposition
Focusing on the case with high fixed costs, a natural decomposition of ΔUWEA, is:
-
Baseline Effectiveness≡c0
-
Scalability≡η
-
Conviction≡I0W0
-
Neglectedness≡(1+NR)(1+NV)(NV+NR−NK), with components:
-
Relative risk appetite≡Rs
There are several motivations for this decomposition.
First, 'Scalability' really does seem like an appropriate name for η ('Tractability' is a better match to g). Second, 'Baseline effectiveness' seems like a component that should be fairly intuitive to assess based on the reputations of other funders. Third, I think it is a good idea to aim for these components to be dimensionless if possible. This seems like a useful heuristic for making the components relatively independent from each other (e.g. ITN's neglectedness being '1/$' and Importance being '$' creates endogenous correlations that seem to cause confusion in practice). Fourth, 'Conviction' seems like a more appropriate name for this component (whereas the closest ITN equivalent is Neglectedness) as it shows how effectively the opportunity has converted the wealth of its funders into investment. Conditional on the baseline effectiveness of these other funders, this is a good thing as it shows that the opportunity has scaled well so far. It indicates they are more likely to continue to fund it and not be funged. Fifth, with complex things, breaking them down into more granular parts can make them more tractable - hence the components of Neglectedness (plus 'Conviction').
Please see this twin post for more discussion of the components.