Comments
56

This essay was submitted to Open Philanthropy's Cause Exploration Prizes contest.
If you're seeing this in summer 2022, we'll be posting many submissions in a short period. If you want to stop seeing them so often, apply a filter for the appropriate tag!
The challenge as we see it lies in the fact that most current measures, including those used by Open Philanthropy, are unable to access individual and community understandings of positive change because they are constructed by outsiders and, for the most part, elites. Mainstream approaches to measurement define ‘hard to measure states’, such as discrimination, justice or freedom, according to external, researcher-driven criteria rather than the perspectives and experiences of the researched. While a wide variety of research topics might lend themselves to top-down measurement, the omission of the perspective of those furthest from sources of power and funding is particularly problematic in matters of social justice. Indeed, there is general consensus among many scholars that there are significant limitations to the top-down indicators currently used to measure a wide range of social concepts (Gleditsch, Petter, Nordkvelle, Jonas, Strand, Håvard 2014; Kelley and Simmons 2019; Merry 2016a; T Brück, P Justino, P Verwimp, A Avdeenko, A Tedesco 2016; Firchow 2018). The limitations of externally developed indicators can be summarized as follows:
Research in complex contexts is left with a gap between externally-derived, globally-focused quantitative datasets driven by universal indicators on the one hand and locally-specific, often qualitative insights on the other. The Everyday Peace Indicators (EPI) research program seeks to bridge externally and internally derived measurement systems and provide tools for the systematic collection of community-generated data that are complementary to more traditional sources of data on difficult to define social concepts like peace. The EPI process is an inductive, participatory approach to the generation of indicators to define and assess difficult-to-measure concepts such as peace, justice or safety. Taking its cue from studies in sustainable development, this approach asks community members to identify their own measures of peace, and other difficult to define concepts, based on the premise that local communities are best placed to identify changes in their own circumstances, rather than relying on external ‘experts’ to identify indicators for them. The EPI methodology fundamentally rethinks how definition and measurement happen in practice, opening up the “black box” of indicator construction to question the very notion of expertise and acknowledging the power dynamics inculcated in the research endeavor of establishing expertise for marginalized populations.
The central innovation of the EPI methodology entails a fundamental rethinking of concept formation, which is a key step in the measurement process. As explained in more detail below, in the EPI methodology, indicators are identified by community members themselves. Using our systematic methodology that has been developed over 10 years and used in over a dozen countries including the United States, EPI can help flip top-down narratives and logics, and feed local voices into policy processes and Design, Monitoring and Evaluation. Community-sourced indicators can help bring bottom-up concerns to the fore, and identify the extent to which beneficiaries and target groups are satisfied with programing. It is a way of making Monitoring and Evaluation more responsive to outcomes rather than outputs, and injecting more vernacular language and thinking into processes that might be overly technocratic and removed from on-the-ground concerns.
Because social scientists have to define concepts in order to study empirical relationships, decisions need to be made about how to operationalize them in order to make systematic observations. Generally, the first step in this process is for the researcher to develop, or use an already established, systematic definition of the concept in light of the goals of the research and then move on to its operationalization, in which concrete indicators are identified. Therefore, getting from concept to concrete observations is a process that requires the specification of indicators often before empirical research has been conducted. The common work-flow of many research processes means that when researchers conceptualize their variables, they tend to do so based on established concepts, in contexts removed from the research site, and sometimes with minimal consultation with the researched. Of course, much research design is more complex than the linear model outlined above. For example, scholars may have conducted prior fieldwork in a research site and be acquainted with the context, or they may use focus groups to vet survey questions they intend to use. For the most part, however, research categories, concepts and indicators are often established early in the research process and with minimal, if any, input from the researched leading to questions of representation, power and positionality in the measurement endeavor.
The Everyday Peace Indicators methodology seeks to disrupt traditional views of expertise and prioritizes local technical knowledge in the conceptualization process. We built the EPI methodology and tested it in pilots in villages and neighborhoods in sub-Saharan Africa. We have since implemented it in a number of other conflict-affected localities, including in the United States, Colombia, Afghanistan, Sri Lanka and Bosnia Herzegovina, among others. In its first instance, the Everyday Peace Indicators project sought to pilot a robust bottom-up methodology that could capture locally sourced data from communities that have experienced conflict and authoritarianism. We drew inspiration from literature in development studies on participatory ways of conducting research (Krimerman 2001; McIntyre 2007), as well as ‘the local turn’ in peace and conflict studies (Autesserre 2010; Mac Ginty and Richmond 2013; Paffenholz 2015). The ‘local turn’ is an on-going attempt to understand better what constitutes ‘the local’ and harness local perspectives more usefully in peacemaking and peacebuilding (Mac Ginty 2015). It resonates strongly with the idea of ‘participatory numbers’ developed by Robert Chambers, which uses participatory action research to generate more accurate quantitative measures. The EPI research program is based on a two-fold epistemological humility that firstly recognizes that local communities are often best-placed to identify changes in their own justice, peace and freedom or wellbeing and that, secondly, external researchers often lack the knowledge to understand local experience. In the EPI methodology, communities can help shape the tools used for measurement.
The EPI methodological process is part of the domain of collaborative research whereby the researched can provide substantial input throughout the research process, including research design (Firchow and Gellman 2021). In particular, EPI regards itself as contributing to the field of participatory statistics[1] and bottom-up approaches to measurement that seek to allow everyday individuals to participate in the generation of quantitative data. The participation of individuals in the production of participatory statistics can happen in many ways, including data collection itself, but fundamentally changes the power dynamic between the researcher and researched by allowing those we are saying something about to be involved in decisions surrounding the data collection tools we create.
A small movement toward quantitative participatory data collection started in the sustainable development community in the 1990s (Chambers 2007) and continues to be utilized and refined in the development community (Gaillard et al. 2016; Holland 2013). It emerged because development scholars recognized that there was a need to understand the multi-dimensionality of livelihoods and poverty. The development of participatory statistics-related methods allowed them to attribute value to dimensions of people’s everyday lives that were usually only qualitatively understood (Gaillard et al. 2016, 1001). Done correctly, participatory statistics have the potential to bring researchers and the researched together on more equal terms to collaborate together to produce more valid tools for measurement than traditional top-down measurement tools (Firchow 2018). Participatory statistics allow for some of the power imbalances in quantitative measurement to be recalibrated so that numbers reflect local priorities and everyday people serve as more than data sources in research studies.
The EPI process involves six stages and entails a series of collaborative data collection and verification activities working with communities and everyday people. We have honed this methodology over ten years and built a rigorous approach to developing community generated indicators. Group facilitation and debriefing activities are employed from beginning to end to build rapport and generate a safe, respectful, and open communication dynamic between participants, our team members and the community or group we are working with.
The Everyday Peace Indicators project has so far been tasked with investigating peace and cognate social processes including reconciliation, wellbeing, coexistence, and justice. On occasion, the EPI process has also been used to explore more policy-oriented concepts such as “violent extremism”, “community safety”, and “community wellbeing”. Stage one of the EPI process, concept selection, requires discussion with community stakeholders – often partner non-governmental organizations with roots in the community. As discussed previously, in many research models, concepts are derived externally and without consultation with the researched. Terms like ‘peace’ or ‘reconciliation’ may have politicized connotations and may be inappropriate in particular settings. Thus, a key test in concept selection is the social acceptability of the concept or whether another phrasing is advisable.
In the second stage, communities are defined and selected to carry out the indicator generation and measurement process. In the EPI process, the idea of “community” often, but not always, maps onto geographic areas. In rural settings, this tends to be easier, where communities are akin to villages or a small town. In urban settings, they may be neighborhoods, blocks, or areas defined by city parks. Yet, they may also be groups like church associations, indigenous groups, youth groups, victims of particular forms of violence, or groups who have interacted with the state in particular ways (for example, communities of youth impacted by the criminal justice system). The key is that the group share some sort of everyday lived reality, which can be accessed through the subsequent stages below. This works best with smaller groups of a couple thousand at most. The process of community definition can be deceptively simple and requires careful and critical thought, in conjunction with local actors, about what and who the everyday indicators should be representative of.
In the third stage, community or group members generate indicators through focus-group discussions. The key concept or concepts being studied are used to start a conversation with a selected group of community participants using a standard question: “what tangible signs do you look to determine whether there is more or less peace (or cognate social process) in your everyday life?” In these focus groups, community members discuss the signs they use and look for in their communities to judge whether or not they are more or less peaceful (similar guiding themes are discussed for the relevant overarching concept to each process). Participants discuss questions such as ‘What factors do you look to in your daily life to determine whether you are more or less at peace?’ and ‘What does peace mean to you in your community?’. Indicators generated in this stage represent context-specific ways in which community members see peace happening around them and through their daily interactions. The facilitator uses probing questions to guide the discussion from more abstract and general notions to more concrete and specific indicators that are more amenable to counting and other forms of measurement. These discussions are conducted with separate groups according to the dynamics of the community and the concept being assessed, such as separate groups of men, women, young men and young women. At the end of this stage, the lead researchers work with the local researchers, who help with contextual knowledge, to extract a long list of indicators from the transcripts and notes of the focus group discussions.
A two-step indicator-verification process wherein community members cull the long list of indicators into a short list comprises the fourth stage. First, the field research team presents the long list of indicators to representatives of the original focus groups during a verification focus group. In this group, the participants reassess their lists and eliminate or add indicators, as well as clarify any discrepancies presented by the facilitators. Next, the researchers invite the community at large to join the original focus group participants in a larger indicator-verification and voting meeting where each participant casts a predetermined number (usually 15) of votes for their top daily indicators. This final exercise is a rigorous ranking and vetting of indicators resulting in a short list of indicators that are most representative of the community.
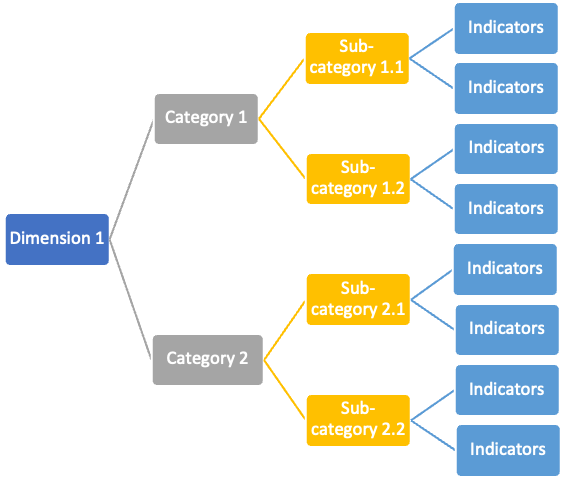
Across the EPI Program, we have developed a coding framework that combines inductive and deductive processes to categorize the multiple indicators produced in stages 3 and 4 described above.[2] Within each research project, we begin by inductively developing a codebook in collaboration with the local research team. This coding scheme groups indicators into sub-categories, which in turn, are aggregated into more general categories (see Figure 1). Since indicators often span multiple conceptual categories, we allow each indicator up to three categories during our inductive coding process. While each community has its own unique set of indicators that are unique to its particular context and social dynamics, the coding framework allows for developing comparisons between communities and regions. This analysis can shed light on shared categories across different places and groups – for example, multiple communities might mention indicators related to education or conflict resolution or good relations or how one community may prioritize security over development when defining their everyday peace. All results are weighted by each indicator’s “importance score”, a calculation that weighs each indicator according to its relative importance to the community, based on votes and normalized across communities.[3] In addition, each project’s general categories can be placed into one of six dimensions that are common across all projects in the research program. At this highest level of abstraction, our deductively-developed dimensions characterize common general themes across different post-conflict and peace processes, and therefore, allow us to draw comparisons between communities across the countries where we gather data.
Figure 1: Inductive and Deductive Coding Process
Finally, in stage five, the everyday indicators can be used as the basis of measurement strategies, including longitudinal assessment. There are a number of ways to measure indicators, some more participatory than others. For example, we have employed participatory photography as a means to allow community members to represent their indicators in visual form. Generally, however, we have relied on population surveys that are representative at the community level for this step. To generate our survey data, we employ indicators selected from each community’s short list of verified indicators that are representative of the concepts and dimensions of interest. Research team members employ a random sampling strategy to survey households within the communities and individuals within selected households. The response rates are typically quite high to these questionnaires since surveys in each locality are conducted by local fieldworkers guided by a lead researcher using mobile phone applications. In addition to the everyday indicators, which are rated on a five-point Likert scale, the surveys include socio-demographic questions as well as questions about involvement in and knowledge of peacebuilding interventions in the community. These survey data allow us to assess individuals’ perceptions according to community-generated indicators of the concept. These surveys can be combined with more qualitative assessments of the indicators or repeated to longitudinally track change over time, depending on the research goals.
EPI provides potential usage beyond scholarly research and has broad applicability for policy engagement, evaluation and programming. Here we present three possible forms of engagement: community mobilization, monitoring & evaluation, and advocacy. Across these three, we are keenly interested in identifying the conditions and mechanisms that give everyday indicators actual policy relevance. We see scholarly and applied goals not as an either/or choice, but as poles that orient a range of options that can meet both research and practice-oriented goals simultaneously.
We have published elsewhere how our data have been combined with participatory photography or photovoice to effectively engage communities and local policymakers to mobilize for change (Fairey, Firchow, and Dixon 2022; Firchow, Fairey, and Selim 2021). We designed the EPI photovoice process to enable local ownership and to support community driven action and change without any pre-defined objectives as to what form that might take. We found that our EPI photovoice workshops catalyzed unexpected community-level action and made our research less extractive. These outcomes coalesced around the collective indicator stories that were selected by the photovoice groups, which were some of the indicators that garnered the highest number of votes during the EPI indicator verification phase.
For example, we conducted photovoice and EPI in our Everyday Justice project in Colombia. Established at the end of the 19th century, San José de Urama was partially destroyed and unoccupied during the war. The state of cemetery which had become overgrown and fallen into disrepair was a source of great concern to the community. In the photovoice workshop, the Urama group selected “The community maintains the cemetery with the support of the church and the JAC” as an indicator on which to focus. They made an extended photo story cataloguing the dilapidation of the cemetery. In their textual description, they noted that “the deterioration of the sacred burial ground is evidence of the forgetting of our dead. The weeds devour the tombs just as the mind erases memories.” After going out to document the decay as part of their work with us, the group independently decided that they wanted to do something about it. They convened a work party, and over two days a group of 80 community members from across the village transformed the cemetery, clearing the vegetation, re-painting structures and making repairs (Fairey, Firchow, and Dixon 2022; Firchow, Fairey, and Selim 2021).
EPI has also been effective as a diagnostic, monitoring and evaluation tool (Firchow 2018) since localization has become an increasingly popular strategic direction across the international development, humanitarian, and peacebuilding sectors. Engagement with local communities in consultative processes is essential to bridge socioeconomic disparities in human rights restrictive environments (Firchow, Pamina and Tilton, Zach 2020). Similar to challenges encountered by researchers using indicators in their scholarship, the applied tools for measuring impact in such environments are generally pre-determined in the proposal phase by donors and implementers, often solely using standard top-down indicators to signal change. By socializing program indicators with community members, implementers can provide nuanced examples that contextualize the complexity of key concepts that are ingrained into peacebuilding programming, such as good governance, peaceful coexistence, and effective justice systems. Such community-generated indicators provide a useful complement to existing monitoring and evaluation indices, such as the US Government F-Indicators, which typically examine change at a macro level. Here we have many projects in collaboration with a variety of agencies such as USAID, USIP, FCDO, IAF, Humanity United, Search for Common Ground and the State Department working around the world in places like Colombia, Sri Lanka and Bosnia-Herzegovina, as well as with the University of California Berkeley working to examine indicators of wellbeing and safety to inform police reform in Oakland.
Our data can also be used for advocacy purposes to lobby policymakers to integrate changes in policies based on community needs and priorities. Another example comes from San José de Urama. While overall quality of life there has improved significantly since the war, a number of negative indicators of both coexistence and justice spoke to the challenges it still faces. In particular, the persistent presence of trash on the town’s streets was selected as a particularly strong and relevant indicator of the town’s lack of coexistence (Vera-Adrianzén, et al. 2020). This single indicator received the highest number of votes over all the other 68 coexistence indicators, resulting in an “importance score” almost four times the average. Trash, we were told, reflected the weaknesses of Urama’s social structures wrought by war and the continued presence of armed groups. Thus, to really begin to understand how to attend to the residual problems of the war, the community needed to attend to issues that are not immediately connected to the harms caused during war, such as trash. In the case of Urama, the community members were able to organize around this issue when it emerged as an issue of importance through the EPI process. This allowed leaders to advocate on behalf of the community vis-à-vis local policymakers to resolve the problem. This is a local example of how the EPIs can be used as an advocacy tool to advocate for policy change on behalf of communities.
Many other examples exist that can address issues of local importance at regional, national and international policy levels. Indeed, in our current work in Oakland, CA, many of the community-based organizations with which we have partnered were drawn to the work precisely because of EPI’s potential as an advocacy tool. As a community-centered research process, there is also advocacy potential in the EPI process in the types of relationships that can be developed between research team and research subject. In our work, these range from thin to thick: on the thinner end, we hire, train, and manage our own research teams; on the thicker end, we directly engage community-based organizations with established community ties; in between is a model where independently managed research teams work with local political structures. Each offers unique opportunities to channel the indicators into existing advocacy efforts or create new ones. For example, the EPI team in California is currently testing the utility of everyday indicators developed in partnership with local groups to inform their grant applications and evaluate public safety policy developed by the city.
Open Philanthropy (OP) approaches measurement from a more externally, expert-led approach with measures guiding funding before beneficiaries are identified. Although this is a potentially effective approach in concrete areas of social engagement such as health and agriculture, universal, top-down measurement approaches are less effective when dealing with softer and more difficult to define concepts such as wellbeing, freedom or discrimination, especially in complex contexts. EPI offers OP the possibility of flipping the power dynamic when it comes to funding work on empowerment, freedom, injustice or discrimination, allowing OP to demonstrate its acknowledgement of the inherent power dynamics in the funding process itself.
Among the unconsidered costs of OP’s standard approach to measurement is the potential negative impact that the exclusion of local voices and perspectives may have on the local, beneficiary population. The fact that beneficiary populations are often excluded from measurement and intervention design processes can serve as alienating and disempowering negative impacts for the very population intended to benefit from such endeavors. Contrastingly, through allowing beneficiaries to define standards of measurement and influence intervention design at each stage of the process, EPI attends to the power dynamics within the measurement process itself, in addition to the intended research and evaluation outcomes.
A key benefit of EPI’s systems of measurement for OP is that EPI can produce accurate and meaningful data through its representative and bottom-up method of elevating local perspectives. The cultivation of this kind of approach would allow OP to be impactful in its engagement of marginalized communities. In terms of general principles for analyzing indirect, long-term effects that would improve OP’s grantmaking, EPI proposes that indirect, long-term effects be analyzed through a lens that is designed by the beneficiary population and tailored to specific contextual needs.
Autesserre, Séverine. 2010. The Trouble with the Congo : Local Violence and the Failure of International Peacebuilding. Cambridge: Cambridge University Press. https://libproxy.unm.edu/login?url=https://search.ebscohost.com/login.aspx?direct=true&db=e000xna&AN=344660&site=ehost-live&scope=site (May 6, 2021).
Chambers, Robert. 2007. Who Counts? The Quiet Revolution of Participation and Numbers. Institute of Development Studies (UK). https://opendocs.ids.ac.uk/opendocs/handle/20.500.12413/398 (February 2, 2021).
Fairey, Tiffany, Pamina Firchow, and Peter Dixon. 2022. “Indicators and Images: Integrating Visual and Non-Visual Participatory Methods to Amplify Community Voices.”
Firchow, Pamina. 2018. Reclaiming Everyday Peace: Local Voices in Measurement and Evaluation After War. Cambridge University Press.
Firchow, Pamina, Tiffany Fairey, and Yvette Selim. 2021. “How Photography Can Build Peace and Justice in War-Torn Communities.” The Conversation. http://theconversation.com/how-photography-can-build-peace-and-justice-in-war-torn-communities-166143 (January 5, 2022).
Firchow, Pamina, and Mneesha Gellman. 2021. “Collaborative Methodologies: Why, How, and for Whom?” PS: Political Science & Politics: 1–5. https://www.cambridge.org/core/journals/ps-political-science-and-politics/article/abs/collaborative-methodologies-why-how-and-for-whom/47119783BC9A65C407E9C9B7FD3072A7 (June 3, 2021).
Firchow, Pamina, and Tilton, Zach. 2020. “Chapter 7:Everyday Peace Indicators: Renegotiating Rigor for Peacebuilding Evidence.” In D’Estrée, T. P. New Directions in Peacebuilding Evaluation., Rowman & Littlefield.
Gaillard, J. C. et al. 2016. “Participatory Numbers for Integrating Knowledge and Actions in Development.” Development in Practice 26(8): 998–1012. https://doi.org/10.1080/09614524.2016.1226263 (February 9, 2021).
Gleditsch, Petter, Nordkvelle, Jonas, Strand, Håvard. 2014. “Peace Research – Just the Study of War? - Nils Petter Gleditsch, Jonas Nordkvelle, Håvard Strand, 2014.” 51(2): 145–58. https://journals.sagepub.com/doi/full/10.1177/0022343313514074 (October 23, 2021).
Holland, Jeremy. 2013. Who Counts?: The Power of Participatory Statistics. Practical Action Pub.
Kelley, Judith G., and Beth A. Simmons. 2019. “Introduction: The Power of Global Performance Indicators.” International Organization 73(3): 491–510. https://www.cambridge.org/core/journals/international-organization/article/introduction-the-power-of-global-performance-indicators/FBDC8E69ED8A0200B0BADE65F50A4085 (May 6, 2021).
Krimerman, Leonard. 2001. “Participatory Action Research: Should Social Inquiry Be Conducted Democratically?” Philosophy of the Social Sciences 31(1): 60–82. https://doi.org/10.1177/004839310103100104 (April 1, 2022).
Mac Ginty, Roger. 2015. “Where Is the Local? Critical Localism and Peacebuilding.” Third World Quarterly 36(5): 840–56. https://doi.org/10.1080/01436597.2015.1045482 (April 1, 2022).
Mac Ginty, Roger, and Oliver P Richmond. 2013. “The Local Turn in Peace Building: A Critical Agenda for Peace.” Third World Quarterly 34(5): 763–83. https://doi.org/10.1080/01436597.2013.800750 (October 23, 2021).
McIntyre, Alice. 2007. Participatory Action Research. SAGE Publications.
Merry, Sally Engle. 2016. The Seductions of Quantification: Measuring Human Rights, Gender Violence, and Sex Trafficking. University of Chicago Press.
Paffenholz, Thania. 2015. “Unpacking the Local Turn in Peacebuilding: A Critical Assessment towards an Agenda for Future Research.” Third World Quarterly 36(5): 857–74. https://doi.org/10.1080/01436597.2015.1029908 (October 23, 2021).
T Brück, P Justino, P Verwimp, A Avdeenko, A Tedesco. 2016. “Measuring Violent Conflict in Micro-Level Surveys: Current Practices and Methodological Challenges.” The World Bank Research Observer 31(1): 29–58. https://scholar.google.com/citations?view_op=view_citation&hl=en&user=LTYFYPAAAAAJ&citation_for_view=LTYFYPAAAAAJ:h0mLeC6b6wcC (October 23, 2021).
Vera-Adrianzén, Fiorella et al. 2020. “Trash Is Piling Up in Rural Colombia—That’s a Bad Sign for Peace.” Political Violence at a Glance. https://politicalviolenceataglance.org/2020/07/02/trash-is-piling-up-in-rural-colombia-thats-a-bad-sign-for-peace/ (April 1, 2022).
Sometimes referred to as participatory numbers
Codebooks are available on our website: https://www.everydaypeaceindicators.org/codebooks-and-data
This score is based on the number of votes an indicator gets times the total number of indicators being voted on in that community, divided by the total number of votes cast in that community. This provides us with a standard score that can be compared across communities.
