Introduction
In the World Malaria Report 2022, WHO estimated that in 2021 there were 247,430,170 cases of malaria[1], resulting in 618,975 deaths. This post is a high-level description of how they arrived at these figures[2]. This method is used by WHO for all estimates from 2000 to present but the exact details and models are updated annually and applied retroactively (see Appendix). I will be referring specifically to the 2021 estimates.
Malaria cases and mortality were estimated for the 108 countries that were endemic in the year 2000. For each of these countries, one of three methods were used to estimate cases[3]:
- Direct
- Surveillance
- Cartographic
And one of three methods were used to estimate mortality:
- Direct
- Case Fatality Rate (CFR)
- Cause of Death (CoD)
Countries that were modelled for cases using the cartographic method were typically modelled for mortality using the CoD method:
| COUNTRY COUNT | Mortality Method | |||
| Direct | CFR | CoD | ||
| Case Method | Direct | 36 | 3 | 0 |
| Surveillance | 6 | 29 | 4 | |
| Cartographic | 0 | 2 | 28 | |
And were the countries that accounted for the majority of the malaria burden:
| MORTALITY % | Mortality Method | |||
| Direct | CFR | CoD | ||
| Case Method | Direct | 0.01 | 0.02 | 0.00 |
| Surveillance | 0.01 | 5.94 | 1.52 | |
| Cartographic | 0.00 | 1.66 | 90.83 | |
Counting via Direct Methods (both cases and mortality)
This was used for countries with robust reporting systems, and zero to very low malaria endemicity. It is very straight-forward. National malaria programs reported the data and WHO made no adjustments.
Estimating Cases
Surveillance Method
This was used for countries with reasonable reporting quality and low endemicity, typically outside of Africa however there were some exceptions.[4] Adjustments to reported case figures were made to account for:
- Proportion of suspected cases with parasitaemia. Some cases are treated as malaria without a test to confirm, and so these cases were multiplied by the positivity rate of those cases that were tested.
- Proportion of population seeking treatment from the private sector, since national malaria programs typically only track cases via the public sector.
- Proportion of population not seeking treatment.
- Reporting completeness.
- Ad hoc adjustments, such as perceived effect of COVID-19 on the above and other variables[5].
Cartographic Method
This was used for countries with particularly poor reporting of clinical incidence, due to high endemicity and/or inadequate reporting systems in general. All 30 of these countries are in sub-Saharan Africa[6].
Malaria Atlas Project (MAP) provided these estimates. Despite inadequate records of clinical incidence, surveys of parasite prevalence in these regions are particularly frequent and widespread. MAP estimates a standardised measure of P. falciparum prevalence (PfPR2-10) from these surveys[7]. They then use data pertaining to the local environment, malaria control interventions, and mosquito and human habits to predict average PfPR2-10 annually for every 5x5km pixel square[8]. A further model[9] is used to estimate clinical incidence across all ages (grouped 0-5 year old, 5-15 year old and >15 year old) given PfPR2-10, the seasonality of transmission, and historical treatment/exposure[10].
P. vivax prevalence and clinical incidence were predicted from taking P. falciparum predictions and applying reported proportions of P. vivax to P. falciparum cases[11]. In the WHO African Region, this proportion was just 0.3%[12] so I did not review this process.
As with the surveillance method, adjustments have been made based on perceived effects of COVID-19.
Estimating Mortality
Case Fatality Rate (CFR) Method
This was used for countries with relatively low endemicity, but where reporting is not complete enough to directly count figures. It was mostly used for countries outside of Africa however there are some exceptions.[13]
For overall mortality, case fatality rates of 0.256% and 0.0375% were applied to the estimated cases of P. falciparum and P. vivax, respectively. These rates are averages/midpoints in relevant literature.[14]
Separately, they estimated what proportion of these fatalities are children under five using the function[15]:
Proportion of deathsunder 5 = –0.2288 × Mortalityoverall2 + 0.823 × Mortalityoverall + 0.2239
where Mortalityoverall is the overall mortality estimate for every 1000 of the population at risk.[16]
WHO made no mention of adjustments due to COVID disruptions. This might be due to the effect being covered in making the case estimates, to which CFRs are applied.
Cause of Death (CoD) Method
This was used for countries where a high proportion of deaths are due to malaria. All 32 of these countries are in sub-Saharan Africa[17] and as stated previously around 90% of global estimated mortality is derived from this method.
First, WHO estimated under-five mortality using a model that took CoD studies and official registries to infer, at a country-level and for the years 2000-2019, what fraction of deaths under five were due to various causes.[18] They then applied these 2019 malaria proportions to separate UN country-level estimates of overall child mortality in 2021, to arrive at the country-level estimates for under-five mortality.
They then used the following function to estimate what proportion of deaths are of over five year olds, and applied it to estimated under-five fatalities to estimate over-five fatalities[15]:
Proportion of deathsover 5 = –0.293 × Mortalityunder 52 + 0.8918 × Mortalityunder 5 + 0.2896
where Mortalityunder 5 is the under-five mortality estimate for every 1000 of the population at risk.[16]
For the impact of COVID-19 disruptions, WHO again depended upon some MAP modelling. MAP provided mortality estimates, with and without diagnosis and treatment disruptions,[19] and the relative increase in mortality MAP predicted due to the disruptions, WHO applied to their own mortality estimates.
Appendix
With each annual World Malaria Report, estimates for previous years are updated. These updates can be significant, as was the case for the 2021 report, due to new modelling of CoD fractions for children under five.[18] This new model estimated that a greater proportion of under-five deaths had been caused by malaria than previously estimated. Recently, this was 7.8% of under-five deaths globally, compared to 4.8% predicted by the old model.[20] This caused estimated mortality from malaria to increase for all reported years (i.e. back to 2000). The estimate for 2019 changed from 409,000 to 558,000. Obviously, the impact of using these higher CoD fractions for malaria continued with the 2022 World Malaria Report estimates:
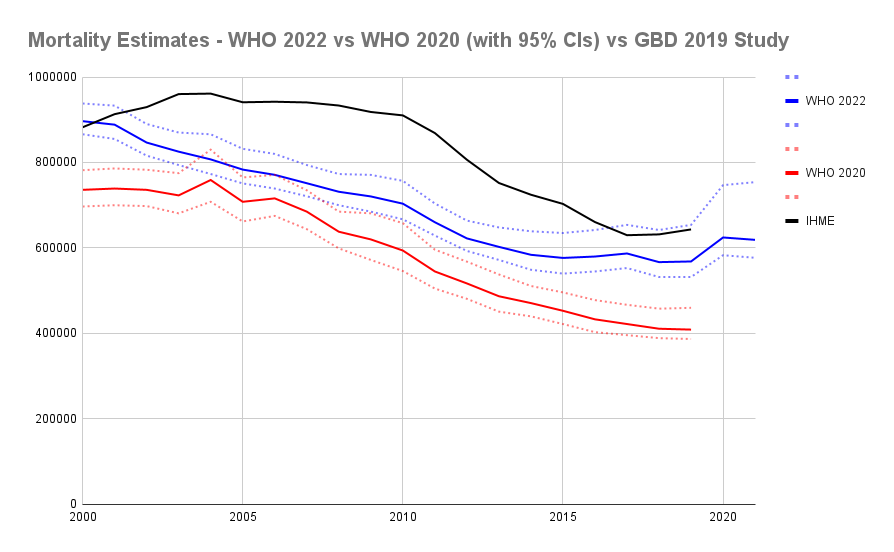
I included the IHME (i.e. 2019 GBD study) estimates for comparison. I will not attempt to review and describe how the modelling differs from that of WHO, except to comment that:
- Estimations of cases are more similar than fatalities (hence they mostly differ by estimated case fatality rates).[21]
- IHME estimations were especially reliant on the modelling by MAP.[22]
Note: I did not get this post reviewed nor fact-checked. If you suspect there might be an error somewhere please let me know.
Footnotes
- ^
Parasitemia with a fever.
- ^
This is largely just a summary of the annex for Table 3.1. in the World malaria report 2022 (pp.132-136). It can be considered the source for all statements in this post, unless stated/cited otherwise. In the post, I am only attempting to describe (i.e. avoiding analysis and opinions).
- ^
WHO do not name these methods. “Cartographic” and “surveillance” I got from the naming given to corresponding regions in MAP modelling (see Weiss et al., 2019), and the other names seemed appropriate to me.
- ^
The surveillance approach was used for the African countries: Botswana, Eritrea, Ethiopia, the Gambia, Madagascar, Mauritania, Namibia, Rwanda, Senegal, Zimbabwe.
- ^
Impact of COVID-19 was country-dependent. In several countries, impact was considered positive due to movement disruptions helping to slow malaria transmission. However, globally it was considered to have a net negative effect due to disruptions in interventions and treatment.
- ^
Angola, Benin, Burkina Faso, Burundi, Cameroon, Central African Republic, Chad, Congo, Côte d’Ivoire, DRC, Equatorial Guinea, Gabon, Ghana, Guinea, Guinea-Bissau, Kenya, Liberia, Malawi, Mali, Mozambique, Niger, Nigeria, Sierra Leone, Somalia, South Sudan, Sudan, Togo, Uganda, Tanzania, Zambia.
- ^
“Prevalence” is the proportion of people infected by the malaria parasite. Standardisation is required due to the differing accuracy of diagnosis methods (microscopy, RDT and PCR) and a relationship between parasite prevalence and age. PfPR2-10 stands for P. falciparum prevalence in children aged 2-10 years. Frequently, being infected with the parasite does not result in symptoms (it is dependent on level of infection, natural immunity, and likely much more).
- ^
- ^
- ^
To account for natural immunity.
- ^
- ^
Table 3.2, World malaria report 2022 . “WHO African Region” does not include all countries on the African mainland. There are several African countries in the WHO Eastern Mediterranean Region, that geographically is hard to explain but looks correlated with being Arab states. Just three of these countries have current malaria endemicity (Sudan, Somalia and Djibouti).
- ^
Botswana, the Comoros, Djibouti, Eritrea, Eswatini, Ethiopia, Madagascar, Namibia, Somalia, Sudan, Zimbabwe.
- ^
For P. falciparum, WHO cites: Alles et al., (1998); Luxemburger et al., (1997); Meek, (1988); unpublished data from Indonesia (2004-2009). For P. vivax, WHO cites: Douglas et al. (2014). At first glance, this method seems surprisingly weak, however it contributes relatively little to overall estimate and I am not attempting any analysis in this post.
- ^
The function in the CFR method for estimating proportion of deaths under five, and in the CoD method for estimating proportion of deaths over five, are derived from modelling in Ross et al. (2006).
- ^
“Population at risk” is 100% of population at risk in “high endemic areas” plus 50% of population at risk in “low endemic areas.” I do not know the criteria for classifying high or low endemic areas.
- ^
Angola, Benin, Burkina Faso, Burundi, Cameroon, Central African Republic, Chad, Congo, Côte d’Ivoire, DRC, Equatorial Guinea, Gabon, Gambia, Ghana, Guinea, Guinea-Bissau, Kenya, Liberia, Malawi, Mali, Mauritania, Mozambique, Niger, Nigeria, Rwanda, Senegal, Sierra Leone, South Sudan, Togo, Uganda, Tanzania, Zambia.
- ^
- ^
But in both scenarios disruptions in malaria prevention interventions (like LLIN distributions) were included. WHO does not explain the rationale and I have not looked into it.
- ^
World Malaria Report 2021 (p. 22)
- ^
Feel free to browse my Google sheets for this post.
- ^
Hi Scott, do you know where we can get the data sets to add it to the EA Data Science repo?
Hello Patrick.
For WHO estimates of case incidence and deaths since 2000 (as of 2022 report), go here, click on "Annexes in Excel Format" and it is Annex 4-F.
If you are want country numbers by estimate approach, I did that manually by combining Annex 4-F data and text from World Malaria Report 2022 (same link above), Annex for Table 3.1 (pp 132 - 136). This is it
If you are after GBD data (regarding Appendix), this is the tool to use
I hope that is helpful. Let me know of any questions.