SUMMARY: This post provides an exploratory analysis of the cost-effectiveness of using small inexpensive vehicles for non-emergency patient transport in rural Africa with a focus on Malawi. If implemented efficiently, this intervention is likely to improve health outcomes at a cost tht can be less than $100/DALY. The use of a solar vehicle can also “reduce” CO2 emissions, though this is less valuable than the improved health outcomes. In total a solar vehicle that has an initial cost of ~$4000 to purchase is likely to save 4.5 to 19.2 tons of CO2 and 50 to 340 DALY of avoided disease burden (i.e. ~ 1 to 7 lives saved per vehicle) over its lifetime when effectively applied to non-emergency patient transport in rural Malawi.
Introduction
Hi, my name is Howard Zhang, and I am a freshman Environmental Science. I have recently finished a student run “DeCal” Effective Altruism class during the Fall ‘23 semester. My class project has been to analyze the cost effectiveness of solar cars given to residents in rural Malawi for non-emergency clinical transportation that we are doing in collaboration with @Robert Van Buskirk who is co-authoring this post. These solar cars require little maintenance and don't come with any gasoline expenses making them a good candidate for helping rural communities get access to healthcare facilities.
Intervention description
In 2022, Solar4Africa.org (a small solar charity working in rural Malawi) piloted the import of 10 solar-powered cargo tricycles for use in rural villages. Import and assembly of these solar vehicles cost approximately $4000 each, but the vehicles come with very long lasting batteries that should be able to last 5 to 10 years or more. It was found that while it is difficult to rent the vehicles and garner enough revenue to pay off the initial vehicle cost, local village operators are able to operate the vehicles with a labor cost of only $1 to $2 per hour of vehicle operation.
Solar4Africa is therefore considering using the vehicles to provide free transportation to health clinics and hospitals for low-income patients. As a pilot test, one of the ten vehicles is currently used for clinic transport and is reliably providing about 1 to 2 patient trips per day. If such free transportation services can have a sufficiently large impact on health services access and health outcomes, Solar4Africa will expand the program.
Preliminary literature review
A preliminary review of the EA Forum does not indicate any significant discussion about health clinic or health services transportation interventions as an EA intervention or charity.
A preliminary review of the academic literature indicates that in SubSaharan Africa (SSA), clinic and health services transportation and access can have a potentially large impact on health outcomes.
One study indicates that households within 30 minutes of a clinic may use clinic services 10 times as much as households that are more than 90 minutes away from a clinic (Tansen, Gijsbertsen & Herbst, 2006). Thus it is possible that providing transportation services for households that are more than 90 minutes away from a clinic or hospital could have a very large impact on health services use and health outcomes.
Another study (Lankowski, et al., 2014) states that up to 20 percent of participants cited “geographic and transportation-related barriers as factors that promoted poor outcomes throughout the continuum of HIV care, including delaying or forgoing HIV testing.”
These studies underscore the strong link between geographical proximity, transportation availability, and health service utilization. The impact of these factors extends beyond convenience and emerges as a critical determinant of health outcomes, particularly in the context of preventive and chronic care. Therefore, Providing solar cars to communities in rural Malawi could be an important solution to address transportation barriers and enhance healthcare access by offering a reliable means of transportation, reducing the travel time, and minimizing the cost of attending clinics.
How might clinic access impact health outcomes?
While the literature indicates that easy transportation to a local clinic or hospital enables greater use of health services, we are not yet aware of literature that focuses on how better access to health services decrease disease burdens.
@Robert Van Buskirk has therefore provided an initial analysis of how health services access might impact disease burdens as illustrated in Figure 1 below.
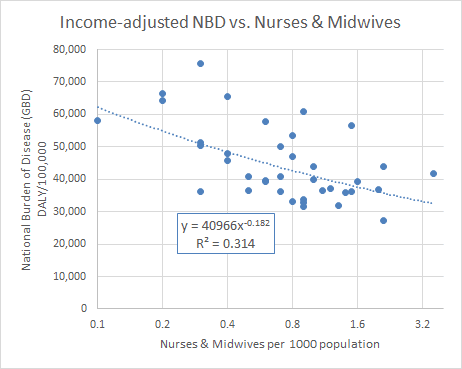
Figure 1 shows an inter-country correlation of the all-causes national disease burden (NBD) with availability of nurses and midwives as indicated by World Bank Data. The World Bank provides the number of nurses and midwives per 1000 population by country. Similarly, the Institute for Health Metrics and the Global Health Data Exchange provide access to global burden of disease data for all countries.
@Robert Van Buskirk adjusted the NBD in Figure 1 to remove the correlation with income. A two-dependent variable correlation analysis indicates that disease burden is significantly negatively correlated to BOTH national average income and the number of nurses and midwives per 1000 population, as one might expect.
Also the sample of national data shown in Figure 1 includes 38 SSA countries with HIV disease burdens of less than 7,000 DALY/100,000. For Southern African countries (i.e. South Africa, Namibia, Lesotho,Botswana, Eswatini, and Zimbabwe), very high HIV/AIDS disease burdens de-correlates NBD with national average income.
The correlation shown in Figure 1 for 38 SSA countries is between the all-causes NBD in DALY/100,000 as a function of access to nurses and midwives at the country level. This correlation provides a possible power law equation that can tentatively be used to relate health services access to disease burden. This correlation appears to indicate a power-law trend where total burden of disease decreases by a power law of X-0.182 where X represents the variable representing access. Such a power low relationship implies that a doubling of the availability of nurses and midwives leads to 12% correlated decrease in total disease burden because 2-0.182 ~ 0.88 = 1 - 12%.
Figure 1: Correlation of national burden of disease (NBD) with the availability of nurses and midwives for Sub-Saharan African countries with low HIV burden.
In rural Malawi, where Solar4Africa works, non-emergency transportation to a health clinic or hospital typically costs $1 to $5. For context, the minimum wage in Malawi is less than $2 per day. Given that the academic literature indicates that proximity to a clinic can increase clinic visits ten-fold, it is probably fairly conservative to estimate that the provision of a free clinic transportation service can double the chances that a non-emergency patient may visit a clinic. Thus given the correlation relationship shown in Figure 1, it is reasonable to estimate that such doubling of clinic visits may decrease the burden of disease by very roughly ~12%.
It is also reasonable to assume that in low-income rural areas, the average burden of disease of people visiting a health clinic is larger than the national average. In Malawi, the national average burden of disease is 0.407 DALY/capita/year (2019 GBD Study). Thus, it is reasonable to conservatively assume that the burden of disease of rural patients wanting to visit a health facility is somewhat higher than this. We select a baseline disease burden for clinic patients ranging from 0.5 to 1.0 DALY/capita/year.
Evaluation of environmental and climate impacts
In addition to the health benefits of using a small, solar-powered vehicle for clinic transport, there are potential climate benefits of introducing small solar vehicles in rural Africa. In evaluating the environmental and climate impacts, we will initially focus on the CO2 emissions reductions from using a solar rather than a gasoline-powered vehicle. Then we will discuss the social value of CO2 emissions reductions. And then we will discuss the possibility that initial introduction of solar vehicles leads to their wider adoption in Africa.
Emissions reduction estimates
For the data on the kilograms of carbon dioxide emitted per kilometer for the average car, we took the average of the emissions from six different common vehicles differing in size (Smart fortwo Coupé, Honda Civic 06, Toyota Yaris 1.0 VVT, Peugeot 308 SW 1.6, Vauxhall Zafira, MY2008 Turbo 200PS, Toyota Avensis 2.0 VVT). We obtained these numbers from the Activation Environment Federation, resulting in approximately 172 grams of carbon dioxide emitted per kilometer. We then cross-referenced this data with information provided by another source, 8billiotrees.com, which stated that a medium-sized car emits roughly 192 grams of carbon dioxide per kilometer. Taking the average of these two data points, we arrived at an estimate of 182 grams of carbon dioxide emitted per kilometer for the average car.
With a general idea of the emissions per kilometer, we multiplied it by the number of kilometers traveled per ride, set at around 20 km, and the number of rides to obtain the final estimate of emissions per ride and over the lifespan of a vehicle.
The same method was applied to the calculation of motorcycle emissions, but using different sources of data. According to thrustcarbon.com, the website estimated that the average motorcycle emits around 113.37 grams of carbon dioxide per kilometer traveled. Cross-referencing this data with another website, co2everything.com, confirmed that an accurate estimate of the amount of carbon dioxide emitted per kilometer for an average motorcycle is around 113 grams.
As a result, an electric car can save anywhere from 7,680 kg to 19,200 kg of carbon dioxide over its lifetime if the mode of transportation were replaced by a car. On the other hand, if people rode motorcycles instead of electric cars, they would emit an extra 4,535 kg to 11,337 kg of carbon dioxide, depending on whether the electric vehicle can sustain 2,000 to 5,000 rides over its lifespan. This 4,535 kg to 19,200 kg of CO2 emissions reduction is the climate benefit of using a solar vehicle rather than gasoline-powered vehicles for clinic transport.
Social Cost of Carbon
According to the most relevant document published by the United States Government in 2021, Technical Support Document: Social Cost of Carbon, Methane, and Nitrous Oxide, the social cost of carbon dioxide around 2025 ranges from 17-169 dollars per metric ton of carbon dioxide depending on the technical details of the social cost calculations. If we were to multiply this by the tons of carbon dioxide the electric vehicle saves over its lifetime, it would save anywhere between 144-3577 dollars if the rides were replaced by a car and 85-2112 dollars if the rides were replaced by motorcycles, depending on whether the electric vehicle can sustain 2,000 to 5,000 rides over its lifespan and the precise social cost of carbon dioxide per metric ton. These values encompass a very wide range, but the geometric mean values of $717 and $423 are significant, but probably not high enough to justify the use of the vehicles based on simply their climate benefits.
Replication potential
Currently adoption of solar-electric vehicles in low income countries is either minimal or non-existant. This primarily because development of products and technology requires access to low-cost capital and technological expertise which is often scarce in low-income settings.
Introducing subsidized small solar electric vehicles in low-income settings in an economically efficient way-where subsidies produce a social value that is higher than the cost of the subsidies-can accelerate introduction and adoption of electrified transport in such settings. By having a public program pay the initial costs of market introduction and technology adaptation, this lowers the cost for private actors who can copy the technology to create market-based applications.
Because solar-powered transport has extremely low operating costs, small solar vehicle operators can potentially earn higher wages with a solar vehicle once it's initial cost has been paid. And future aid or government programs will likely have an growing interest in promoting electric transport as the costs of climate change continue to rapidly increase over the coming decades.
Cost effectiveness (CE) analysis of Health Impacts
We now address whether a 100% subsidy of clinic transport is cost effective based on potential health benefits.
We perform a simplified CE analysis with uncertainty as described in this post. The key input variables to the CE analysis are the number of rides per vehicle, the number of rides per year, the labor cost per ride, the rides per beneficiary, and the health impact of the visits. The values used for these CE parameters are show in Table 1 below.
The CE in units of $/DALY is simply the cost per patient per year divided by the disease burden decrease per patient per year.
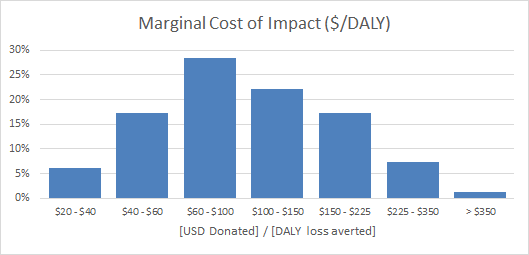
Figure 2 illustrates the distribution of CE results that are obtained from the evenly sampling all of the input parameter combinations provided in Table 1. It shows that given the range of possible CE parameter inputs, it is more likely than not that the CE value will be less than about $100/DALY.
Table 1: Inputs to cost effectiveness calculation
Variable
Low
Med
High
Total rides/vehicle
2000
3000
5000
Rides/year
300
600
1200
Vehicle cost
$4000
Labor cost per ride
$1
Program cost mark-up
30%
60%
100%
Patient disease burden (DB) (DALY/year)
0.50
0.75
1.0
Percentage disease burden decrease
6%
12%
18%
Rides/patient/year
2
Figure 2: Distribution of cost effectiveness results for full sampling of potential input values.
Conclusion
If implemented efficiently, it appears from a preliminary analysis that small solar vehicles for non-emergency clinic transport in rural Malawi can be cost-effective, i.e. deliver disease burden reductions at potentially less than $100 per DALY of disease burden averted. In addition, the emissions reduction benefits of using a solar vehicle is likely worth several hundred to a few thousand dollars. More investigation needs to be done regarding the potential health benefits of increased health services access through improved transportation services in rural Africa. If such services do have a substantial impact on health outcomes, then it is likely that distribution and operation of small solar vehicles for the provision of transportation services for urgent, yet non-emergency patients in rural Africa is cost-effective. This may justify fully subsidizing of provisioning of small solar vehicles for health services transportation in Africa. This may be a novel means of introducing solar-electric vehicles to low-income Africa given that traditional electric vehicles are currently too expensive for low-income country adoption.
This is a crosspost from the new Animal Welfare Alignment Newsletter by Anima International. You can subscribe on Substack if you are interested in following these efforts. Audio reading also available on Substack.
The goals of this post are to:
1. Raise a question I see as crucially important to the goal of aligning AI to animal welfare...
Hello! I'm Justin Portela. I got hired by GWWC to make YouTube videos after AI in Context did such a kickass job.
My channel is using that same cinematic, high-production value beauty to talk about everything in the EA universe that isn't AI.
...
This is a linkpost for Request for Proposals: Research and Applied Work on Digital Minds.
I'm glad to announce a request for proposals for research and applied work on digital minds at Longview Ph...