Comments

17 min readDec 16, 2022
| This is a Draft Amnesty Day draft. This means that this post may have some errors, or be missing some anlaysis. If it weren't for this initiative, we may not have published this post for some time. |
Thank you to Amber Dawn for editing and getting this post over the finish line, Neha Georgie, Arjun Khandelwal and Sarrin Chethik for reviewing drafts of this post, and to all the group organisers who took the time to complete the survey. Mistakes are ours.
In 2019-2020, a few group organisers founded & ran a project called the Local Career Advice Network, a voluntary network of EAs seeking to improve the quality and availability of localised career advice (particularly outside the US and UK). This survey was conducted by the LCAN in February 2020. We used the results from this survey to prioritise our Fall 2020 activities.
Because of our own uncertainties and feedback from stakeholders, the Local Career Advice Network team decided to evaluate our initial assumptions about the major career-related bottlenecks facing EA group members at the end of 2020. So, we decided to survey EA group organisers and ask them explicitly about their members’ bottlenecks.
As we designed & analysed the survey, we tried to be careful to:
1) avoid biassing group organisers' responses
2) account for group organisers' biases
3) accurately judge the representativeness of different groups’ responses
Before conducting the survey, our hypothesis was that the main career bottlenecks for EAs in underrepresented countries were:
This was based on group discussions and informal conversations with ~20 group organisers, mainly from outside of the US/UK. One community builder at a meta organisation at the time thought it was possible that the main bottleneck was instead that members in those groups weren't as talented or promising as those in other groups.
Based on this feedback, we wanted to develop a way to evaluate any and all bottlenecks EA community members might face, and survey organisers in a way that didn’t influence their responses.
We first deliberated about whether we should take a structured, semi-structured or unstructured approach to surveying respondents about their group members’ bottlenecks. We outlined some advantages and disadvantages (summarised in the table below) of each approach.
| Approach | |||
| Attribute | Structured | Semi-structured | Unstructured |
| Methodology | Quantitative Survey | Qualitative Survey | Case Studies, Interviews |
| Sample Size | Large | Medium | Small |
| Data Accuracy (excluding influencing respondents) | Low | Medium | High |
| Time-Cost (respondents) | Low-Medium | Medium | High |
| Time-Cost (surveyors) | Low | Medium-High | High
|
We decided on the semi-structured survey approach. Our reasoning was as follows:
Thus we decided on the semi-structured approach. This consisted of both structured and open-ended questions, which will be described in detail below. We were ultimately able to get 27 respondents, notably 11 who were national group organisers and could speak about general trends in their countries. We think that we weren’t able to get more responses because the survey did take a reasonable time to complete (around 30+ minutes). To account for this, we asked a number of demographic questions to help us weight responses, such as how much time the organisers spent on community building and careers advice, the size of the group, and so on.
In the semi-structured approach, we wanted to investigate the different factors that could affect (positively and negatively) a person’s career transition into a career with high(er) impact. At first, we experimented with trying to identify different “types” of members who had a similar cluster of career factors that enabled or limited them which group organisers may be able to discuss (e.g. someone who has the relevant career capital for a path, but perhaps lacks the resources or work authorization to pursue it). As we started discussing these different “types” we realised that 1) we didn’t have sufficient data to know whether these types were accurate and 2) we could instead try to simply identify the different factors that affect someone’s career transition, and ask questions about these to the respondents.
We then developed the career factor framework (see below). Using this framework, we still needed to figure out how we wanted to ask respondents about these factors. At first we considered asking group organisers to identify the “types” themselves. The rationale behind this was to see if there were some very talented people who faced the same bottlenecks. But we realised that this might be too complicated and could make the data quite messy. It would also probably take too much time, as organisers would need to think about individual group members and (particularly in larger groups) they may not know most members personally, or if they did it would take too long. We didn’t want the survey to be too complicated or cumbersome and put respondents off. For that reason, we also couldn’t ask precise quantitative questions such as, for example, the numbers of members who faced a particular bottleneck.
In the end, we decided to ask respondents to freely brainstorm the different bottlenecks faced by their group members, and then ask them to isolate and categorise individual bottlenecks, with the understanding that many factors could correlate and overlap.
The downside of this approach is that we lacked the nuance of individual cases. We wanted to use the data we gathered to help us identify the big picture issues, and discover areas that needed more focus or more targeted research.. We try not to make too many inferences from the data.
We started with 80,000 Hours’ formula for a perfect job. However, we found it didn’t break down the possible factors into enough depth for the purposes of our study. Importantly, it didn’t account for the situational factors that we’d observed from the group organisers we’d spoken to before. In particular, we wanted to take another look at the concept of “personal fit”, which is defined by 80,000 Hours as: “Your degree of personal fit in a job depends on your chances of excelling in the job, if you work at it.”
We grouped the individual factors identified into three high-level categories:
1. Internal Factors
2. Situational Factors
3. Career Capital Factors.
Throughout the process of developing this framework we sought out feedback from group organisers, especially those with significant experience running career 1-1s.
The definitions of each category and factors are listed in the table below.
| Category | Definition | Factors |
| Internal Factors | Factors internal to the person which may include motivational, personality or other traits. | Innate abilities Knowledge of EA Path uncertainty Personal Uncertainty |
| Situational Factors | Factors external to the person, which can be linked but are not limited to socioeconomic status, nationality, social connections and health. | Economic resources Social and Health Resources Freedom of Movement Flexibility of career capital |
| Career Capital Factors | Factors that are directly related to a given career path and your technical ability to excel in it. Unlike the 80K definition, we have defined this to be more closely associated with career-specific factors. | Skills Experience Credentials Connections |
The above is a summary of the first version of the Career Factors Framework . After conducting the survey, we updated the framework in accordance with the responses. We will describe this process in the data cleaning & code section below.
We asked respondents:
“Please take a few minutes to write the most important or salient bottlenecks that come to mind when thinking about the members of your local group. Treat this as a brainstorm session and write as many things as you can think of, in the next section we will ask you to categorise these.”
We then briefly explained our framework and provided a brief overview of the categories and framework, as it was presented in the previous section.
We then asked respondents to identify individual bottlenecks from their brainstorm, and for each brainstorm asked them to:
Once we'd chosen the semi-structured survey approach, we then tried to design it to mitigate its weaknesses, and to make sure that we didn't bias respondents' answers. We did this by:
We tried to ensure data accuracy by:
We expected that we would need to re-categorise the constraints given respondents' limited time with our framework and how interrelated constraints can be. We re-coded the factors by:
We used context from the respondents’ initial brainstorm, their categorization, description of the bottleneck identified and the additional thoughts to make sure we were categorising the information accurately. For most bottlenecks, we ended up choosing a factor that was among the factors the respondent had originally chosen. Where we couldn’t make a good judgement call we excluded these responses from the analysis. We also decided to only list a factor once per group, to avoid over-counting. It didn’t change the data by much, but we’ve decided to just go with the 1 factor.
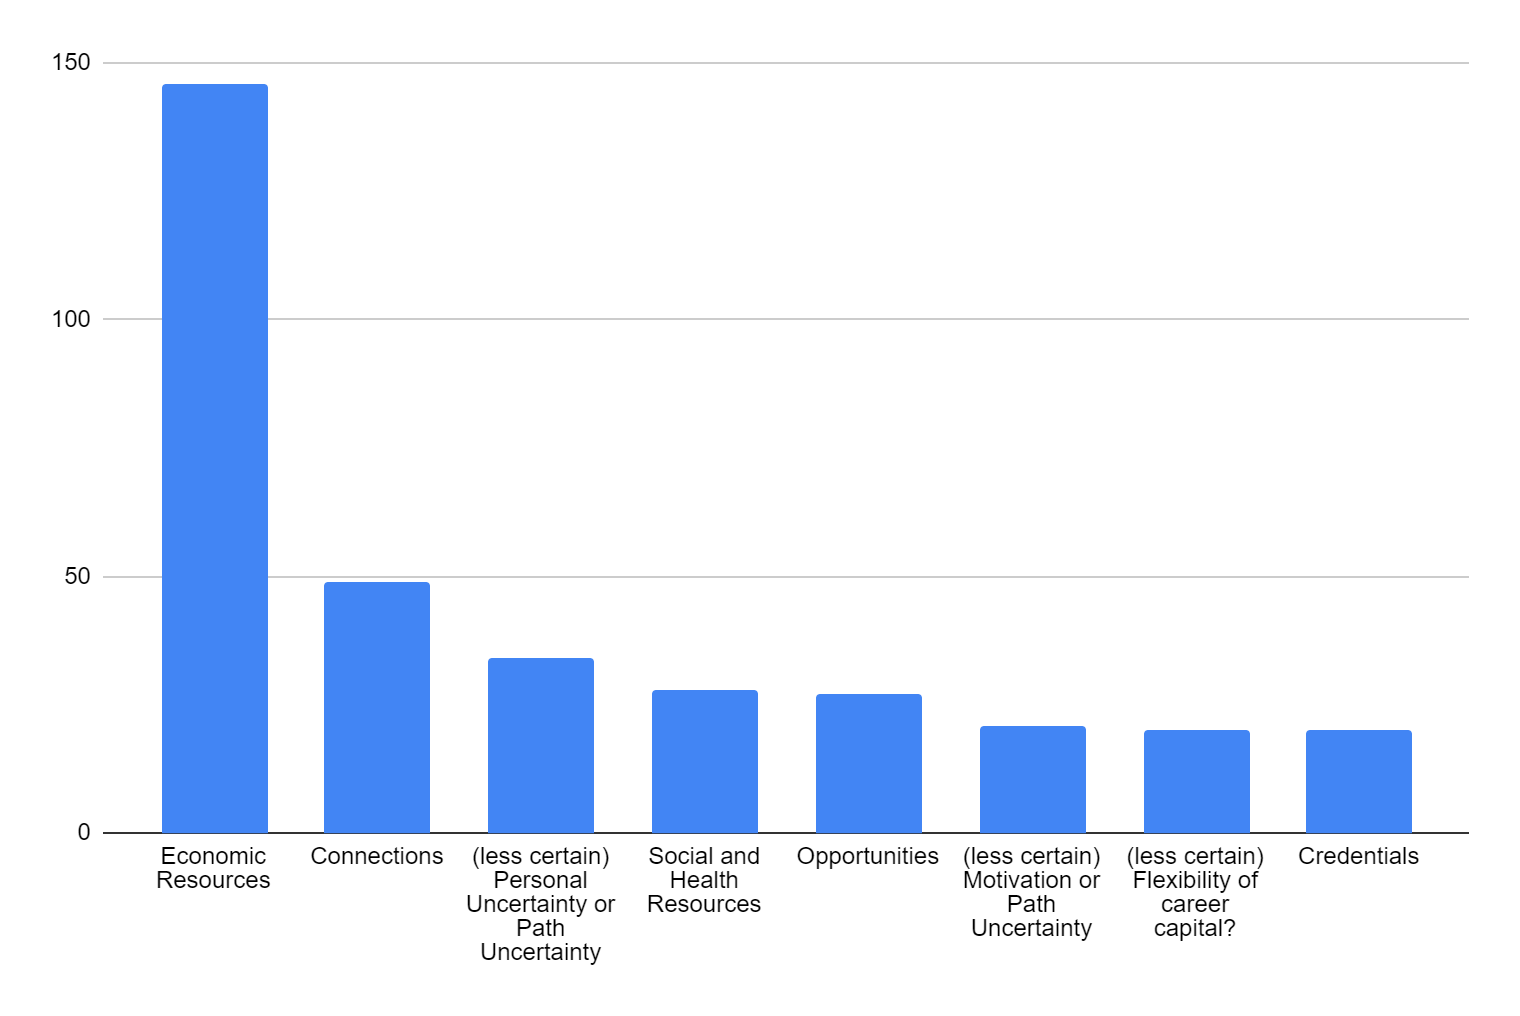
This chart shows the comparison between the original coding respondents gave to the bottlenecks they identified, as compared with our final re-coding. Each column breaks down our final coding of the factor into the originally assigned factors. So, for example, for the “Skills” factor, only 4 respondents originally coded this factor as a “Skills”, while the remaining respondents coded it as something else.
For ease of comparison, we’ve also colour-coded the career categories: dark green for career capital, blue for internal factors and light green for situational factors.
As a test of the relevance of our framework, the 2020 EA Survey asks participants what bottlenecks their impact. Here are their responses:
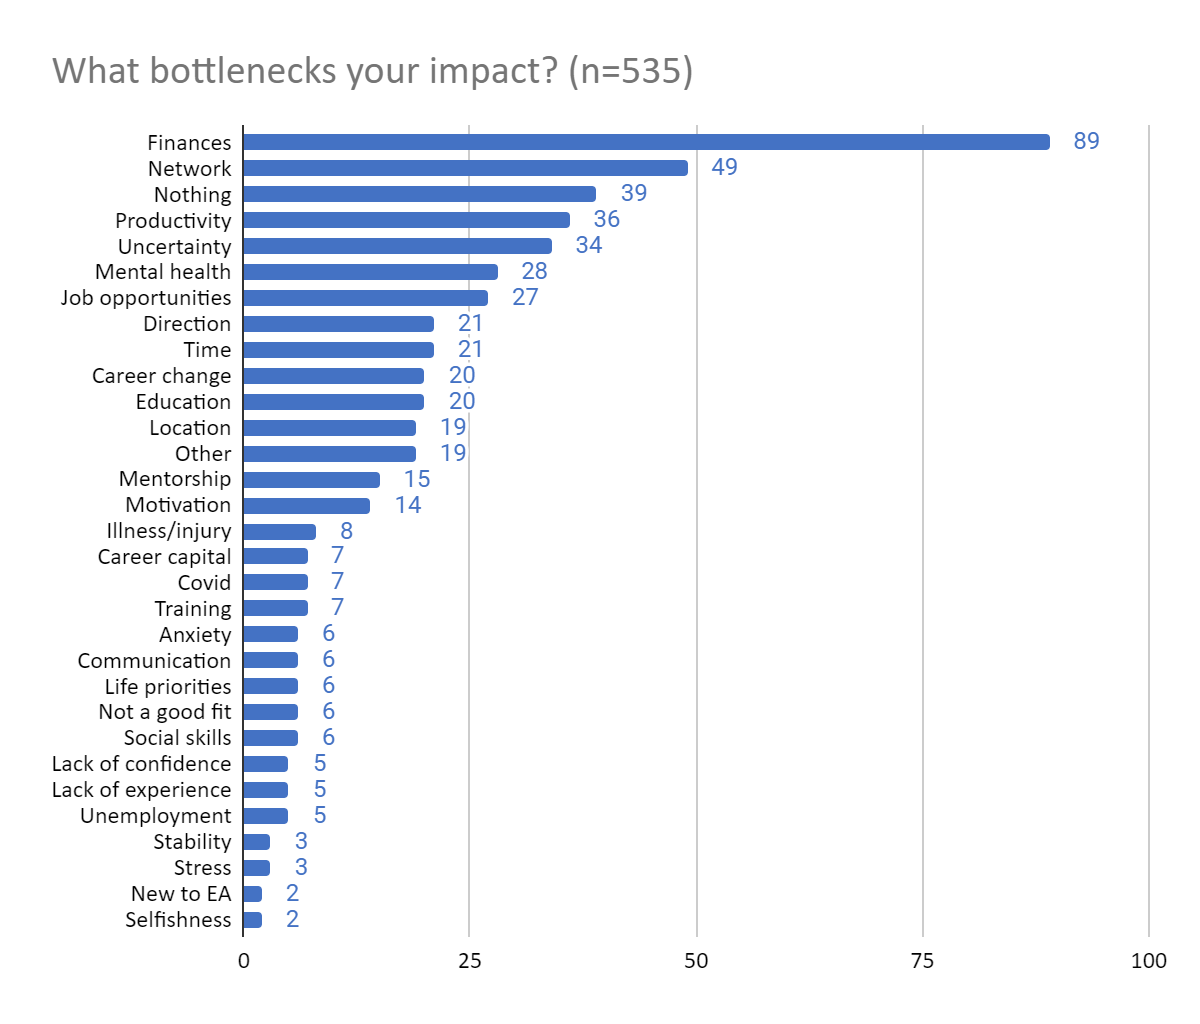
Respondent bias aside, many of these reasons fit quite neatly into our framework categories, as shown in the table below for the top 10 (excluding “nothing”):
| Finances | Economic Resources | 89 |
| Network | Connections | 49 |
| Productivity | Economic Resources | 36 |
| Uncertainty | (less certain) Personal Uncertainty or Path Uncertainty | 34 |
| Mental Health | Social and Health Resources | 28 |
| Job opportunities | Opportunities | 27 |
| Direction | (less certain) Motivation or Path Uncertainty | 21 |
| Time | Economic Resources | 21 |
| Career change | (less certain) Flexibility of career capital? | 20 |
| Education | Credentials | 20 |
Interestingly, the limit on impact is dwarfed by finances, with over 50% of the economic resources factors. This may be because participants are measuring their impact more by ability to donate than ability to use their careers, unlike our respondents who were focused on the latter.
Despite these efforts, we believe there are still biases in our data. We have outlined many of our main concerns in the first post of this survey writeup. Here are a few other limitations:
Respondent’s lack of information: Group organisers don't know everything about their members, even those who know their members quite well.
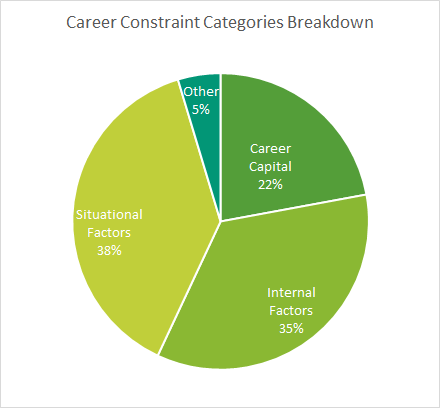
Overall, there was no one standout bottleneck or category of career bottlenecks. Situational factors and internal factors were almost equal at 38% and 35%, followed by career capital factors (24%) and other factors that we were unable to categorise (5%) (see pie chart). The top 5 factors cross all three categories, and are ranked closely together.[1]


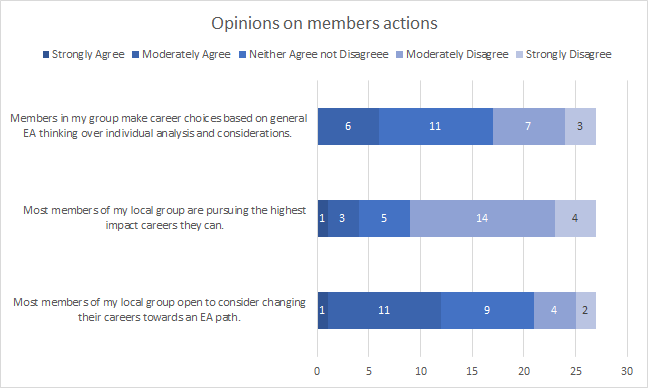
Although we don't discuss this data in detail below, this data seems useful to contextualise how organisers see their members' actions overall:
We expected freedom of movement to be a top bottleneck for non-US and non-UK organisers. Issues included difficulties getting work visas, financial or difficulty communicating with their parents about EA jobs, and separation from social support networks of friends and family. The main co-listed factor is Economic Resources, suggesting this could contribute (this seems more plausible than the opposite connection). However, our respondents also specifically cited an overall lack of jobs (not just location-specific opportunities), so we coded these separately and added Opportunities as a new factor. Opportunities are also related to the Connections factor (3 respondents tagged these bottlenecks as Connections).
We had 8 total mentions of a lack of EA jobs, with 6 unique respondents citing a lack of local EA-aligned jobs as a bottleneck for their members, and an additional 2 repeated respondents citing a general lack of opportunities. Some respondents cited a lack of EA jobs in particular, other barriers were: language, country/location, and a lack of remote jobs. Others cited limited work opportunities at effective organisations (not necessarily EA) or even any organisations focused on relevant causes. Some respondents cited a lack of opportunities to test fit for undergrads, or on short time scales (both university groups), and one of them cited a lack of suitable academic supervisors for AI safety work in their country.
We added ‘motivation’ as a factor because several respondents cited it. We had hypothesised that motivation would be a complex issue, and the results suggest that this is correct. Respondents cited numerous reasons why members lacked motivation including people feeling like they can’t contribute because they lack a scientific background, challenges due to being later in their career, lack of ambition or initiative, lack of interest or commitment to EA. Respondents who did mention motivation explicitly in their free brainstorms, categorised it as personal uncertainty, path uncertainty and knowledge (however, motivation was not an option in the default, and people have strong preferences towards defaults in general).
We thus still think it could be more actionable to address the most prominent causes of low motivation, or one of the other prominent bottlenecks, but it’s possible that interventions that tackle motivation holistically may be worth investigating further.
These reasons may have deeper causes such as: a lack of self-efficacy exacerbated by a lack of knowledge, or needing a nudge to apply to impactful positions. Further, lack of motivation can itself be a root cause of other issues. For example, 3 respondents said that people who were unwilling to move lacked motivation.
Personal uncertainty (internal factors) was a top bottleneck. The most common reason for personal uncertainty (cited by 4 respondents) was low confidence or self-esteem. Reasons for low confidence were: decision paralysis because of the pressure to do the “most” good, feeling that you can’t have an effective career if you don’t fit into one of 80,000 Hours’ jobs, and imposter syndrome. Thus personal uncertainty could be resolved by improving the communication of EA career advice and ideas. Other points:
Respondents originally coded personal uncertainty under knowledge, path uncertainty and credentials. These are not surprising co-listings.
Overall, there was acknowledgement that solving the issue of skills (career capital) was fairly difficult. One person suggested headhunting to fill high impact career paths in their country. Another mentioned the confusion between skills and talent, and finding it hard to know what is innate and what is learnable. In particular, this organiser mentioned that their members are “highly educated and skilled people, but I do think getting high-impact roles is very hard to do. Internships or volunteer positions are hard for some people to get, and that is to be expected. I believe personal confidence/charisma/social skills might be something that limits some of my group members (as well as more credentialed things).”
One organiser mentioned not knowing how to support people when they aren’t well-suited to 80K’s priority paths, which is likely to relate to skills, but may also relate to innate talent or other career capital factors.
One person mentioned challenges because most of their active members are fresh graduates or college students lacking skills and credentials (because they attended the local universities) and two mentioned a lack of fluent English as a barrier, one stating “The current world language isn't English, but bad English”.
We updated our career factors framework as a result of the survey.
We didn’t ask our organisers how they define a successful career change, and used the term “priority path” throughout our v1 of our career factors framework, which refers to 80,000 Hours’ priority paths. We think this is a significant flaw in our design.
This question seemed less pressing at the time the survey was conducted in early 2020. The de facto assumption was that 80,000 Hours’ priority paths (and some other prominent EA paths) were highly valued (~50% of group organisers in our survey cited use 80K as a resource “all the time”), and we assumed (we think mostly rightly) that most organisers, especially those on community building grants (who were evaluated on the basis of these metrics) saw these as the highest impact paths. Additionally, many group organisers discussed paths in animal welfare and global health and development in their responses, which weren’t explicitly listed as 80K priority paths.
We now believe that getting a sense of organisers’ strategy and perspective would have been valuable and would ask both how respondents define a successful career change, use the term “high impact paths” and make it clear that this doesn’t imply that 80,000 Hours’ priority paths were all/most of possible high impact paths.
We could address the freedom of movement bottleneck by helping members identify promising local and remote opportunities, and improve information resources by generating more knowledge about promising paths, fields, and organisations on a locally-relevant level.
Both motivation and personal uncertainty could potentially be alleviated by addressing the situational factors discussed above.
Improving 1-1 career advice could also address these issues. Career 1-1s were the top-rated event in the career activities evaluation, and there appears to generally be high demand for them in the community. We believe that personal uncertainty in particular could be addressed by career 1-1s. They are highly personalised and targeted, meaning that if they are done well an organiser can help identify the root cause of an uncertainty and potentially help address it. Additionally, organisers can provide support and encouragement which could improve motivation or uncertainty.
Notes: 6 factors were categorised as “Other” because they were either too general and were applicable to almost all or all factors, or they were not directly relevant to the question. We have excluded these from our analysis, apart from acknowledging them in this summary chart.
Factors with a high percentage (40-75%) of NAs (Connections, Information Resources, Knowledge of EA and Innate Talent) are because we discarded previous prevalence scores when recoding and/or because the respondents left this field blank. These bottlenecks are lower in frequency, but we included it to show the range of responses, and how complex this issue can be.


