All of Dan_Keys's Comments + Replies
I would rather see people make bets that they think are very profitable (relative to the size of the bet).
There's this idea that betting on your beliefs is epistemically virtuous, which sometimes leads people to be so eager to bet that they make bets at odds that are roughly neutral EV for them. But I think the social epistemic advantages of betting mostly depend on both parties trying to make bets where they think they have a significant EV edge, so sacrificing your EV to get some sort of bet made is also sacrificing the epistemic spillover benefits of the bet.
Wouldn't a person's "welfare footprint" also include, e.g., all the cases where they brightened someone's life a little bit by having a pleasant interaction with them? The purpose ("different animal products have vastly different welfare harms") seems fairly narrow but the term suggests something much broader.
I expect the causal effect to be pretty weak - if some light drinkers become nondrinkers, I guess that would lead to some reduction in the amount of heavy drinking, but not very much.
There are larger social influences from "the 5 closest people in your life [being] heavy drinkers" or from social rituals that actively pressure people into heavy drinking, but if the recommendation is for light drinkers to become nondrinkers that doesn't directly touch either of those causal pathways.
I basically disagree with this take on the discussion.
Most clearly: this post did generate a lot of pushback. It has more disagree votes than agree votes, the top comment by karma argues against some of its claims and is heavily upvoted and agree-voted, and it led to multiple response posts including one that reaches the opposite conclusion and got more karma & agree votes than this one.
Focusing on the post itself: I think that the post does a decent job of laying out the reasoning for its claims, and contains insights that are relevant and not widely ...
This post did generate a lot of pushback. It has more disagree votes than agree votes, the top comment by karma argues against some of its claims and is heavily upvoted and agree-voted, and it led to multiple response posts including one that reaches the opposite conclusion and got more karma & agree votes than this one.
I agree that this somewhat rebuts what Raemon says. However, I think a large part of Raemon’s point—which your pushback doesn’t address—is that Bentham’s post still received a highly positive karma score (85 when Raemon came u...
I'm unsure how to interpret "will probably doom". 2 possible readings:
- A highly technologically advanced civilization that tries to get really big will probably wind up wiping itself out due to the dynamics in this post. More than half of all highly technologically advanced civilizations that grow really big go extinct due to drastically increasing their attack surface to existential threats.
- The following claim is probably true: a highly technologically advanced civilization that tries to get really big will almost certainly wind up wiping itself out due to
Causality moves at c, so if we have probes moving away from each other at nearly 2c, that suggests extinction risk could be permanently reduced to zero.
This isn't right. Near-speed-of-light movement in opposite directions doesn't add up to above speed of light relative movement. e.g., Two probes each moving away from a common starting point at 0.7c have a speed relative to each other of about 0.94c, not 1.4c, so they stay in each other's lightcone.
(That's standard special relativity. I asked o3 how that changes with cosmic expansion and it claims that, given our current understanding of cosmic expansion, they will leave each other's lightcone after about 20 billion years.)
How about 'On the margin, work on reducing the chance of our extinction is the work that most increases the value of the future'?
As I see it, the main issue with the framing in this post is that the work to reduce the chances of extinction might be the exact same work as the work to increase EV conditional on survival. In particular, preventing AI takeover might be the most valuable work for both. In which case the question would be asking to compare the overall marginal value of those takeover-prevention actions with the overall marginal value of those sa...
Nate Soares' take here was that an AI takeover would most likely lead to an "unconscious meh" scenario, where "The outcome is worse than the “Pretty Good” scenario, but isn’t worse than an empty universe-shard" and "there’s little or no conscious experience in our universe-shard’s future. E.g., our universe-shard is tiled with tiny molecular squiggles (a.k.a. “molecular paperclips”)." Whereas humanity boosted by ASI would probably lead to a better outcome.
That was also the most common view in the polls in the comments there.
Wouldn't the economic spillover effects depend on macroeconomic conditions? Government stimulus is more useful when there is more slack in the economy and more inflationary when there's a tight labor market. I'd expect cash transfers to be similar.
I don't know the conditions in the specific places studied, but in a lot of places there was significant slack in the economy from the Great Recession until Covid, and the labor markets are now tighter. So studies conducted in the 2010s might overestimate the present-day net benefits of economic spillovers.
This sounds like one of those puzzles of infinities. If you take the limits in one way then it seems like one infinity is bigger than another, but if you take the limits a different way then the other infinity seems bigger.
A toy version: say that things begin with 1 bubble universe at time 0 and proceed in time steps, and at time step k, 10^k new bubble universes begin. Each bubble universe lasts for 2 time steps and then disappears. This continues indefinitely.
Option A: each bubble universe has a value of 1 in the first time step of its existence and a va...
I disagree. One way of looking at it:
Imagine many, many civilizations that are roughly as technologically advanced as present-day human civilization.
Claim 1: Some of them will wind up having astronomical value (at least according to their own values)
Claim 2: Of those civilizations that do wind up having astronomical value, some will have gone through near misses, or high-risk periods, when they could have gone extinct if things had worked out slightly differently
Claim 3: Of those civilizations that do go extinct, some would have had wound up having astrono...
Does your model without log(GNI per capita) basically just include a proxy for log(GNI per capita), by including other predictor variables that, in combination, are highly predictive of log(GNI per capita)?
With a pool of 1058 potential predictor variables, many of which have some relationship to economic development or material standards of living, it wouldn't be surprising if you could build a model to predict log(GNI per capita) with a very good fit. If that is possible with this pool of variables, and if log(GNI per capita) is linearly predictive of lif...
It looks like the 3 articles are in the appendix of the dissertation, on pages 65 (fear, Study A), 72 (hope, Study B), and 73 (mixed, Study C).
The effect of health insurance on health, such as the old RAND study, the Oregon Medicaid expansion, the India study from a couple years ago, or whatever else is out there.
Robin Hanson likes to cite these studies as showing that more medicine doesn't improve health, but I'm skeptical of the inference from 'not statistically significant' to 'no effect' (I'm in the comments there as "Unnamed"). I would like to see them re-analyzed based on effect size (e.g. a probability distribution or confidence interval for DALY per $).
I'd guess that this is because an x-risk intervention might have on the order of a 1/100,000 chance of averting extinction. So if you run 150k simulations, you might get 0 or 1 or 2 or 3 simulations in which the intervention does anything. Then there's another part of the model for estimating the value of averting extinction, but you're only taking 0 or 1 or 2 or 3 draws that matter from that part of the model because in the vast majority of the 150k simulations that part of the model is just multiplied by zero.
And if the intervention sometimes increases e...
I believe the paper you're referring to is "Water Treatment And Child Mortality: A Meta-Analysis And Cost-effectiveness Analysis" by Kremer, Luby, Maertens, Tan, & Więcek (2023).
The abstract of this version of the paper (which I found online) says:
...We estimated a mean cross-study reduction in the odds of all-cause under-5 mortality of about 30% (Peto odds ratio, OR, 0.72; 95% CI 0.55 to 0.92; Bayes OR 0.70; 95% CrI 0.49 to 0.93). The results were qualitatively similar under alternative modeling and data inclusion choices. Taking into account heterogenei
Two thoughts on this paper:
- Does it make sense to pool the effect of chlorine interventions with filtration interventions, when these are two different types of interventions? I don't think it does and notably the Cochrane review on this topic that looks at diorrhoea rather than mortality doesn't pool these effects - it doesn't even pool cholirnation products and flocculation sachets together, or different types of filtration together - https://www.cochrane.org/CD004794/INFECTN_interventions-improve-water-quality-and-prevent-diarrhoea - it's hard not
More from Existential Risk Observatory (@XRobservatory) on Twitter:
...It was a landmark speech by @RishiSunak: the first real recognition of existential risk by a world leader. But even better are the press questions at the end:
@itvnews: "If the risks are as big as you say, shouldn't we at the very least slow down AI development, at least long enough to understand and control the risks."
@SkyNews: "Is it fair to say we know enough already to call for a moratorium on artificial general intelligence? Would you back a moratorium on AGI?"
Sky again: "Given th
One way to build risk decay into a model is to assume that the risk is unknown within some range, and to update on survival.
A very simple version of this is to assume an unknown constant per-century extinction risk, and to start with a uniform distribution on the size of that risk. Then the probability of going extinct in the first century is 1/2 (by symmetry), and the probability of going extinct in the second century conditional on surviving the first is smaller than that (since the higher-risk worlds have disproportionately already gone extinct) - with ...
Why are these expected values finite even in the limit?
It looks like this model is assuming that there is some floor risk level that the risk never drops below, which creates an upper bound for survival probability through n time periods based on exponential decay at that floor risk level. With the time of perils model, there is a large jolt of extinction risk during the time of perils, and then exponential decay of survival probability from there at the rate given by this risk floor.
The Jupyter notebook has this value as r_low=0.0001 per time period. If a...
(Commenting on mobile, so excuse the link formatting.)
See also this comment and thread by Carl Shulman: https://forum.effectivealtruism.org/posts/zLZMsthcqfmv5J6Ev/the-discount-rate-is-not-zero?commentId=Nr35E6sTfn9cPxrwQ
Including his estimate (guess?) of 1 in a million risk per century in the long run:
In general, even assigning a low but non-tiny probability to low long run risks can allow huge expected values.
See also Tarsney's The Epistem...
Thank you very much Dan for your comments and for looking into the ins and outs of the work and highlighting various threads that could improve it.
There are two quite separate issues that you brought up here. First about infinite value, which can be recovered with new scenarios and, second, the specific parameter defaults used. The parameters the report used could be reasonable but also might seem over-optimistic or over-pessimistic, depending on your background views.
I totally agree that we should not anchor on any particular set of parameters, including ...
One way to build risk decay into a model is to assume that the risk is unknown within some range, and to update on survival.
A very simple version of this is to assume an unknown constant per-century extinction risk, and to start with a uniform distribution on the size of that risk. Then the probability of going extinct in the first century is 1/2 (by symmetry), and the probability of going extinct in the second century conditional on surviving the first is smaller than that (since the higher-risk worlds have disproportionately already gone extinct) - with ...
You can get a sense for these sorts of numbers just by looking at a binomial distribution.
e.g., Suppose that there are n events which each independently have a 45% chance of happening, and a noisy/biased/inaccurate forecaster assigns 55% to each of them.
Then the noisy forecaster will look more accurate than an accurate forecaster (who always says 45%) if >50% of the events happen, and you can use the binomial distribution to see how likely that is to happen for different values of n. For example, according to this binomial calculator, with n=51 there is...
Seems like a question where the answer has to be "it depends".
There are some questions which have a decomposition that helps with estimating them (e.g. Fermi questions like estimating the mass of the Earth), and there are some decompositions that don't help (for one thing, decompositions always stop somewhere, with components that aren't further decomposed).
Research could help add texture to "it depends", sketching out some generalizations about which sorts of decompositions are helpful, but it wouldn't show that decomposition is just generally good or just generally bad or useless.
However, an absolute reduction of cumulative risk by 10-8 requires (by definition) driving cumulative risk at least below 1-10-8. Again, you say, that must be easy. Not so. Driving cumulative risk this low requires driving per-century risk to about 1.6*10-6, barely one in a million.
I'm unclear on what this means. I currently think that humanity has better than a 10-8 chance of surviving the next billion years, so can I just say that "driving cumulative risk at least below 1-10-8" is already done? Is the 1.6*10-6 per-century risk some sort of average of 10 ...
Constant per-century risk is implausible because these are conditional probabilities, conditional on surviving up to that century, which means that they're non-independent.
For example, the probability of surviving the 80th century from now is conditioned on having survived the next 79 centuries. And the worlds where human civilization survives the next 79 centuries are mostly not worlds where we face a 10% chance of extinction risk each century and keep managing to stumble along. Rather, they’re worlds where the per-century probabilities of extinction over...
GiveWell has a 2021 post Why malnutrition treatment is one of our top research priorities, which includes a rough estimate of "a cost of about $2,000 to $18,000 per death averted" through treating "otherwise untreated episodes of malnutrition in sub-Saharan Africa." You can click through to the footnotes and the spreadsheets for more details on how they calculated that.
Is this just showing that the predictions were inaccurate before updating?
I think it's saying that predictions over the lifetime of the market are less accurate for questions where early forecasters disagreed a lot with later forecasters, compared to questions where early forecasters mostly agreed with later forecasters. Which sounds unsurprising.
That improvement of the Metaculus community prediction seems to be approximately logarithmic, meaning that doubling the number of forecasters seems to lead to a roughly constant (albeit probably diminishing) relative improvement in performance in terms of Brier Score: Going from 100 to 200 would give you a relative improvement in Brier score almost as large as when going from 10 to 20 (e.g. an improvement by x percent).
In some of the graphs it looks like the improvement diminishes more quickly than the logarithm, such that (e.g.) going from 100 to 200 give...
I think the correct adjustment would involve multiplying the effect size by something like 1.1 or 1.2. But figuring out the best way to deal with it should involve some combination of looking into this issue in more depth and/or consulting with someone with more expertise on this sort of statistical issue.
This sort of adjustment wouldn't change your bottom-line conclusions that this point estimate for deworming is smaller than the point estimate for StrongMinds, and that this estimate for deworming is not statistically significant, but it would shift some of the distributions & probabilities that you discuss (including the probability that StrongMinds has a larger well-being effect than deworming).
A low reliability outcome measure attenuates the measured effect size. So if researchers measure the effect of one intervention on a high-quality outcome measure, and they measure the effect of another intervention on a lower-quality outcome measure, the use of different measures will inflate the apparent relative impact of the intervention that got higher-quality measurement. Converting different scales into number of SDs puts them all on the same scale, but doesn't adjust for this measurement issue.
For example, if you have a continuous outcome measure an...
Intelligence 1: Individual cognitive abilities.
Intelligence 2: The ability to achieve a wide range of goals.
Eliezer Yudkowsky means Intelligence 2 when he talks about general intelligence. e.g., He proposed "efficient cross-domain optimization" as the definition in his post by that name. See the LW tag page for General Intelligence for more links & discussion.
Could you post something closer to the raw survey data, in addition to the analysis spreadsheet linked in the summary section? I'd like to see something that:
- Has data organized by respondent (a row of data for each respondent)
- Shows the number given by the respondent, before researcher adjustments (e.g., answers of 0 are shown as "0" and not as ".01") (it's fine for it to show the numbers that you get after data cleaning which turns "50%" and "50" into "0.5")
- Includes each person's 6 component estimates, along with a few other variables like their dire
The numbers that you get from this sort of exercise will depend heavily on which people you get estimates from. My guess is that which people you include matters more than what you do with the numbers that they give you.
If the people who you survey are more like the general public, rather than people around our subcultural niche where misaligned AI is a prominent concern, then I expect you'll get smaller numbers.
Whereas, in Rob Bensinger's 2021 survey of "people working on long-term AI risk", every one of the 44 people who answered the survey gave an estim...
If the estimates for the different components were independent, then wouldn't the distribution of synthetic estimates be the same as the distribution of individual people's estimates?
Multiplying Alice's p1 x Bob's p2 x Carol's p3 x ... would draw from the same distribution as multiplying Alice's p1 x Alice's p2 x Alice's p3 ... , if estimates to the different questions are unrelated.
So you could see how much non-independence affects the bottom-line results just by comparing the synthetic distribution with the distribution of individual estimates (treating ...
Does the table in section 3.2 take the geometric mean for each of the 6 components?
From footnote 7 it looks like it does, but if it does then I don't see how this gives such a different bottom line probability from the synthetic method geomean in section 4 (18.7% vs. 1.65% for all respondents). Unless some probabilities are very close to 1, and those have a big influence on the numbers in the section 3.2 table? Or my intuitions about these methods are just off.
Have you looked at how sensitive this analysis is to outliers, or to (say) the most extreme 10% of responses on each component?
The recent Samotsvety nuclear risk estimate removed the largest and smallest forecast (out of 7) for each component before aggregating (the remaining 5 forecasts) with the geometric mean. Would a similar adjustment here change the bottom line much (for the single probability and/or the distribution over "worlds")?
The prima facie case for worrying about outliers actually seems significantly stronger for this survey than for an org l...
I had not thought to do that, and it seems quite sensible (I agree with your point about prima facie worry about low outliers). The results are below.
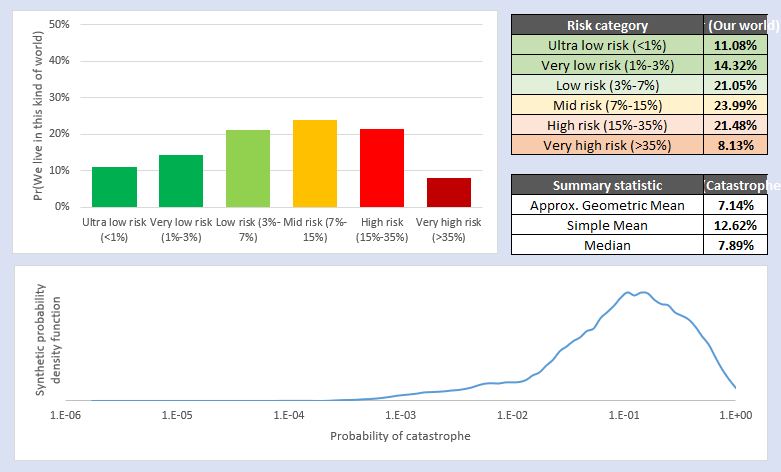
To my eye, the general mechanism I wanted to defend about is preserved (there is an asymmetric probability of finding yourself in a low-risk world), but the probability of finding yourself in an ultra-low-risk world has significantly lowered, with that probability mass roughly redistributing itself around the geometric mean (which itself has gone up to 7%-ish)
In some sense this isn't totally surprising - remo...
A passage from Superforecasting:
...Flash back to early 2012. How likely is the Assad regime to fall? Arguments against a fall include (1) the regime has well-armed core supporters; (2) it has powerful regional allies. Arguments in favor of a fall include (1) the Syrian army is suffering massive defections; (2) the rebels have some momentum, with fighting reaching the capital. Suppose you weight the strength of t
Two empirical reasons not to take the extreme scope neglect in studies like the 2,000 vs 200,000 birds one as directly reflecting people's values.
First, the results of studies like this depend on how you ask the question. A simple variation which generally leads to more scope sensitivity is to present the two options side by side, so that the same people would be asked both about 2,000 birds and about the 200,000 birds (some call this "joint evaluation" in contrast to "separate evaluation"). Other variations also generally produce more scope sensitive resu...
It would be interesting whether the forecasters with outlier numbers stand by those forecasts on reflection, and to hear their reasoning if so. In cases where outlier forecasts reflect insight, how do we capture that insight rather than brushing them aside with the noise? Checking in with those forecasters after their forecasts have been flagged as suspicious-to-others is a start.
The p(month|year) number is especially relevant, since that is not just an input into the bottom line estimate, but also has direct implications for individual planning. The plan ...
These numbers seem pretty all-over-the-place. On nearly every question, the odds given by the 7 forecasters span at least 2 orders of magnitude, and often substantially more. And the majority of forecasters (4/7) gave multiple answers which seem implausible (details below) in ways that suggest that their numbers aren't coming from a coherent picture of the situation.
I have collected the numbers in a spreadsheet and highlighted (in red) the ones that seem implausible to me.
Odds span at least 2 orders of magnitude:
Another commenter noted that the answers to ...
The Less Wrong posts Politics as Charity from 2010 and Voting is like donating thousands of dollars to charity from November 2012 have similar analyses to the 2020 80k article.
Agreed that there are some contexts where there's more value in getting distributions, like with the Fermi paradox.
Or, before the grants are given out, you could ask people to give an ex ante distribution for "what will be your ex post point estimate of the value of this grant?" That feeds directly into VOI calculations, and it is clearly defined what the distribution represents. But note that it requires focusing on point estimates ex post.
I think it would've been better to just elicit point estimates of the grants' expected value, rather than distributions. Using distributions adds complexity, for not much benefit, and it's somewhat unclear what the distributions even represent.
Added complexity: for researchers giving their elicitations, for the data analysis, for readers trying to interpret the results. This can make the process slower, lead to errors, and lead to different people interpreting things differently. e.g., For including both positive & negative numbers in the distributions...
In the table with post-discussion distributions, how is the lower bound of the aggregate distribution for the Open Phil AI Fellowship -73, when the lowest lower bound for an individual researcher is -2.4? Also in that row, Researcher 3's distribution is given as "250 to 320", which doesn't include their median (35) and is too large for a scale that's normalized to 100.
There are several different sorts of systematic errors that you could look for in this kind of data, although checking for them requires including more features of each prediction than the ones that are here.
For example, to check for optimism bias you'd want to code whether each prediction is of the form "good thing will happen", "bad thing will happen", or neither. Then you can check if probabilities were too high for "good thing will happen" predictions and too low for "bad thing will happen" predictions. (Most of the example predictions were "good thing...
Pardon my negativity, but I get the impression that you haven't thought through your impact model very carefully.
In particular, the structure where
Every week, an anonymous team of grantmakers rank all participants, and whoever accomplished the least morally impactful work that week will be kicked off the island.
is selecting for mediocrity.
Given fat tails, I expect more impact to come from the single highest impact week than from 36 weeks of not-last-place impact.
Perhaps for the season finale you could bring back the contestant who had the highest imp...
The appendix of the ebook (pdf, p. 218 & 221) suggests structuring it like tax brackets, giving (as a percentage of adjusted gross income):