Gregory Lewis🔸
Bio
Mostly bio, occasionally forecasting/epistemics, sometimes stats/medicine, too often invective.
Posts 21
Comments315
Given Lidl literally sued Biedronka to get bailiffs to seize advertising billboards by Beidronka against them in 2024, and the price war between the chains, I don't see many signs of agreement or kayfabe in this competition.
Regardless, the underlying competition in these adversarial advertising campaigns is genuine: Pepsi and Coke (e.g.) want each other's market share for themselves. Here things seem more like two parties A & B collude where B poses as a competitor to A, intending the subsequent playfight between them to be in both A & B's mutual advantage (at least that is what Farmkind intended, notwithstanding they flubbed both the 'collude with A' and 'mutually advantageous playfight' steps of the plan).
I think most countries antitrust regulators (etc.) would raise an eyebrow at this sort of thing. I am sure it is generally regarded as a dirty trick in the marketplace of ideas (cf. I pay a fellow vegan to build up a media presence as an anti-vegan advocate, only to sandbag in a public debate with me where I trounce them, and publicly convert (back) to veganism).
I think the biggest problem with Farmkind's campaign is that it was fundamentally manipulative and insincere.
As I read it, the grand plan here was to pretend to trash Veganuary to 'bait' (your words) a lot of media engagement around this kayfabe controversy, and parlay this into a marquee presentation where the harvested eyeballs discover "we're actually all friends here, let us pitch you on different ways of helping animals!"
The wider world tends to have allergic reactions to 'controlled opposition', 'audience plant', and related stunts, and so should we. I confess the fact that this one backfired in large part because you tricked too many people (including your allies) too well strikes me as a fitting comeuppance.
I'd say my views now are roughly the same now as they were then. Perhaps a bit milder, although I am not sure how much of this is "The podcast was recorded at a time I was especially/?unduly annoyed at particular EA antics which coloured my remarks despite my best efforts (such as they were, and alas remain) at moderation" (the complements in the pre-amble to my rant were sincere; I saw myself as hectoring a minority), vs. "Time and lapses of memory have been a salve for my apoplexy---but if I could manage a full recounting, I would reprise my erstwhile rage".
But at least re. epistemic modesty vs. 'EA/rationalist exceptionalism', what ultimately decisive is overall performance: ~"Actually, we don't need to be all that modest, because when we strike out from "expert consensus" or hallowed authorities, we tend to be proven right". Litigating this is harder still than re. COVID specifically (even if 'EA land' spanked 'credentialed expertise land' re. COVID, its batting average across fields could still be worse, or vice versa),
Yet if I was arguing against my own position, what happened during COVID facially looks like fertile ground to make my case. Perhaps it would collapse on fuller examination, but certainly doesn't seem compelling evidence in favour of my preferred approach on its face.
FWIW, it's unclear to me how persuasive COVID-19 is as a motivating case for epistemic modesty. I can also recall plenty of egregious misses from public health/epi land, and I expect re-reading the podcast transcript would remind me of some of my own.
On the other hand, the bar would be fairly high: I am pretty sure both EA land and rationalist land had edge over the general population re. COVID. Yet the main battle would be over whether they had 'edge generally' over 'consensus/august authorities'.
Adjudicating this seems murky, with many 'pick and choose' factors ('reasonable justification for me, desperate revisionist cope for thee', etc.) if you have a favoured team you want to win. To skim a few:
- There are large 'blobs' on both sides, so you can pick favourable/unfavourable outliers for any given 'point' you want to score. E.g. I recall in the early days some rationalists having homebrew 'grocery sterilization procedures', and EA buildings applying copper tape, so PH land wasn't alone in getting transmission wrong at first. My guess is in aggregate EA/rationalist land corrected before the preponderance of public health (so 1-0 to them), but you might have to check the (internet) tape on what stuff got pushed and abandoned when.
- Ditto picking and choosing what points to score, how finely to individuate them, or how to aggregate (does the copper tape fad count as a 'point to PH' because they generally didn't get on board as it cancels out all the stuff on handwashing - so 1-1? Or much less as considerably less consequential - 2-1, and surely they were much less wrong about droplets etc., so >3-1?). "Dumbest COVID policies canvassed across the G7 vs. most perceptive metaculus comments" is a blowout, but so too "Worst 'in house' flailing vs. Singapore".
- Plenty of epistemic dark matter to excuse misses. Maybe the copper tape thing was just an astute application of precaution under severe uncertainty (or even mechanistically superior/innovative 'hedging' for transmission route vs. PH-land 'Wash your hands!!') Or maybe 'non-zero COVID' was the right call ex-ante, and the success stories which locked down until vaccine deployment were more 'lucky' (re. vaccines arriving soon enough and the early variants of COVID being NPI-suppressible enough before then) than 'good' (fairly pricing the likelihood of this 'out' and correctly assessing it was worth 'playing to').
- It is surprisingly hard for me to remember exactly what I 'had in mind' for some of my remarks at-the-time, despite the advantage being able to read exactly what I said, and silent variations (e.g, subjective credence behind 'maybe' or mentioning, rationale) would affect the 'scoring' a lot. I expect I would fare much worse in figuring this out for others, still less 'prevailing view of [group] at [date]'
- Plenty of bulveristic stories to dismiss hits as 'you didn't deserve to be right'. "EAs and rationalists generally panicked and got tilted off the face of the planet during COVID, so always advocated for maximal risk aversion - they were sometimes right, but seldom truth-tracking"/ "Authorities tended staid, suppressive of any inconvenient truths, and ineffectual, and got lucky when no action was the best option as well as the default outcome."
- Sometimes what was 'proven right' ex post remains controversial.
For better or worse, I still agree with my piece on epistemic modesty, although perhaps I find myself an increasing minority amongst my peers.
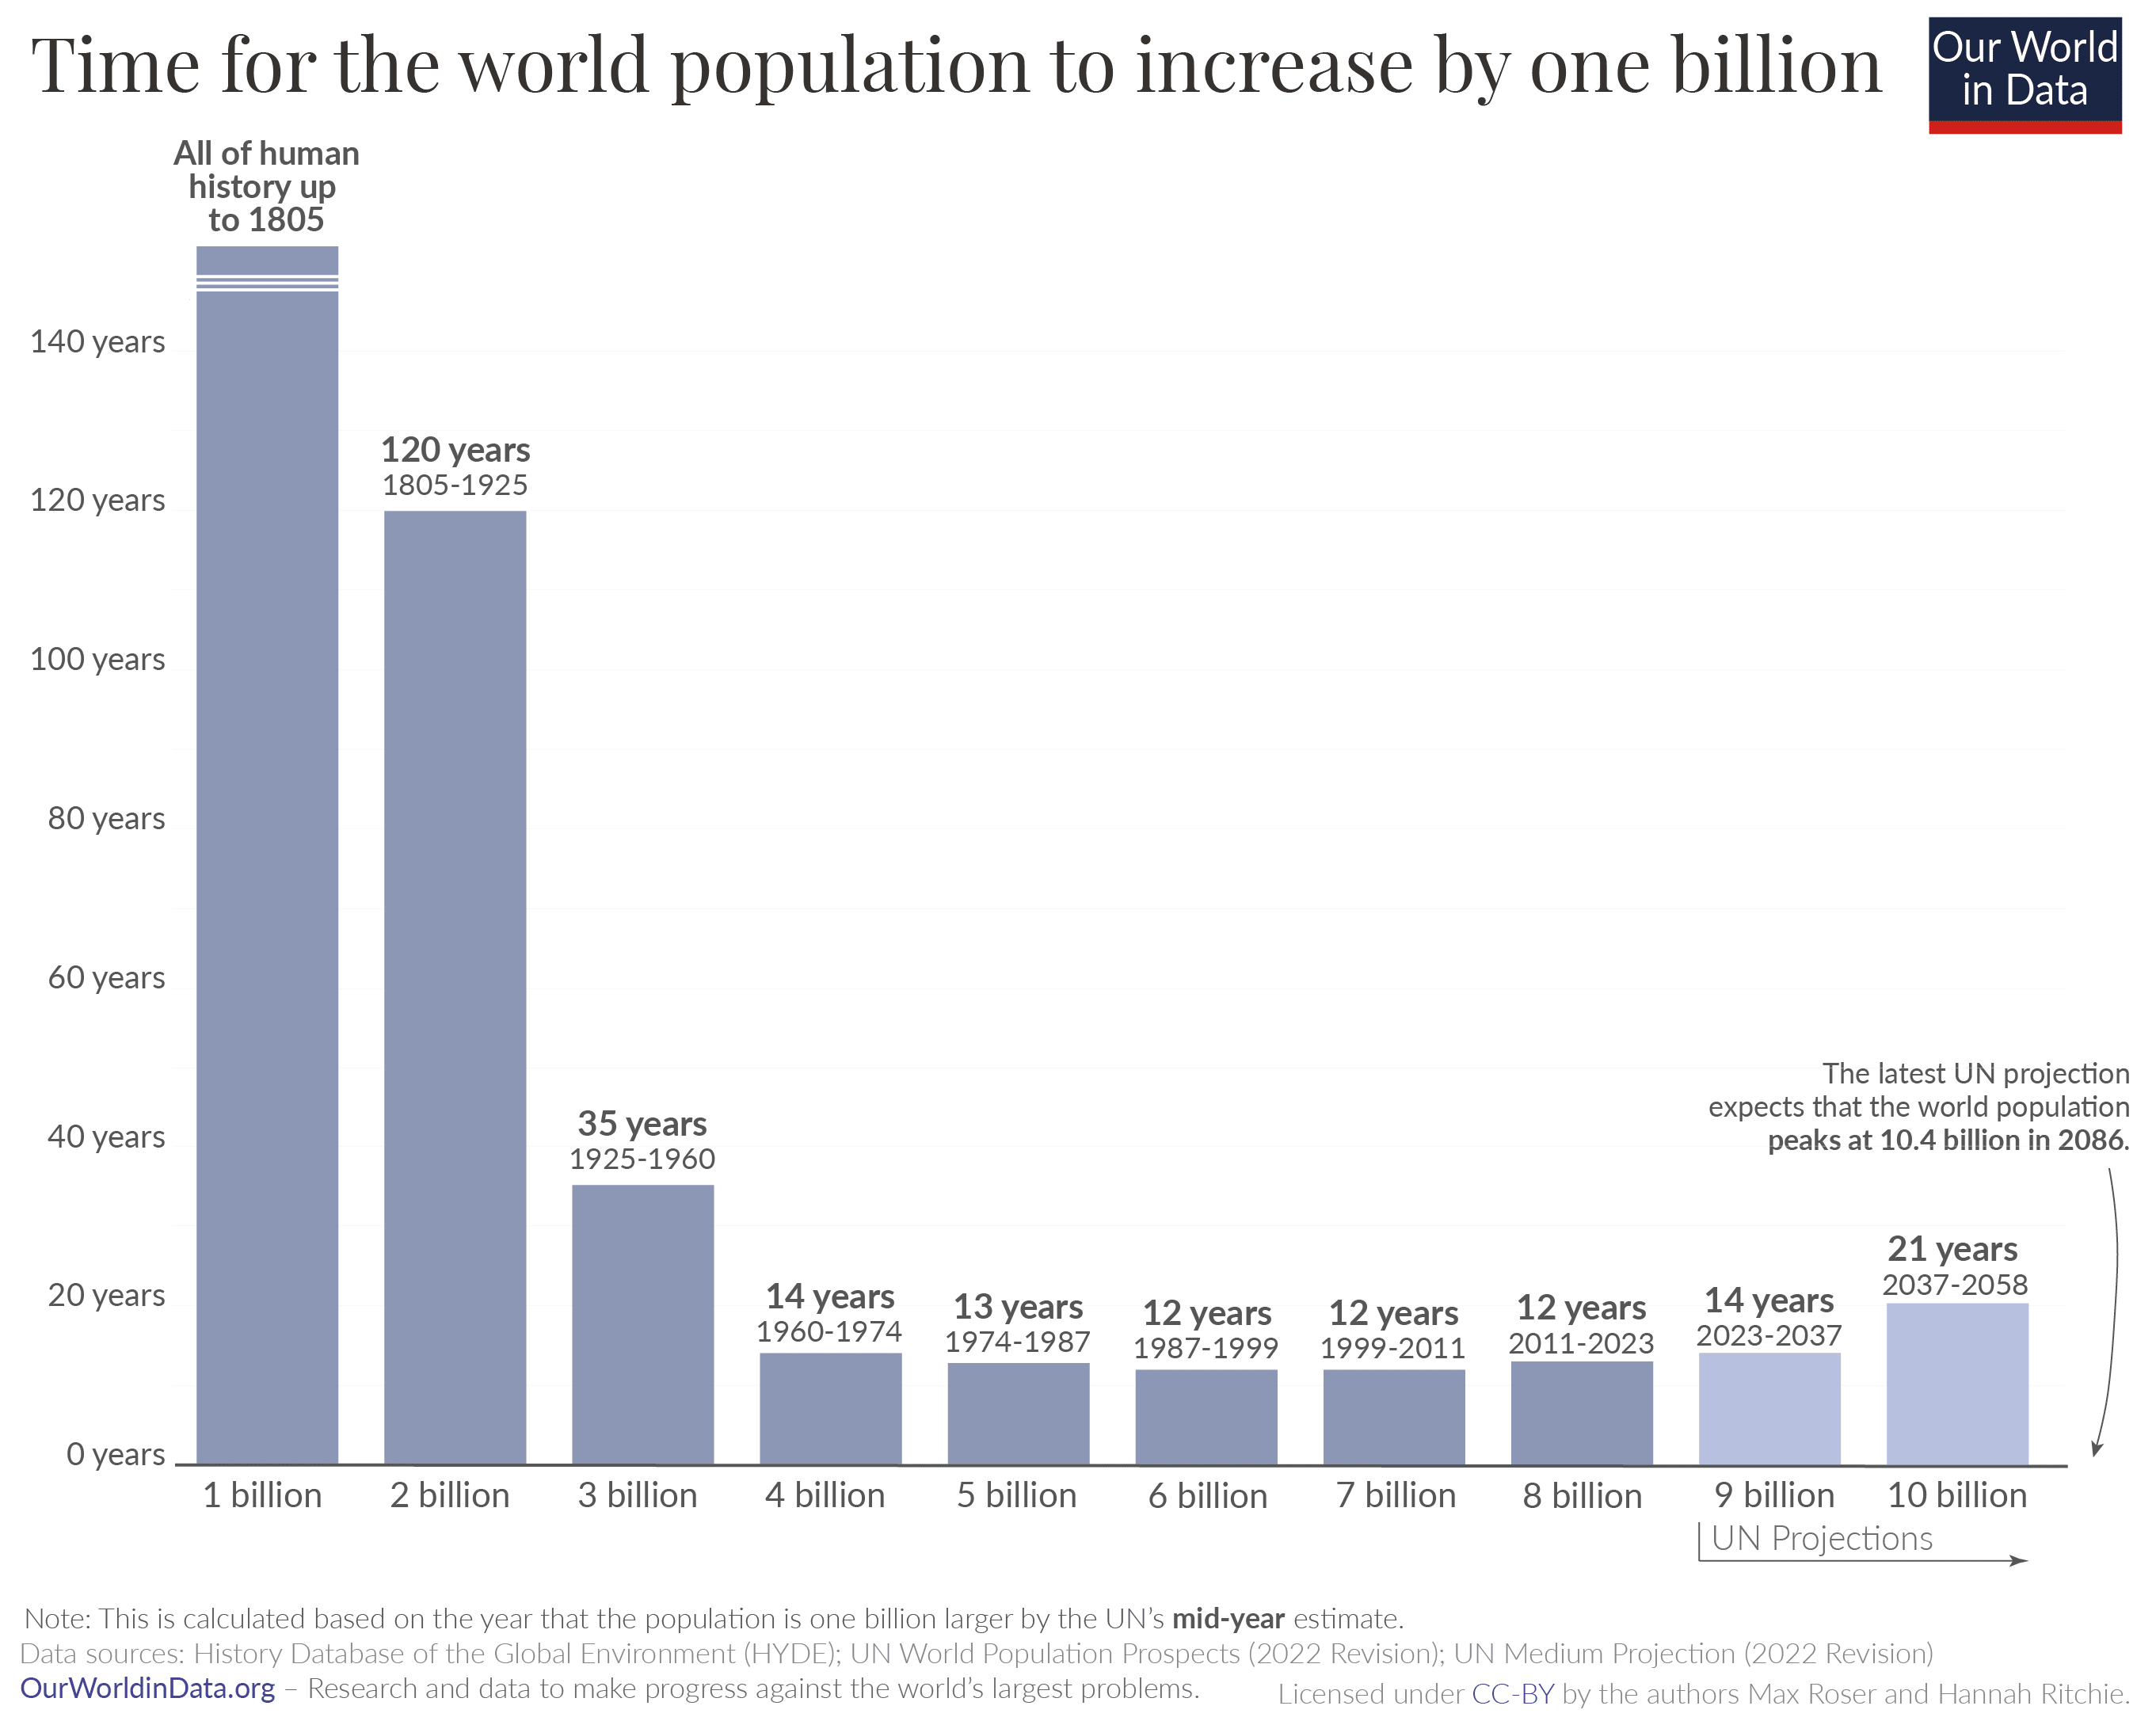
It has? The empirical track record has been slowing global population growth, which peaked 60 years ago:
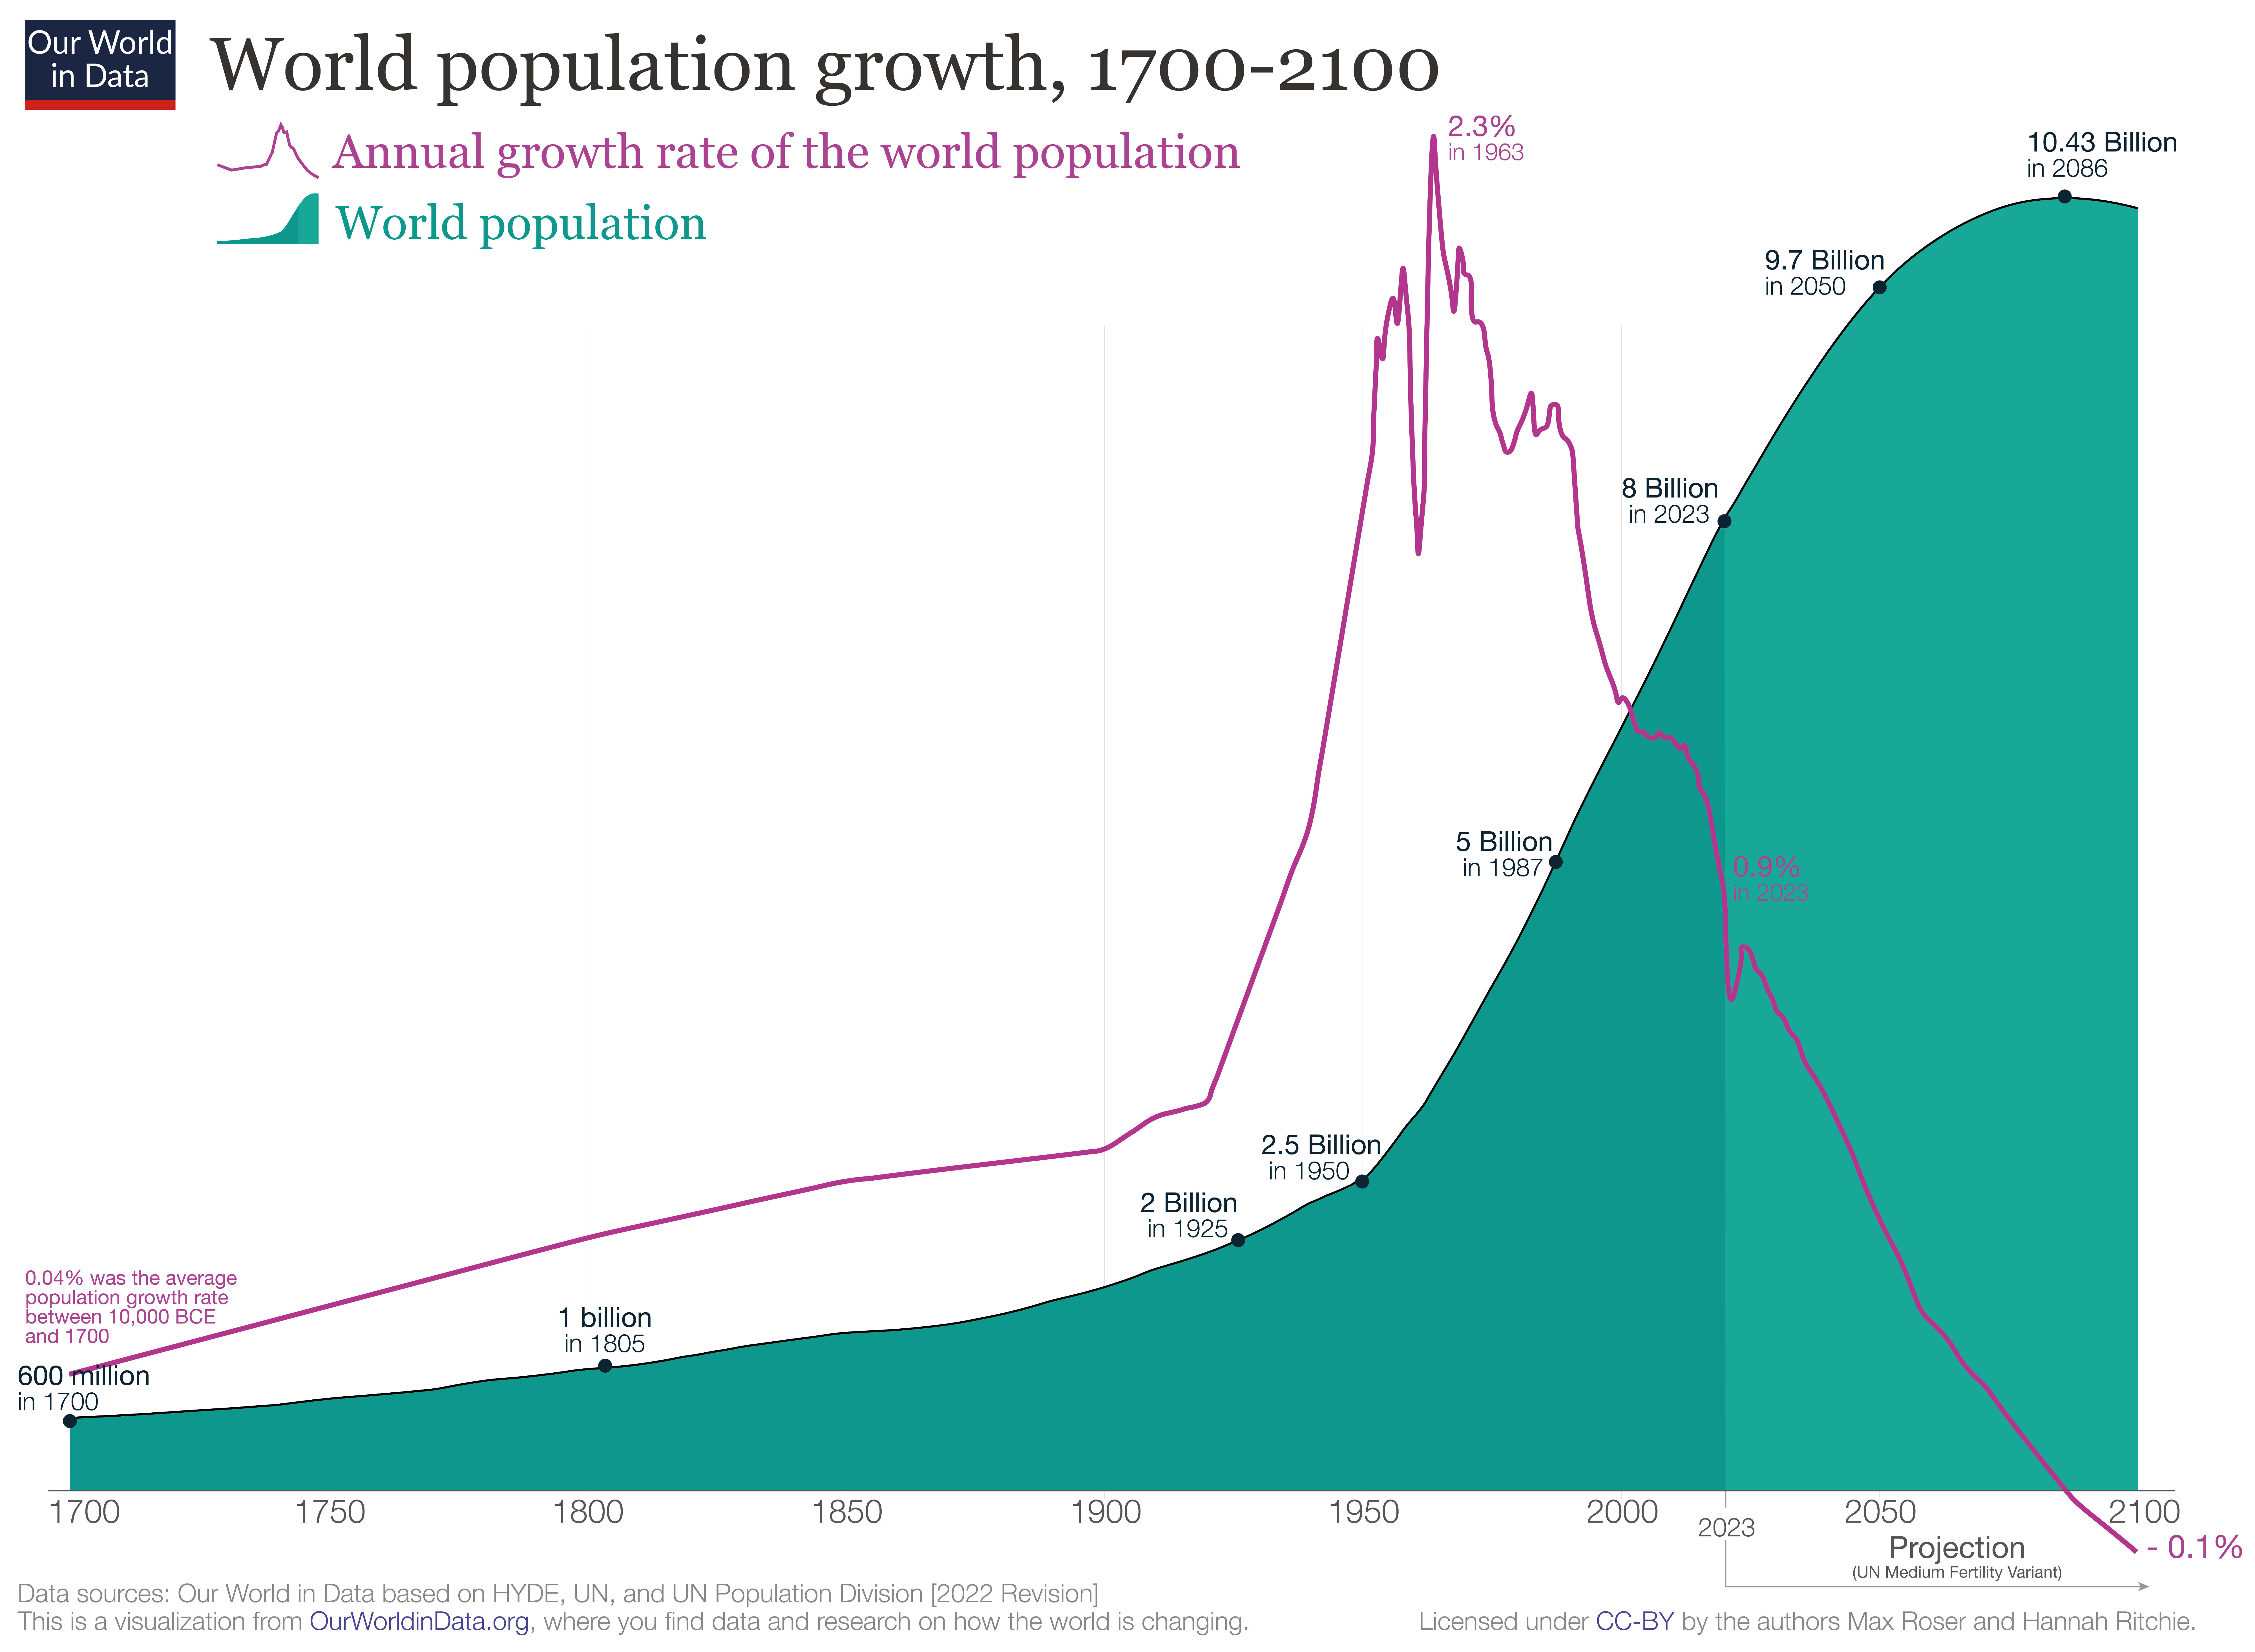
The population itself also looks pretty linear for the last 60 years, given 1B/~12 years rate:
#
I think the general story is something like this:
- The (observable) universe is a surprisingly small place when plotted on a log scale. Thus anything growing exponentially will hit physical ceilings if projected forward long enough: a population of 1000 humans growing at 0.9% pa roughly equal the number of atoms in the universe after 20 000 years.
- (Even uploading digital humans onto computronium only gets you a little further on the log scale: after 60 000 years our population has grown to 2E236, so ~E150 people per atom, and E50 per planck volume. If that number is not sufficiently ridiculous, just let the growth run for a million more years and EE notation starts making sense (10^10^x).)
- There are usually also 'practical' ceilings which look implausible to reach long before you've exhausted the universe: "If this stock keeps doubling in value, this company would be 99% of the global market cap in X years", "Even if the total addressable consumer market is the entire human population, people aren't going to be buying multiple subscriptions to Netflix each.", etc.
- So ~everything is ultimately an S-curve. Yet although 'this trend will start capping out somewhere' is a very safe bet, 'calling the inflection point' before you've passed it is known to be extremely hard. Sigmoid curves in their early days are essentially indistinguishable from exponential ones, and the extra parameter which ~guarantees they can better (over?)fit the points on the graph than a simple exponential give very unstable estimates of the putative ceiling the trend will 'cap out' at. (cf. 1, 2.)
- Many important things turn on (e.g.) 'scaling is hitting the wall ~now' vs. 'scaling will hit the wall roughly at the point of the first dyson sphere data center' As the universe is a small place on a log scale, this range is easily spanned by different analysis choices on how you project forward.
- Without strong priors on 'inflecting soon' vs. 'inflecting late', forecasts tend to be volatile: is this small blip above or below trend really a blip, or a sign we're entering a faster/slow regime?
- (My guess is the right ur-prior favours 'inflecting soon' weakly and in general, although exceptions and big misses abound. In most cases, you have mechanistic steers you can appeal to which give much more evidence. I'm not sure AI is one of them, as it seems a complete epistemic mess to me.)
I think less selective quotation makes the line of argument clear.
Continuing the first quote:
The scenario in the short story is not the median forecast for any AI futures author, and none of the AI2027 authors actually believe that 2027 is the median year for a singularity to happen. But the argument they make is that 2027 is a plausible year, and they back it up with images of sophisticated looking modelling like the following:
[img]
This combination of compelling short story and seemingly-rigorous research may have been the secret sauce that let the article to go viral and be treated as a serious project:
[quote]
Now, I was originally happy to dismiss this work and just wait for their predictions to fail, but this thing just keeps spreading, including a youtube video with millions of views. So I decided to actually dig into the model and the code, and try to understand what the authors were saying and what evidence they were using to back it up.
The article is huge, so I focussed on one section alone: their “timelines forecast” code and accompanying methodology section. Not to mince words, I think it’s pretty bad. It’s not just that I disagree with their parameter estimates, it’s that I think the fundamental structure of their model is highly questionable and at times barely justified, there is very little empirical validation of the model, and there are parts of the code that the write-up of the model straight up misrepresents.
So the summary of this would not be "... and so I think AI 2027 is a bit less plausible than the authors do", but something like: "I think the work motivating AI 2027 being a credible scenario is, in fact, not good, and should not persuade those who did not believe this already. It is regrettable this work is being publicised (and perhaps presented) as much stronger than it really is."
Continuing the second quote:
What I’m most against is people taking shoddy toy models seriously and basing life decisions on them, as I have seen happen for AI2027. This is just a model for a tiny slice of the possibility space for how AI will go, and in my opinion it is implemented poorly even if you agree with the author's general worldview.
The right account for decision making under (severe) uncertainty is up for grabs, but in the 'make a less shoddy toy model' approach the quote would urge having a wide ensemble of different ones (including, say, those which are sub-exponential, 'hit the wall' or whatever else), and further urge we should put very little weight on the AI2027 model in whatever ensemble we will be using for important decisions.
Titotal actually ended their post with an alternative prescription:
I think people are going to deal with the fact that it’s really difficult to predict how a technology like AI is going to turn out. The massive blobs of uncertainty shown in AI 2027 are still severe underestimates of the uncertainty involved. If your plans for the future rely on prognostication, and this is the standard of work you are using, I think your plans are doomed. I would advise looking into plans that are robust to extreme uncertainty in how AI actually goes, and avoid actions that could blow up in your face if you turn out to be badly wrong.
An update:
I'll donate 5k USD if the Ozler RCT reports an effect size greater than d = 0.4 - 2x smaller than HLI's estimate of ~ 0.8, and below the bottom 0.1% of their monte carlo runs.
This RCT (which should have been the Baird RCT - my apologies for mistakenly substituting Sarah Baird with her colleague Berk Ozler as first author previously) is now out.
I was not specific on which effect size would count, but all relevant[1] effect sizes reported by this study are much lower than d = 0.4 - around d = 0.1. I roughly[2] calculate the figures below.
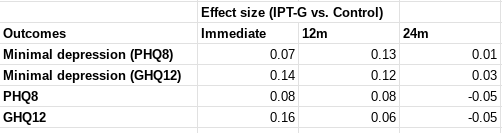
In terms of "SD-years of depression averted" or similar, there are a few different ways you could slice it (e.g. which outcome you use, whether you linearly interpolate, do you extend the effects out to 5 years, etc). But when I play with the numbers I get results around 0.1-0.25 SD-years of depression averted per person (as a sense check, this lines up with an initial effect of ~0.1, which seems to last between 1-2 years).
These are indeed "dramatically worse results than HLI's [2021] evaluation would predict". They are also substantially worse than HLI's (much lower) updated 2023 estimates of Strongminds. The immediate effects of 0.07-0.16 are ~>5x lower than HLI's (2021) estimate of an immediate effect of 0.8; they are 2-4x lower than HLI's (2023) informed prior for Strongminds having an immediate effect of 0.39. My calculations of the total effect over time from Baird et al. of 0.1-0.25 SD-years of depression averted are ~10x lower than HLI's 2021 estimate of 1.92 SD-years averted, and ~3x lower than their most recent estimate of ~0.6.
Baird et al. also comment on the cost-effectiveness of the intervention in their discussion (p18):
Unfortunately, the IPT-G impacts on depression in this trial are too small to pass a
cost-effectiveness test. We estimate the cost of the program to have been approximately USD 48 per individual offered the program (the cost per attendee was closer to USD 88). Given impact estimates of a reduction in the prevalence of mild depression of 0.054 pp for a period of one year, it implies that the cost of the program per case of depression averted was nearly USD 916, or 2,670 in 2019 PPP terms. An oft-cited reference point estimates that a health intervention can be considered cost-effective if it costs approximately one to three times the GDP per capita of the relevant country per Disability Adjusted Life Year (DALY) averted (Kazibwe et al., 2022; Robinson et al., 2017). We can then convert a case of mild depression averted into its DALY equivalent using the disability weights calculated for the Global Burden of Disease, which equates one year of mild depression to 0.145 DALYs (Salomon et al., 2012, 2015). This implies that ultimately the program cost USD PPP (2019) 18,413 per DALY averted. Since Uganda had a GDP per capita USD PPP (2019) of 2,345, the IPT-G intervention cannot be considered cost-effective using this benchmark.
I'm not sure anything more really needs to be said at this point. But much more could be, and I fear I'll feel obliged to return to these topics before long regardless.
- ^
The report describes the outcomes on p.10:
The primary mental health outcomes consist of two binary indicators: (i) having a Patient Health Questionnaire 8 (PHQ-8) score ≤ 4, which is indicative of showing no or minimal depression (Kroenke et al., 2009); and (ii) having a General Health Questionnaire 12 (GHQ-12) score < 3, which indicates one is not suffering from psychological distress (Goldberg and Williams, 1988). We supplement these two indicators with five secondary outcomes: (i) The PHQ-8 score (range: 0-24); (ii) the GHQ-12 score (0-12); (iii) the score on the Rosenberg self-esteem scale (0-30) (Rosenberg, 1965); (iv) the score on the Child and Youth Resilience Measure-Revised (0-34) (Jefferies et al., 2019); and (v) the locus of control score (1-10). The discrete PHQ-8 and GHQ-12 scores allow the assessment of impact on the severity of distress in the sample, while the remaining outcomes capture several distinct dimensions of mental health (Shah et al., 2024).
Measurements were taken following treatment completion ('Rapid resurvey'), then at 12m and 24m thereafer (midline and endline respectively).
I use both primary indicators and the discrete values of the underlying scores they are derived from. I haven't carefully looked at the other secondary outcomes nor the human capital variables, but besides being less relevant, I do not think these showed much greater effects.
- ^
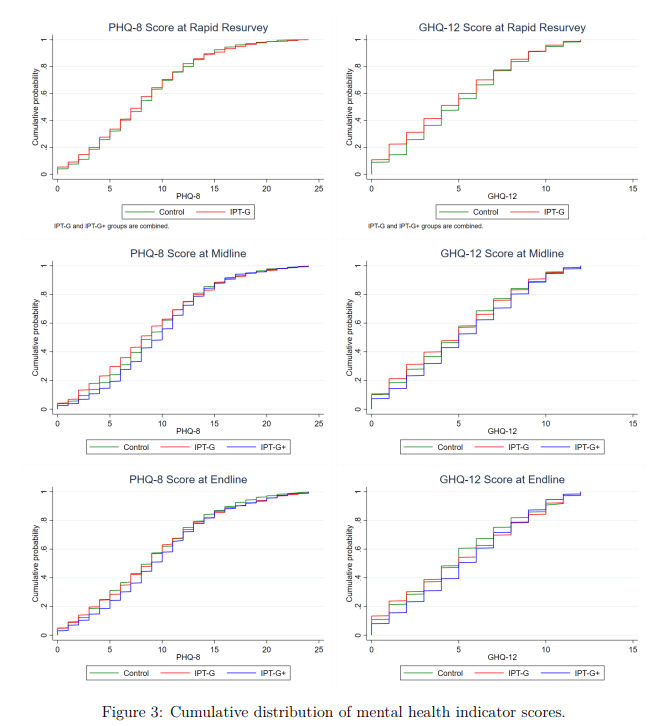
I.e. I took the figures from Table 6 (comparing IPT-G vs. control) for these measures and plugged them into a webtool for Cohen's h or d as appropriate. This is rough and ready, although my calculations agree with the effect sizes either mentioned or described in text. They also pass an 'eye test' of comparing them to the cmfs of the scores in figure 3 - these distributions are very close to one another, consistent with small-to-no effect (one surprising result of this study is IPT-G + cash lead to worse outcomes than either control or IPT-G alone):
One of the virtues of this study is it includes a reproducibility package, so I'd be happy to produce a more rigorous calculation directly from the provided data if folks remain uncertain.
I think the principal challenge for an independent investigation is getting folks with useful information to disclose it, given these people will usually (to some kind and degree) also have 'exposure' to the FTX scandal themselves.
If I was such a person I would expect working with the investigation would be unpleasant, perhaps embarrassing, plausibly acrimonious, and potentially disastrous for my reputation. What's in it for me?
I am also sure Farmkind was genuinely trying to do good. But I do think these sorts of schemes warrant calling out with some small degree of ire.
Although my vision may be jaundiced, this case fits a pattern of some folks in animal advocacy being willing to be somewhat-worse-than-spotless in terms of integrity or candour in the hopes of securing some tactical advantage (cf.).
I think heading in the direction of treating non-animal advocates (within or without EA) as "legitimate targets for influence operations" rather than "fellow moral interlocutors" is unwise. Besides being unwise in the immediate "you weren't as clever as you thought you were and it blew up in your face", it also errs in terms of more insidious pollution of commons helpful for folks to coordinate on figuring out what is best to do, and cooperate in doing it.
Thus I hope the lesson learned is, "avoid kind-of manipulative or insincere advocacy", not, "get better at pulling it off". Unfortunately, if it has, it is not readily apparent in the OP, given its reflections focus on first-order consequences and better coordination with other EAAs.