Vasco Grilo🔸
Bio
Participation4
I am a generalist quantitative researcher. I am open to volunteering and paid work. I welcome suggestions for posts. You can give me feedback here (anonymously or not).
How others can help me
I am open to volunteering and paid work. I welcome suggestions for posts. You can give me feedback here (anonymously or not).
How I can help others
I can help with career advice, prioritisation, and quantitative analyses.
Posts 254
Comments3231
Topic contributions42
In addition, in allometry, "the study of the relationship of body size to shape,[1] anatomy, physiology and behaviour", "The relationship between the two measured quantities is often expressed as a power law equation (allometric equation)".
From the book "Scale: The Universal Laws of Growth, Innovation, Sustainability, and the Pace of Life in Organisms, Cities, Economies, and Companies" by Geoffrey West:
This scaling law for metabolic rate [this one], known as Kleiber’s law after the biologist who first articulated it, is valid across almost all taxonomic groups, including mammals, birds, fish, crustacea, bacteria, plants, and cells [see this section of my linkpost for further discussion]. Even more impressive, however, is that similar scaling laws hold for essentially all physiological quantities and life-history events, including growth rate, heart rate, evolutionary rate, genome length, mitochondrial density, gray matter in the brain, life span, the height of trees and even the number of their leaves. Furthermore, when plotted logarithmically this dizzying array of scaling laws all look like Figure 1 and therefore have the same mathematical structure. They are all “power laws” and are typically governed by an exponent (the slope of the graph), which is a simple multiple of ¼, the classic example being the ¾ for metabolic rate. So, for example, if the size of a mammal is doubled, its heart rate decreases by about 25 percent. The number 4 therefore plays a fundamental and almost magically universal role in all of life.13
Footnote 13:
There are several excellent texts summarizing the various allometric scaling laws in biology. Among them are: W. A. Calder, Size, Function and Life History (Cambridge, MA: Harvard University Press, 1984); E. L. Charnov, Life History Invariants (Oxford, UK: Oxford University Press, 1993); T. A. McMahon and J. T. Bonner, On Size and Life (New York: Scientific American Library, 1983); R. H. Peters, The Ecological Implications of Body Size (Cambridge, UK: Cambridge University Press, 1986); K. Schmidt-Nielsen, Why Is Animal Size So Important? (Cambridge, UK: Cambridge University Press, 1984).
Hello. Thanks for sharing. Yesterday I created a WhatsApp group for people interested in effective altruism in Porto. It is under the WhatsApp community Effective Altruism and Rationality Portugal, where I just shared the post above.
You may want to add deadlines for submitting the application forms, and consider having a single form for all applications (where people can specify the location they are interested in).
I am very uncertain about whether decreasing the number of farmed animals increases or decreases animal welfare (in expectation) due to potentially dominant effects on soil invertebrates. In addition, I worry decreasing the number of farmed animals may prevent some from having positive lives.
Hi David. Great post. I broadly agree. Relatedly, readers may be interested in the post AI Welfare Is (Frankfurtian) Bullshit.
I sometimes felt you were implying "no evidence" when I thought something closer to "very weak evidence" would be more appropriate. However, in practice, I would agree the focus should overwhelmingly be on decreasing the uncertainty about the extent to which AI models have welfare, and how to measure it.
I don't find this convincing. (NB: I'm still working on this response.) Even if the talker has no access to the valenced consciousness, it's model may simply lead it to a confident and wrong answer about this.
Did you mean "If" instead of "Even if"?
Wha tmight
Nitpick. "What might".
Hi Aïda. That makes sense. However, I think the reasons you mentioned sometimes play against increasing animal welfare. Poorer welfare standards tend to have a lower carbon and land footprint.
Hi Phalox. Thanks for the comment. You may be interested in my post "Insecticide-treated nets [ITNs] significantly harm mosquitoes, but one can easily offset this?", where I compared the effects of ITNs on humans and mosquitoes.
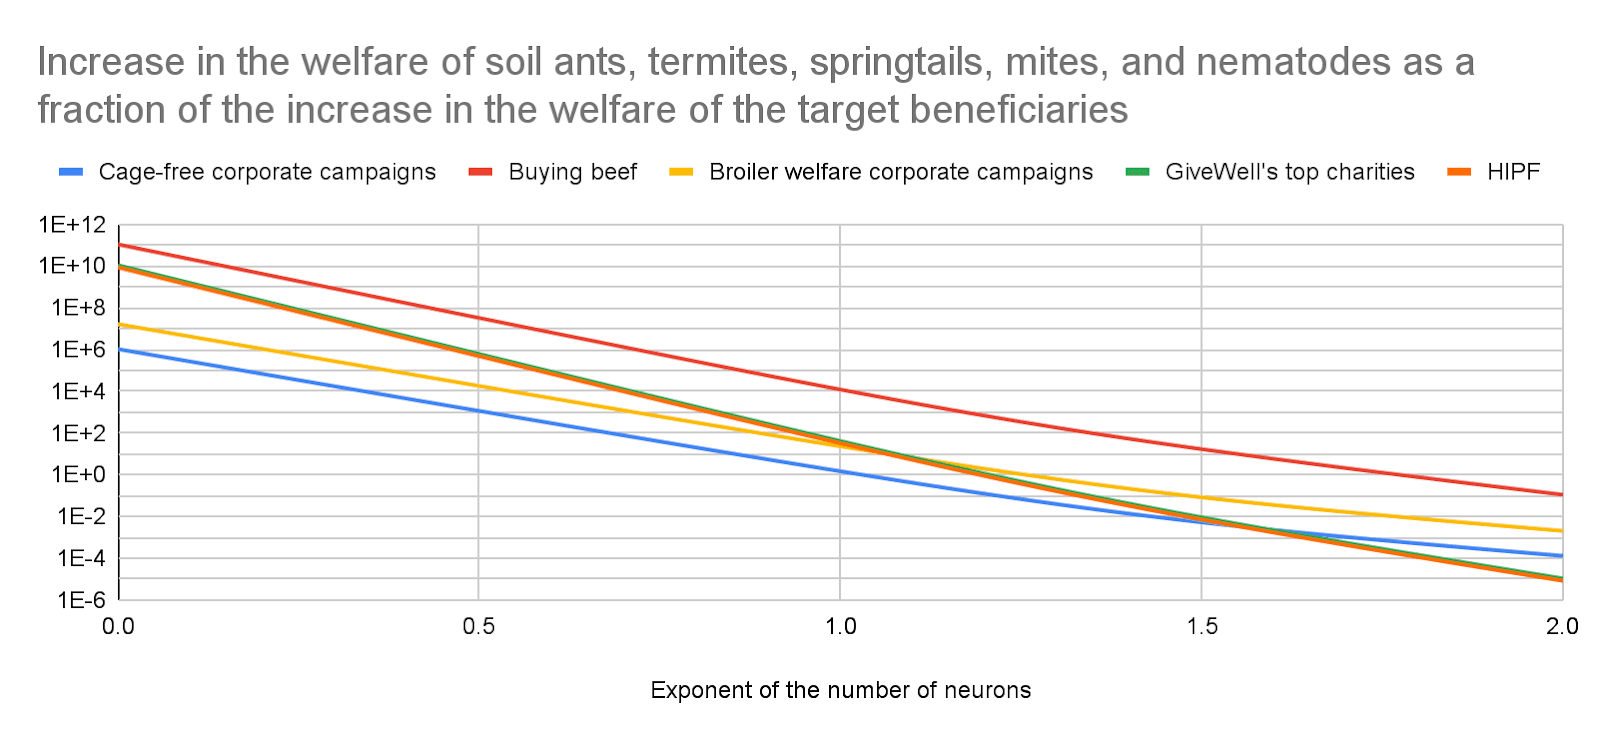
Relatedly, saving human lives also affects soil invertebrates due to resulting in more agricultural land to feed the people who are saved, and I think the effects on soil invertebrates may be much larger or smaller than the benefits to humans. I calculate that GiveWell's top charities change the living time of soil invertebrates by 539 M animal-years per $, and that of soil arthropods by 10.8 M animal-years per $. As illustrated in the graph below, I estimate such charities may change the welfare of soil invertebrates much more or less than they they benefit humans. The title of graph says "Increase in the welfare", not "Change in the welfare", because I assumed expanding agricultural land increases the welfare of soil invertebrates, but I am very uncertain about this. The estimates below suppose welfare per fully-healthy-animal-year is proportional to "individual number of neurons"^"exponent". An exponent between 0 and 2 covers the best guesses that I consider reasonable.
Hi Jasmine. I very much agree we should not assume AI welfare will never be measurable. On the other hand, I believe acting as if AIs have welfare makes less sense for greater uncertainty about their welfare, and how to measure it. I think more uncertainty generally implies efforts to decrease it have a greater value of information. I would say uncertainty is currently very large. So I would overwhelmingly focus on decreasing it instead of acting as if AIs have welfare.
I mostly had this section in mind. I think the positive correlation between hedonic welfare and reported seemingly honest preferences in humans provides some weak evidence that there is such a correlation for AIs. There are some similarities between humans and AIs.
Right. However, I think AI welfare being difficult to measure conditional on sentience tends to imply that assessing AI sentience is also difficult. So I would prioritise decreasing uncertainty about this too.
Makes sense.