Comments
Summary
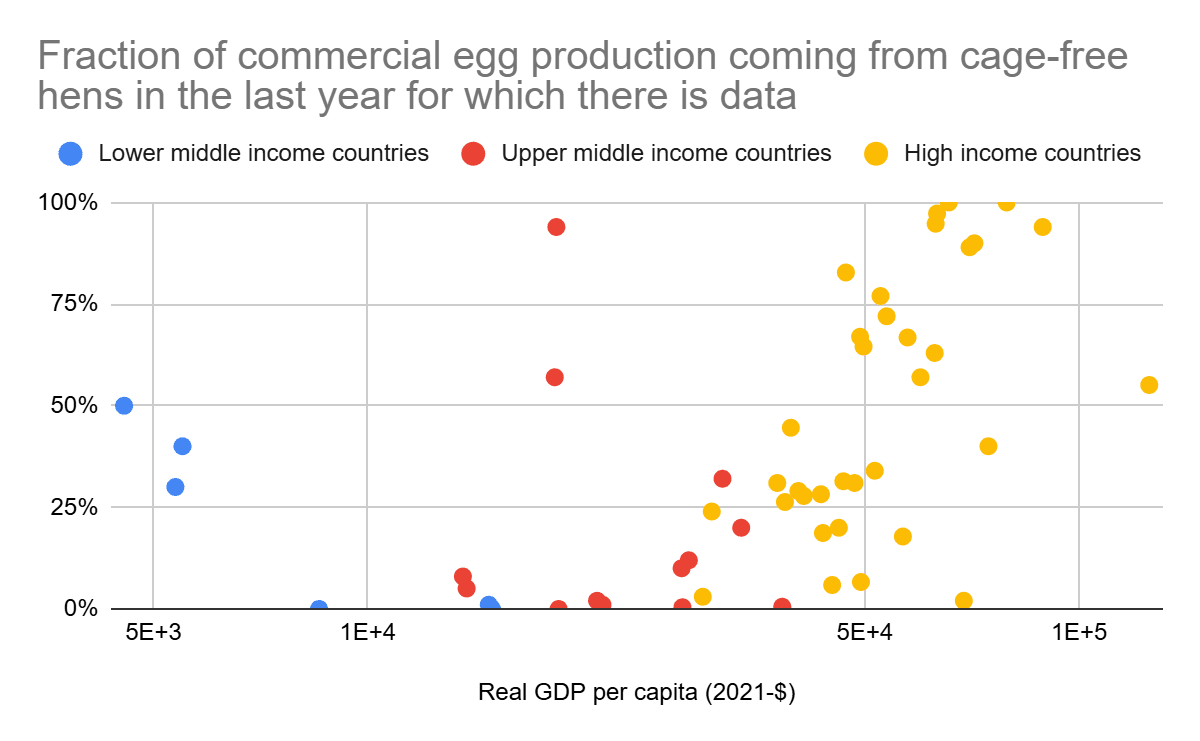
- Among the 53 countries I analysed, there is a U-shaped relationship between the fraction of commercial egg production coming from cage-free hens, and the logarithm of the real gross domestic product (real GDP) per capita. The fraction:
- Decreases among lower middle income countries (p-value of 1.35 %).
- Decreases among upper middle income countries (61.7 %).
- Increases among high income countries (0.0547 %).
- The above follows the pattern of an environmental Kuznets curve (EKC), where the effects on humans from environmental degradation get worse before improving while real GDP per capita increases along the way. It does not follow that (causing additional) economic growth is initially harmful, and then beneficial. It depends on how concrete interventions impact the number and conditions of animals over time.
Methods
I used data collected by The Humane League (THL) about the fraction of commercial egg production coming from cage-free hens by country by year to[1]:
- Make a scatter plot of that fraction, and real GDP per capita.
- Run linear regressions of that fraction on the logarithm of the real GDP per capita.
I relied on data for the last year for which there was data on the fraction of commercial egg production coming from cage-free hens (2014 to 2023, depending on the country). The income groups below refer to the real gross national income (real GNI) per capita in that year.
Giovanni Fabris, THL’s global research and insights lead, noted only the fractions regarding the countries in the European Union (EU), United Kingdom, and United States are reliable.
Results
Here are my calculations.
| Countries | Number of countries | Linear regression of the fraction of commercial egg production coming from cage-free hens on the logarithm of the real GDP per capita | |||
| Slope | Intercept | Coefficient of determination | P-value for the null hypothesis that there is no correlation | ||
| All | 53 | 0.198 | -1.69 | 18.9 % | 0.114 % |
| Lower middle income | 6 | -0.387 | 3.68 | 81.6 % | 1.35 % |
| Upper middle income | 13 | -0.129 | 1.49 | 2.35 % | 61.7 % |
| High income | 34 | 0.593 | -5.96 | 31.5 % | 0.0547 % |
Discussion
Among the 53 countries I analysed, there is a U-shaped relationship between the fraction of commercial egg production coming from cage-free hens, and the logarithm of the real GDP per capita. The fraction:
- Decreases among lower middle income countries (p-value of 1.35 %).
- Decreases among upper middle income countries (61.7 %).
- Increases among high income countries (0.0547 %).
The above follows the pattern of an environmental Kuznets curve (EKC), where the effects on humans from environmental degradation get worse before improving while real GDP per capita increases along the way. It does not follow that (causing additional) economic growth is initially harmful, and then beneficial. It depends on how concrete interventions impact the number and conditions of animals over time.
I guess including more countries would make the U-shaped curve flatter.
The minimum fraction of commercial egg production coming from cage-free hens for a U-shaped would happen for a real GDP per capita of around 20 k 2021-$, which is similar to the global real GDP per capita in 2022 of 20.1 k 2021-$. Colombia and Thailand had abnormally high fractions in 2022 and 2014 of 94.0 % and 57.0 % given their real GDP per capita in those years of 18.4 k and 18.3 k 2021-$.
The U-shaped curve can be explained by 2 opposing effects. A higher real GDP per capita results in:
- A greater meat supply per capita, which leads to factory-farming. This effect initially dominates, and makes conditions worsen.
- A greater willingness to pay for animal welfare. This effect eventually dominates, because people can only consume so many animal-based foods, so conditions end up improving.