Summary
In this post, we provide an overview of responses to the cause area prioritization questions in the 2024 EA Survey. We report on the relative ranking of cause areas, how this has changed over time, and how prioritization relates to respondents’ preferred resource allocation between causes. We also consider how other responses, such as endorsement of ideas related to EA, engagement, and demographic factors, relate to prioritizations.
Overall cause prioritization
- AI risks and global health and poverty were considered the most highly prioritised causes, followed by biosecurity, and, unlike previous years, animal welfare
- Animal welfare and AI risks received higher prioritisation ratings than in the last survey year
- High-engagement respondents rated AI risks, EA movement building, and animal welfare higher
- Low-engagement respondents rated climate change and mental health higher
- High engagement was the strongest predictor of cause prioritization
- The agreement or disagreement with certain ideas was related to cause prioritizations in domains such as animal welfare, AI risks, global health and poverty, and climate change
- Cause areas relating to bio- and nuclear security and cause prioritization research were not related to agreement with any ideas
- Agreement has changed very little since 2022; marginal changes included increased endorsement of the likelihood of ants’ sentient experience and the future value of digital minds, and decreased agreement with deferring to mainstream experts and longtermism
Allocation of resources to causes
- On average, respondents divide resources almost evenly between broad-grain cause areas; near-term human-focused causes (~37%), longtermist causes (~35%), and near-term animal-focused causes (~24%)
- Respondents who considered themselves highly engaged in EA tended to allocate more resources to longtermist causes (38.9% vs. 29.7%) and fewer to near-term, human-focused causes (29.6% vs. 45.8%)
- Identifying as a man was marginally associated with allocating more resources to longtermist causes
- Being a student was marginally related to allocating fewer resources to near-term human-focused causes
Cause Prioritizations
As in previous survey years, respondents rated how much they thought different cause areas should be prioritised in terms of resources allocated. They responded using five options, ranging from allocating the cause “not any resources” to treating it as the “top priority” (all response options are provided in the figure below). These results are based on approximately 1,850 responses, as not all respondents provided prioritization ratings for all cause areas; individual cause areas were rated by 1,795-1,877 respondents. Below, we show the distribution of the average cause prioritization rating for each cause area, as well as the distribution of responses across prioritization levels.
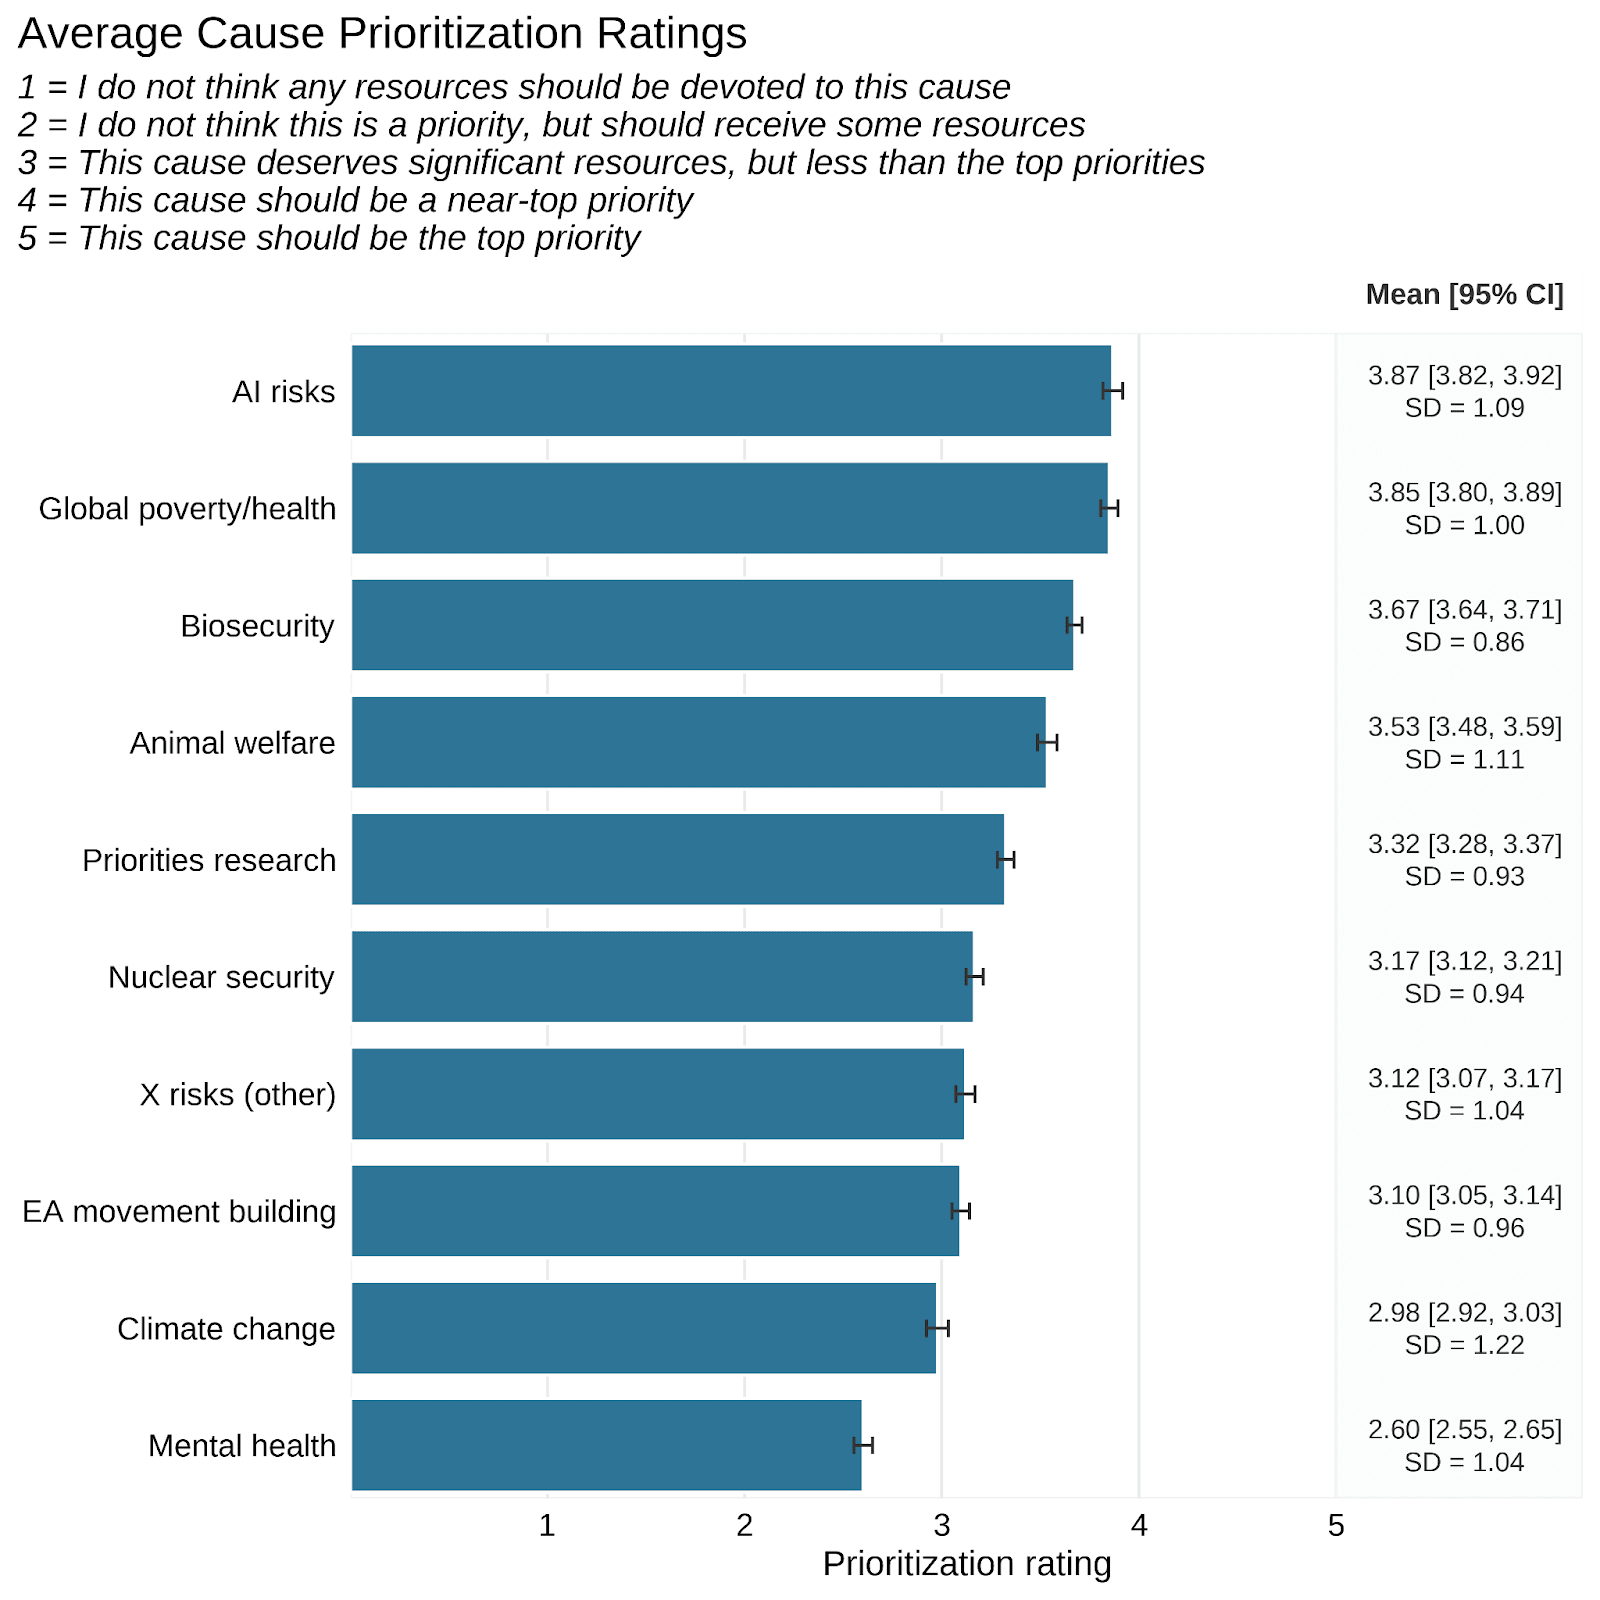
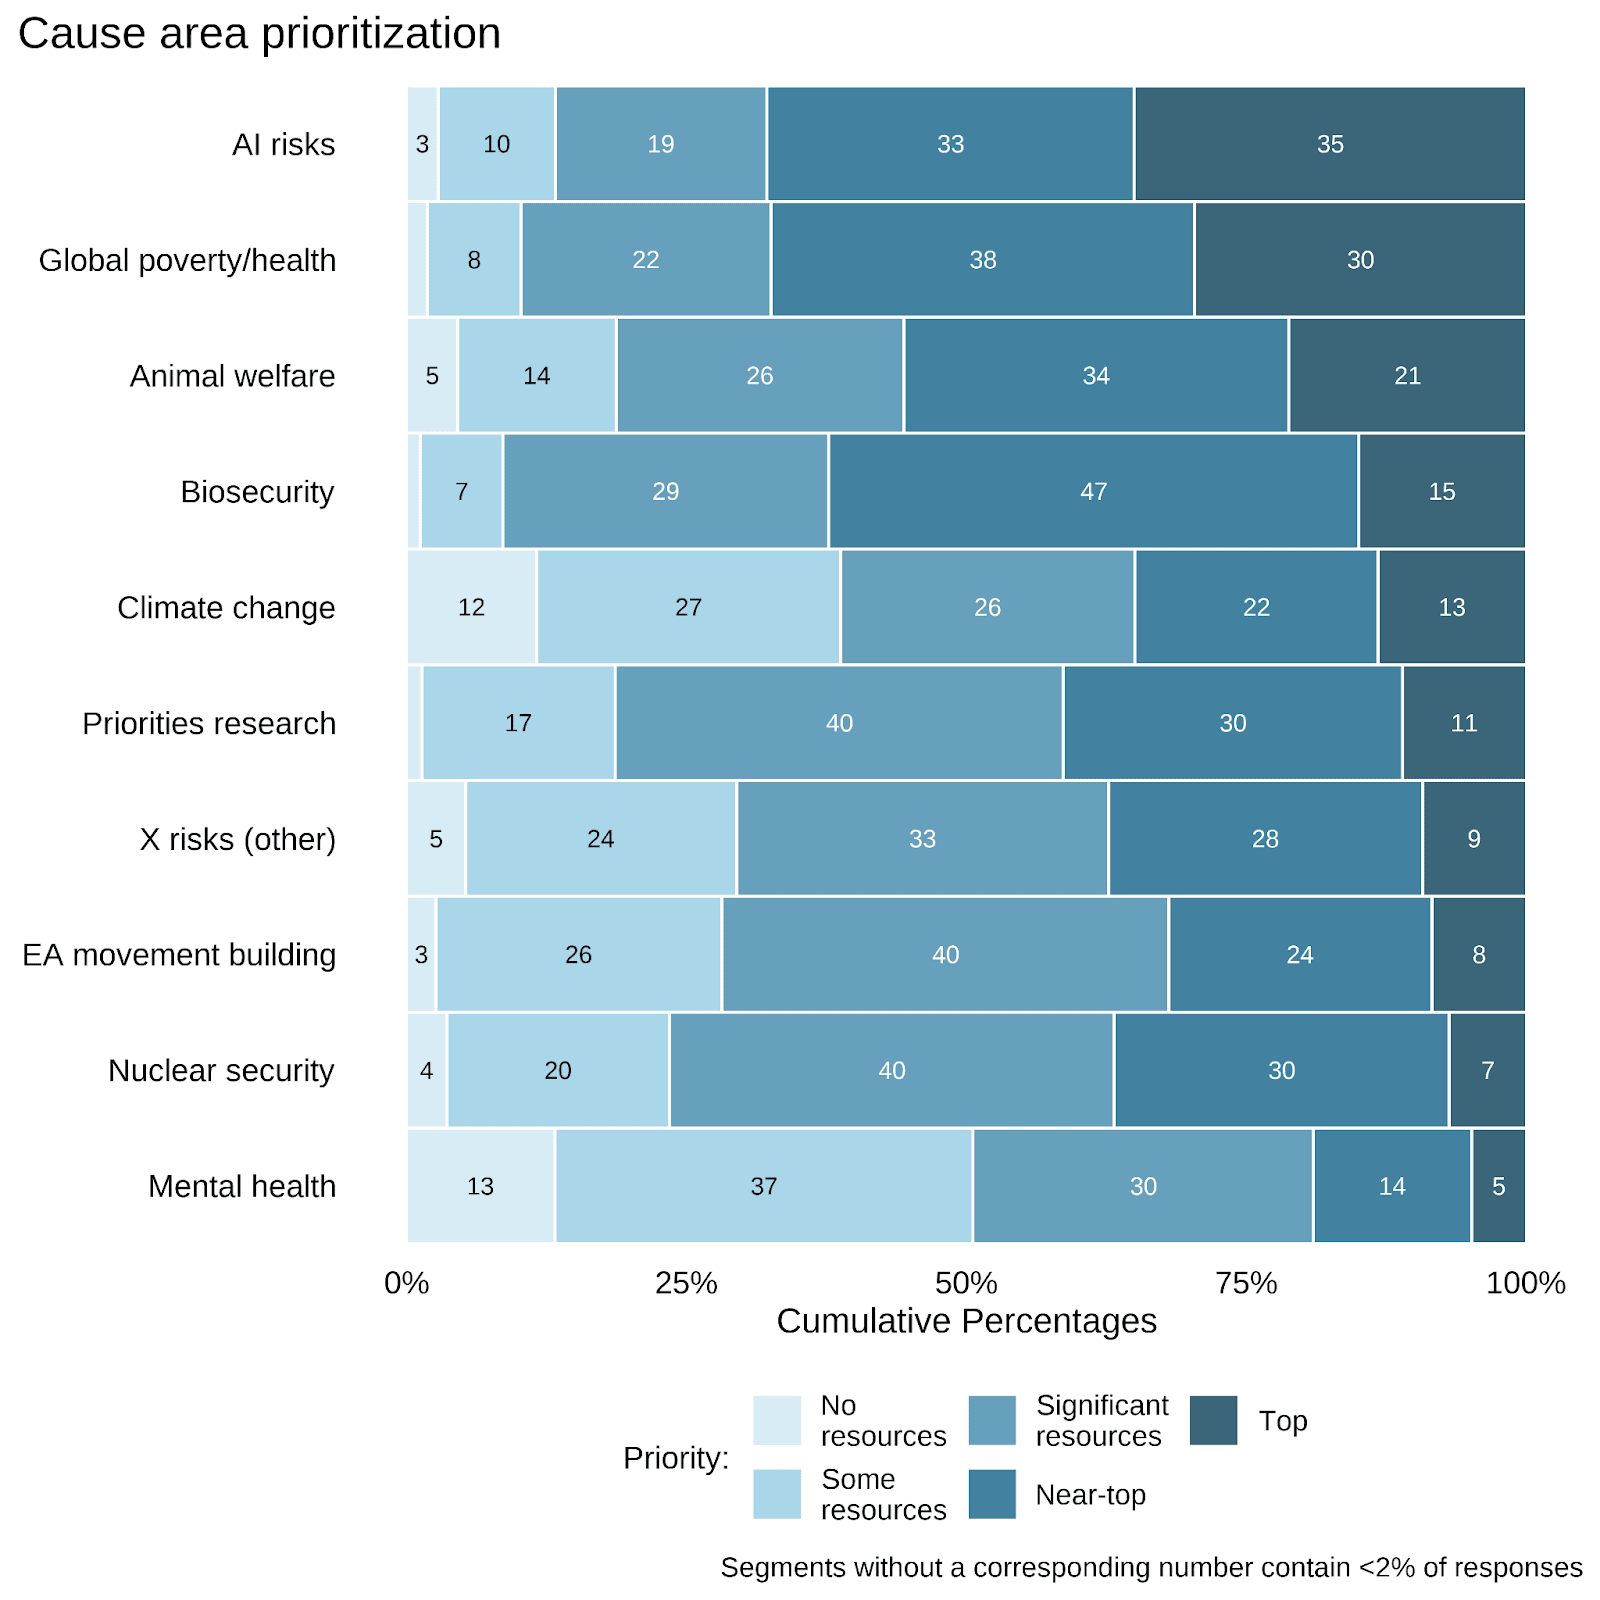
This year, the top-rated causes were AI risks, global health and poverty, biosecurity, and animal welfare. AI risks and global poverty/health remain the two highest-rated cause areas, with the average respondent considering them just below a near-top priority. Both of these cause areas were also considered as a near-top or top priority by approximately 70% of the respondents, with 35% and 30% of respondents, respectively, considering AI risks and global health and poverty as top priorities.
Biosecurity was considered almost as high a priority on average, but this was composed of more near-priority responses (47%) and fewer top priority responses (15%) than other highly rated causes. Animal welfare received more top priority responses (21%) than biosecurity; however, it was still, on average, rated lower, as a larger proportion of respondents indicated it should only receive significant, some, or no resources (approximately 45%) than other top causes.
Both mental health and climate change were proportionally considered a lower priority than other cause areas. For mental health, this reflected a general lower prioritization sentiment, as, on average, responses were between ‘some’ and ‘significant’ resource allocation, and it received the fewest top priority (5%) and near-top priority (14%) responses. Likewise, climate change, on average, was considered a cause that should be allocated significant resources, but responses were more polarized: 35% of responses considered it a near-top or top priority cause, while 38% of responses believed it should be allocated none or only some resources.
Overall, these responses indicate that within EA, certain causes are considered higher priority than others. However, there are also significant differences in individual priority allocations; all cause areas received some top priority responses, and some responses indicating they should not be allocated any resources. All cause areas also retain some relevance in the aggregate; at least 50% respondents believed each cause area should be allocated significant resources or more.
Trends in cause prioritization over time
The cause prioritization responses from the 2024 EA Survey build on trends from previous years. With its continued rise, AI risks are now tied with global health and poverty as the top cause. Biosecurity remains one of the highest prioritised causes, but has declined since the last EA Survey. Finally, animal welfare has continued its rise and is, for the first time, among the highest-rated causes.
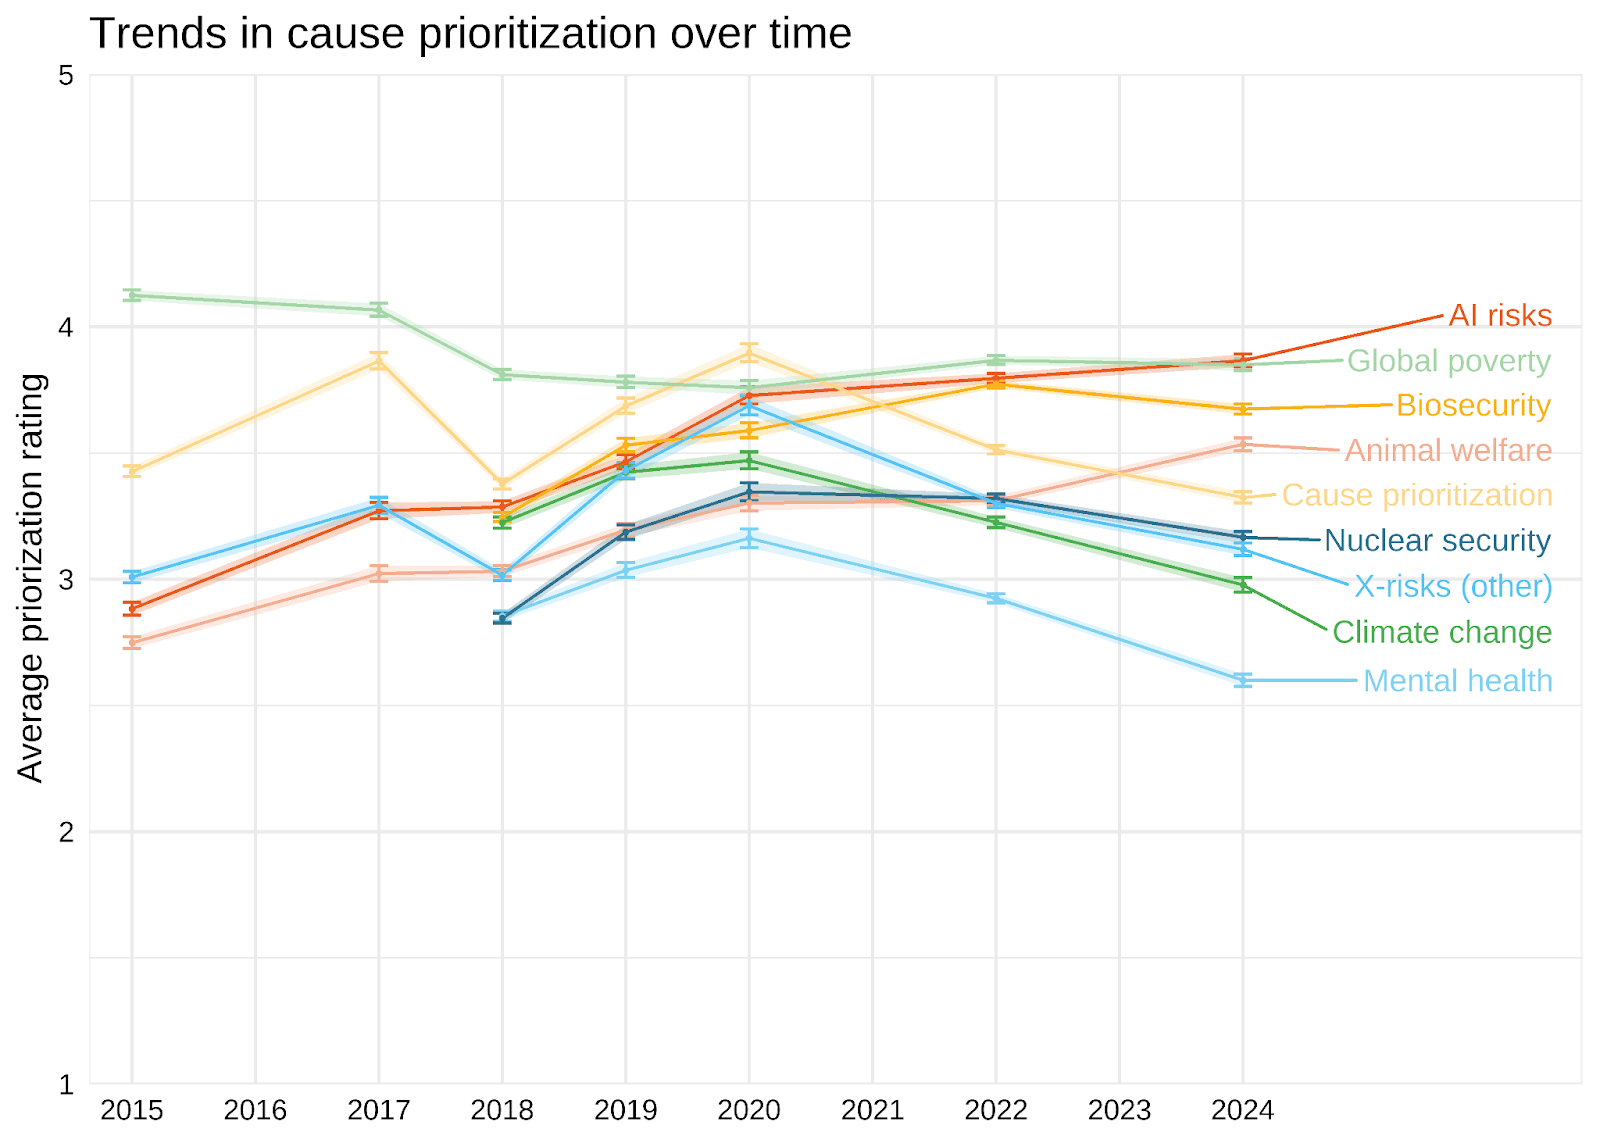
Since the first EA Survey in 2015, the average cause prioritization response has, arguably, gone through distinct phases.
- 2015: global health and poverty clearly lead the pack as the top cause.
- 2015-2020: growth in the prioritization of most cause areas culminating in 2020, where most cause areas peaked in terms of respondents’ prioritization.
- 2022-2024: cause prioritizations spread out from the previous concentrated distribution.
Climate change, mental health, nuclear security, other x-risks, and cause prioritization research all show distinct increases from 2018-2020 and decreases from 2020-2024, which for mental health and climate change causes results in the lowest average prioritization recorded in 2024. In contrast, animal welfare and AI risks have both been on a steady rise since they were each included in the EA Survey. Since 2022, only animal welfare and AI risk causes have experienced increases in their prioritization..
Multiple events could contribute to these distinct trajectories. Contributors to the 2020 peak most likely included cause-specific factors such as the global COVID-19 pandemic and the war in Ukraine, as well as general factors such as the peak in EA funds and the global economy at that time. The EA funding landscape may have contributed to the overall pattern of prioritizations, as FTX and related events reduced activity and available funds from 2021 onwards, in contrast to the previous consistently growing influx of resources.
Engagement and cause prioritization
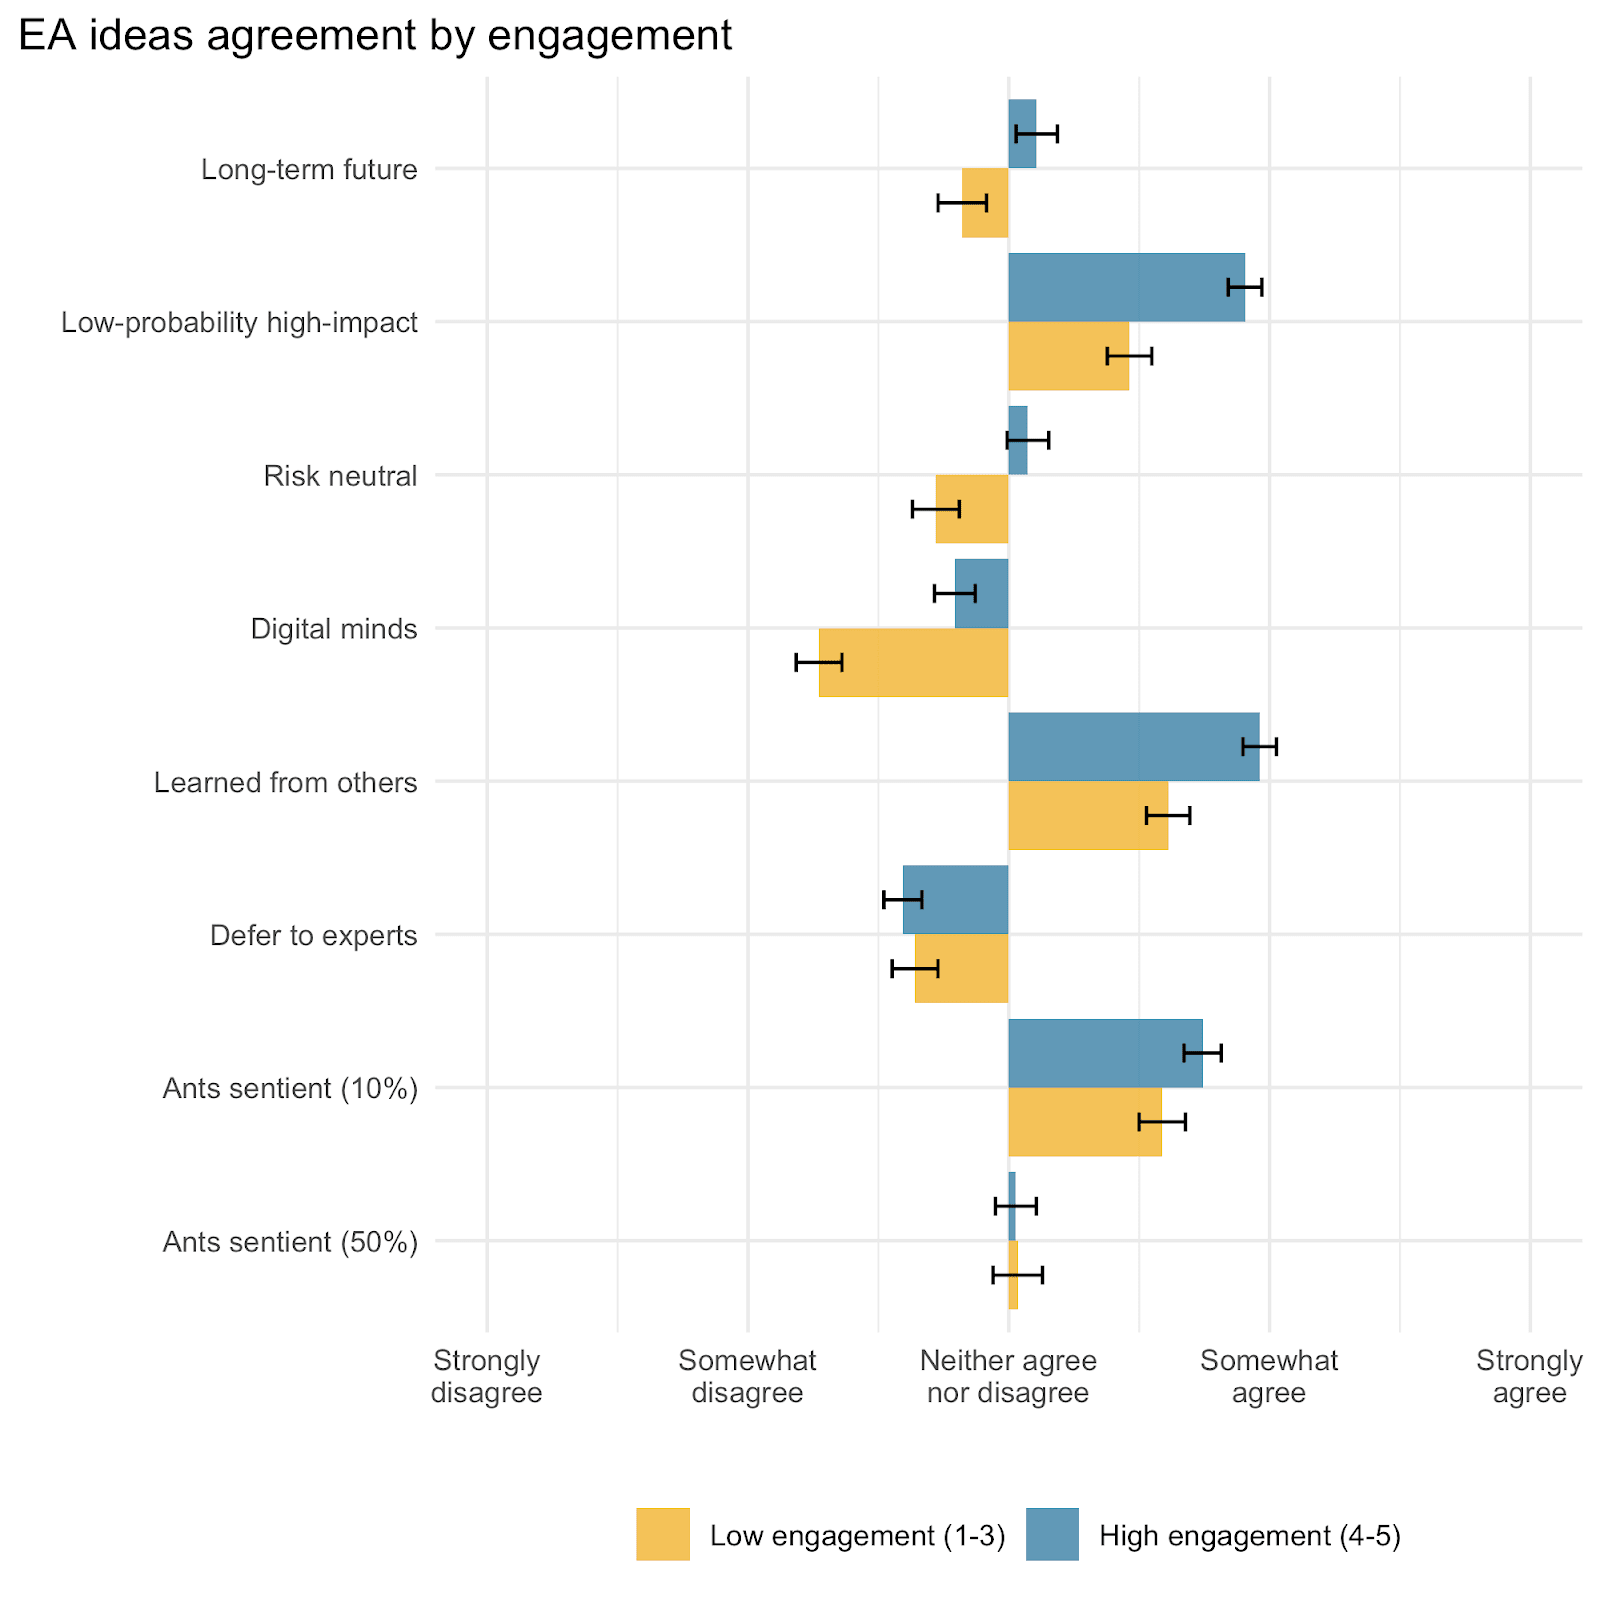
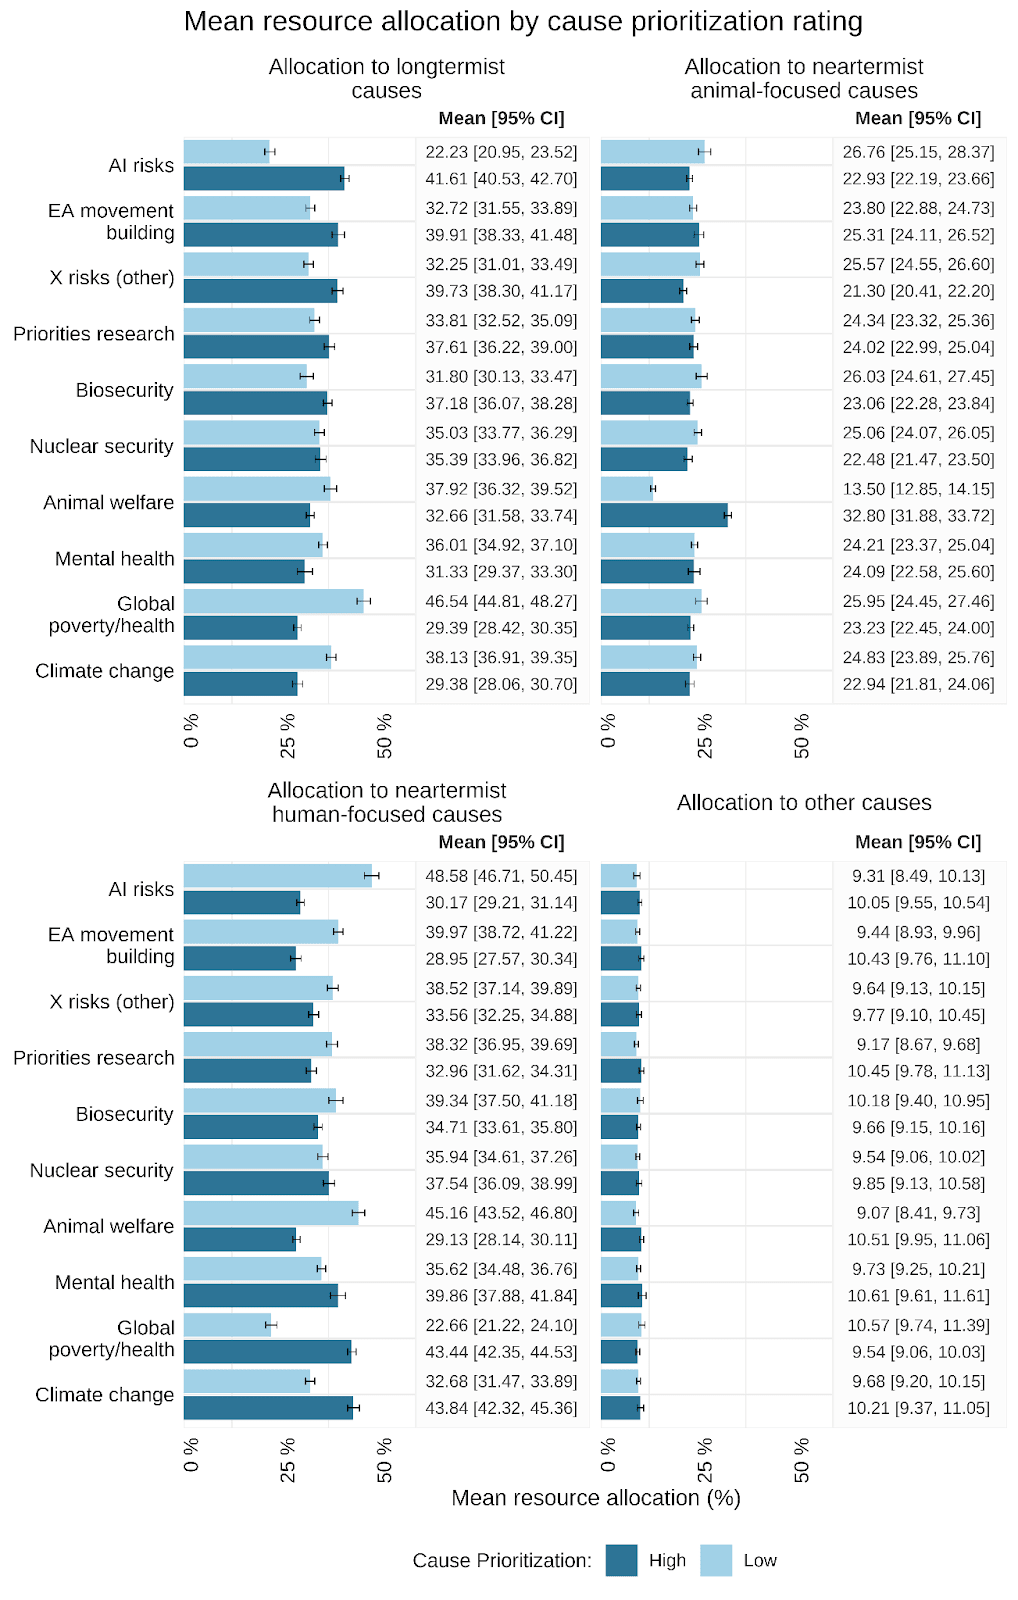
We also considered how self-reported engagement with EA was related to the causes respondents prioritized. We asked people how engaged with EA ideas and the EA community they believed themselves to be on a 5-point scale from no engagement to highly engaged. We split respondents into two groups to examine the influence of self-reported engagement: high engagement (responded high or considerable engagement) and low engagement (responded no, mild, or moderate engagement).
Highly engaged respondents rated AI risks, EA movement building, and animal welfare more highly than less engaged respondents. By contrast, low-engagement respondents tended to rate climate change, global health, and poverty substantially higher on average. The remaining cause areas received similar ratings from self-identified high- and low-engagement respondents.
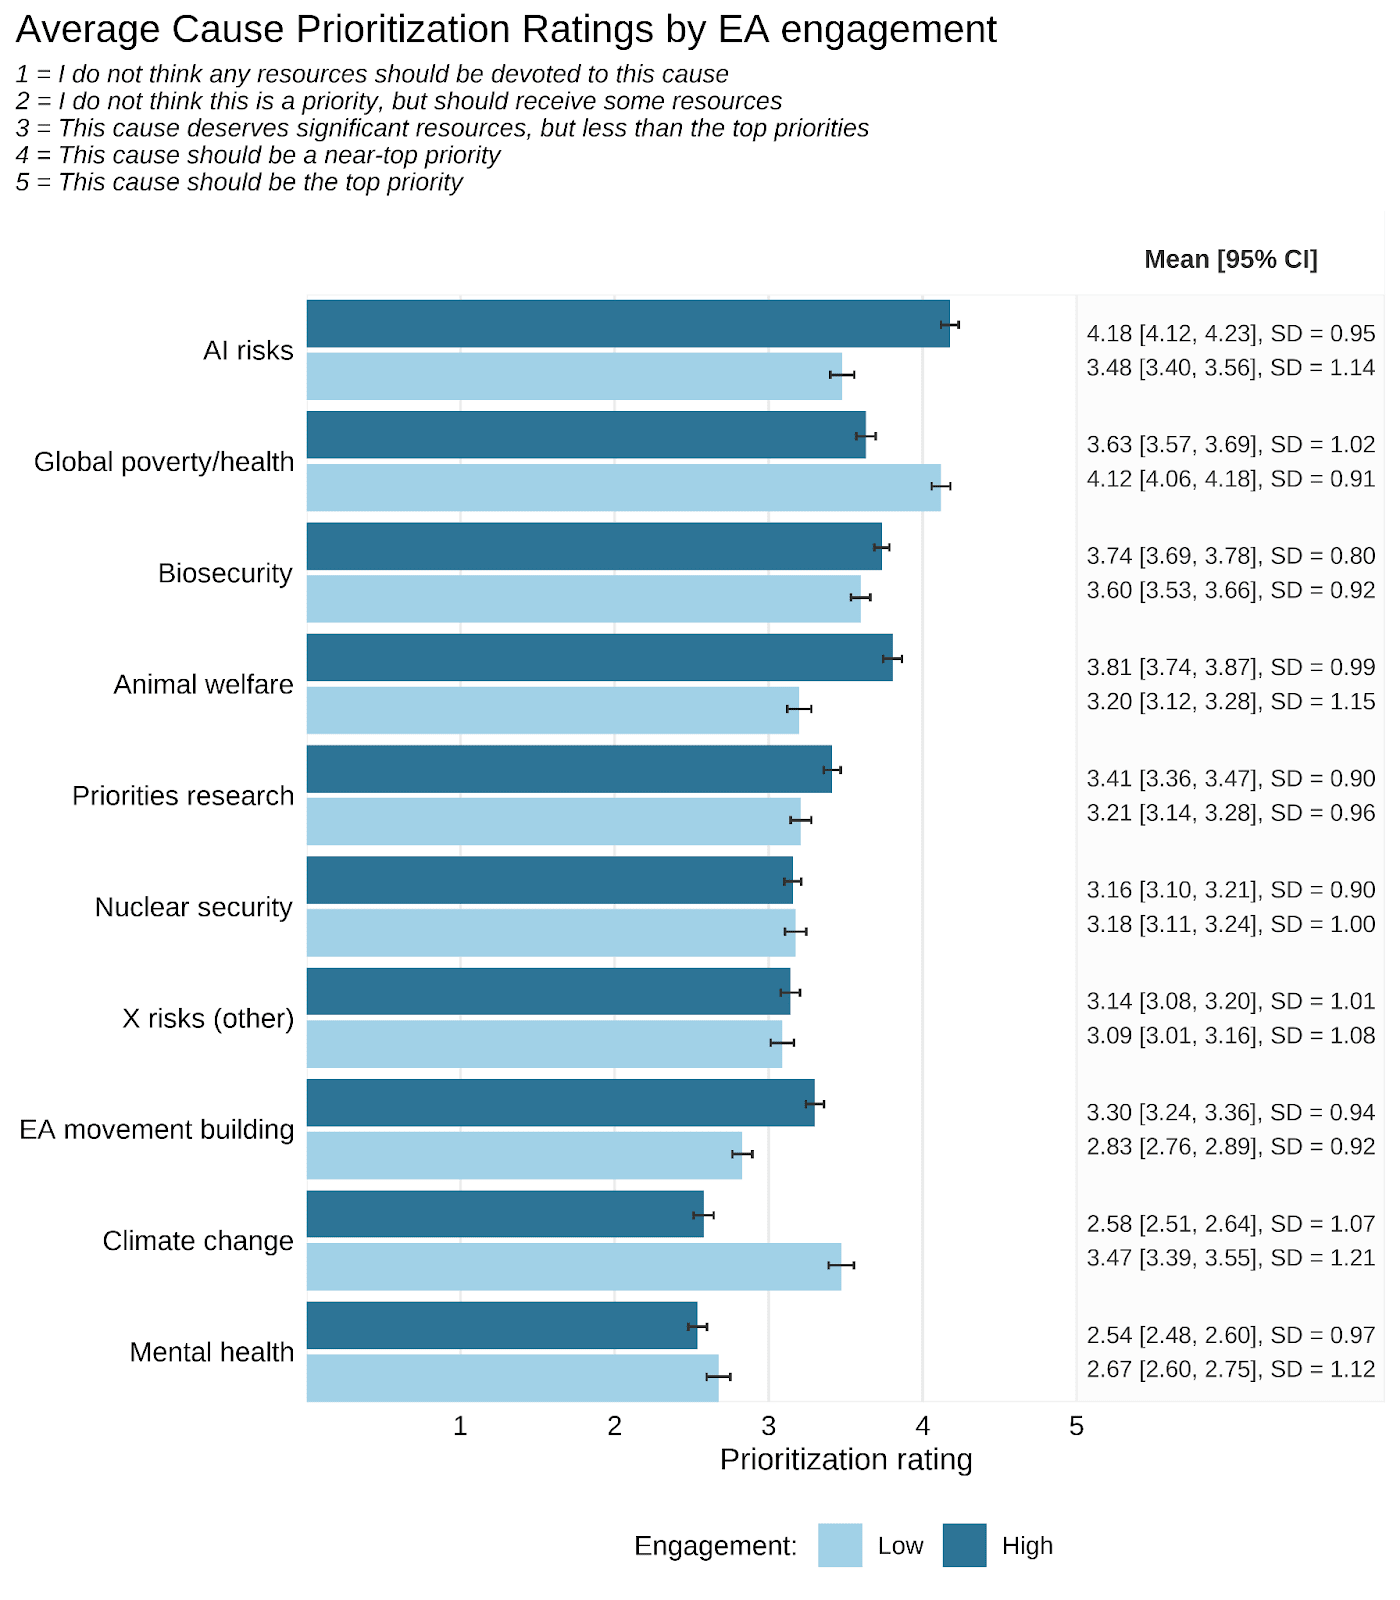
Note. Bars indicate means with 95% CIs.
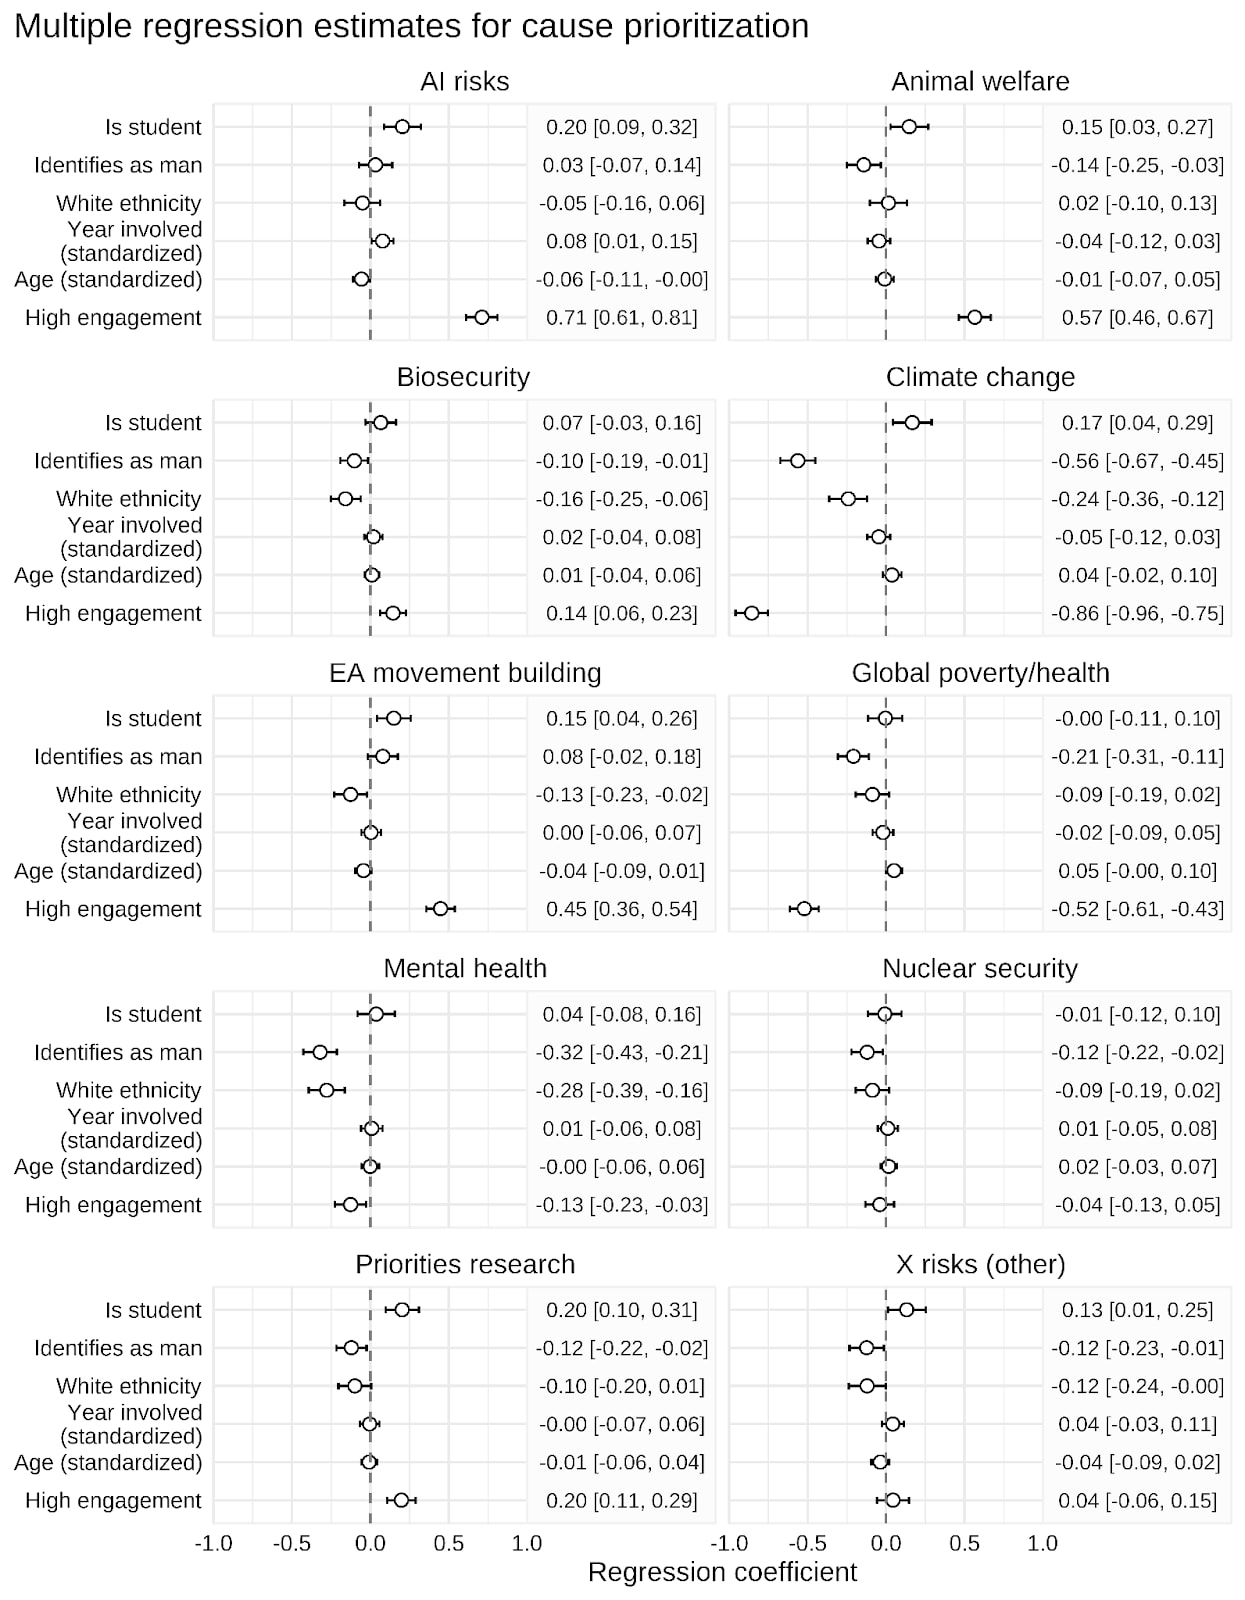
Factors linked with prioritization of different causes
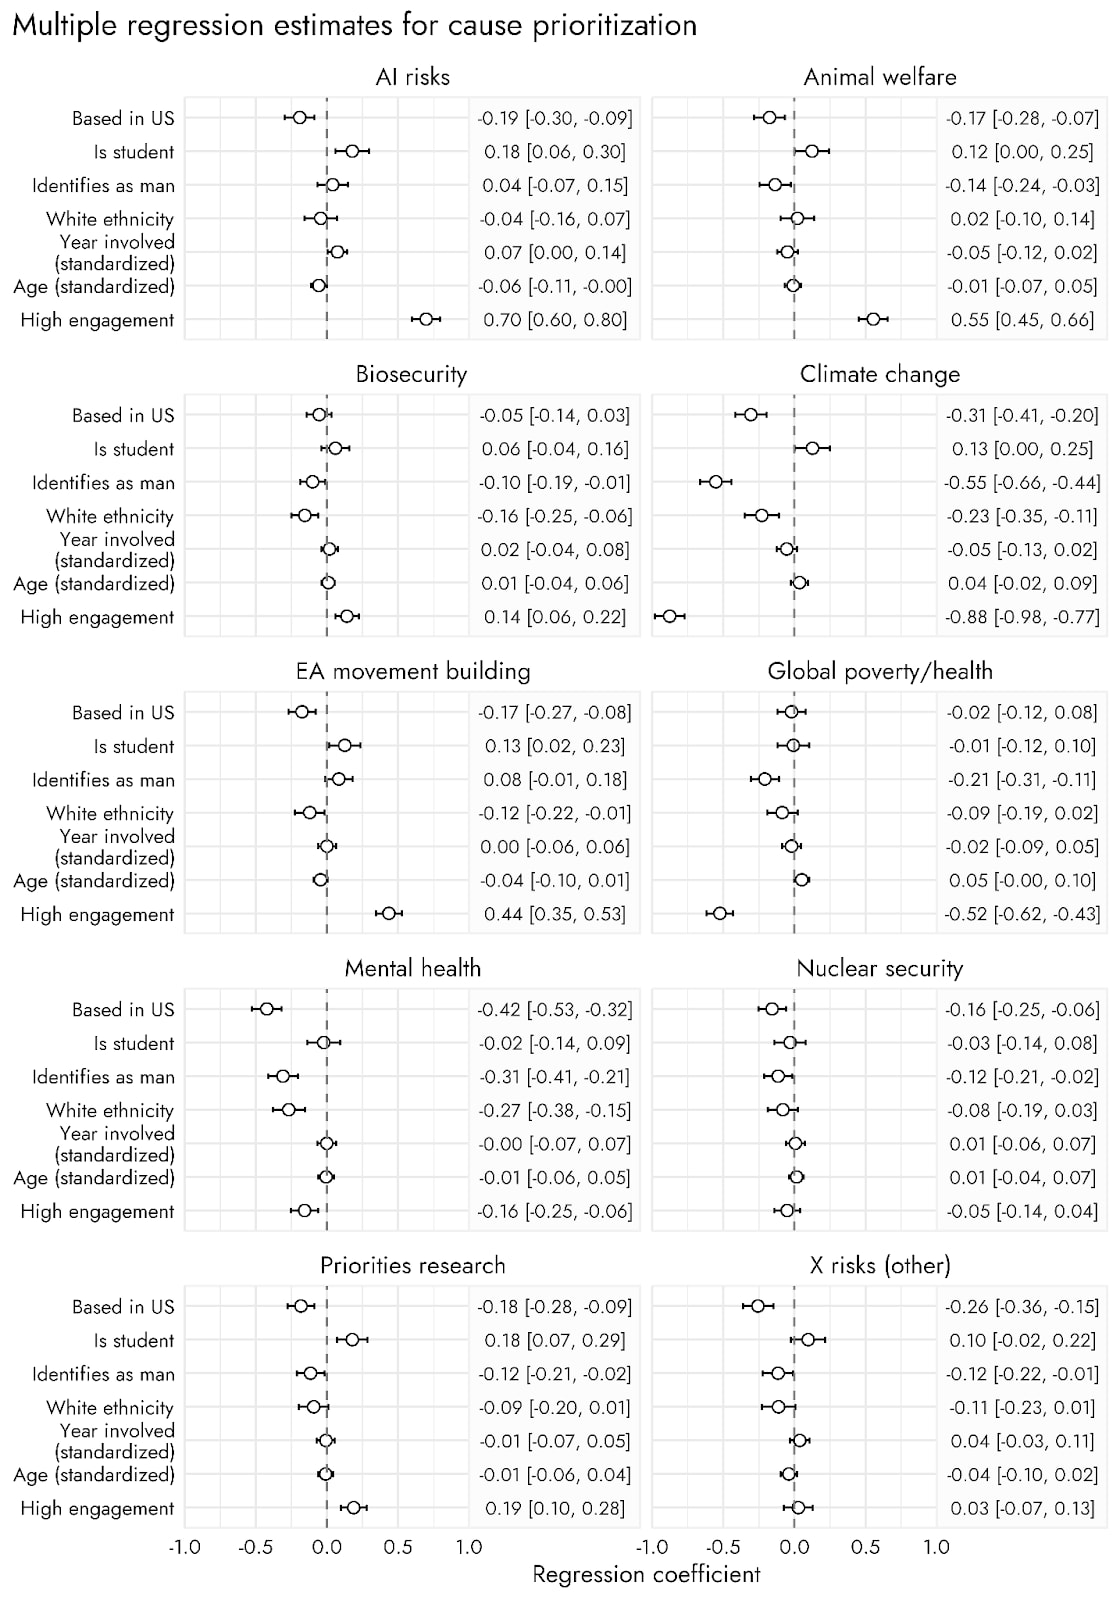
To investigate which factors are related to different cause prioritizations, we fitted a set of multiple linear regressions with the following predictors: respondent age, year involved in EA, identifying as of white ethnicity, identifying as a man, being a student, and having high engagement. These factors have previously been included and often found to be associated with EA-related outcomes or of broad interest for understanding the EA community.
We also conducted additional analyses on how individual levels of demographic factors influenced each outcome, to ensure that dichotomised versions were meaningful. Relevant findings from these analyses are reported in the appendix.
Highlights
Overall, the results of the multiple linear regressions mostly reflect already presented results. There are clear differences in the prioritization of certain cause areas depending on engagement with EA.
- Respondents with high engagement tended to ascribe higher priority to AI risks, animal welfare, and EA movement building and lower priority to climate change and global health and poverty than respondents who considered themselves less engaged with EA.
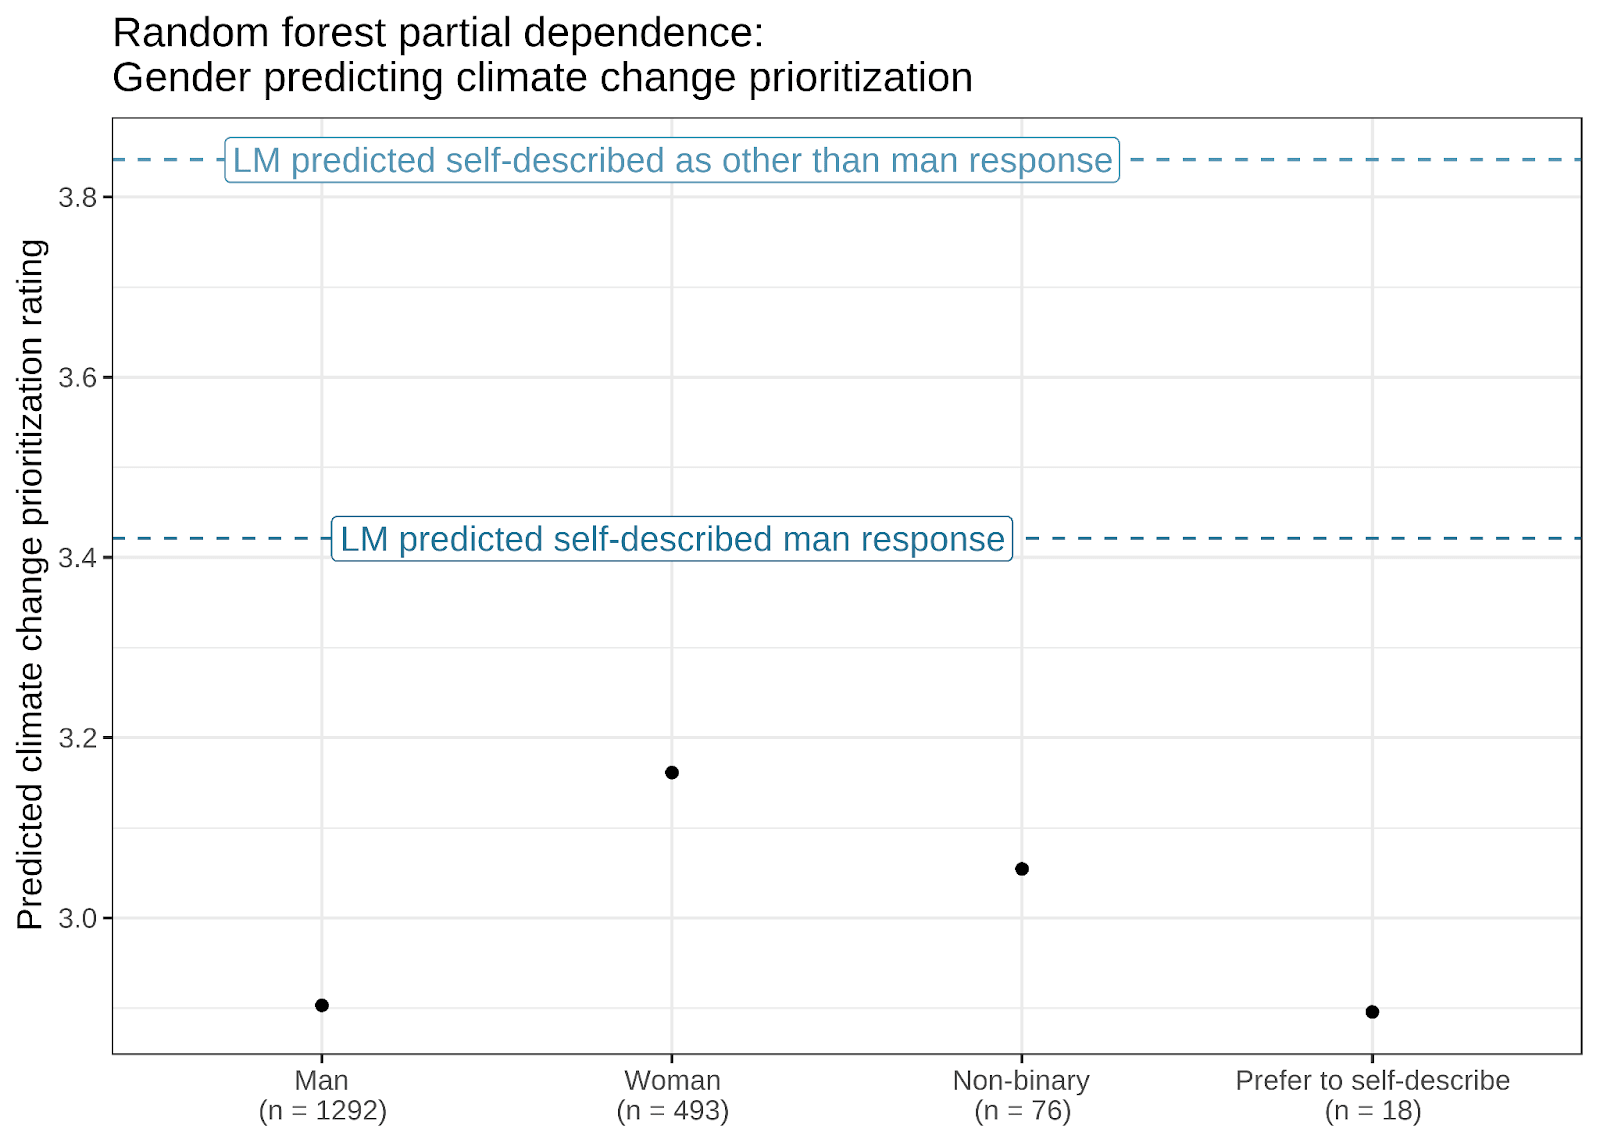
- Those identifying as a woman or non-binary considered climate change and mental health a higher priority than those who identified as men (see Appendix for effects for each category for climate change).
Since the 2022 EA survey, we have also asked respondents to express their agreement or disagreement with some ideas and epistemic stances relating to EA. These ideas were:
- The impact of our actions on the very long-term future is the most important consideration when it comes to doing good. [“Long-term future”]
- I'm comfortable supporting low-probability, high-impact interventions. [“Low-probability high impact”]
- I endorse being roughly risk-neutral, even if it increases the odds that I have no impact at all. [“Risk neutral”]
- The EA community should defer to mainstream experts on most topics, rather than embrace contrarian views. [“Defer to experts”]
- I have learned a lot from other EAs who prioritize different broad cause areas than I do. [“Learned from others”]
- Most expected value in the future comes from digital minds' experiences, or the experiences of other nonbiological entities. [“Digital minds”]
- It is more than 10% likely that ants have valenced experience (e.g., pain). [Ants sentient (10%)]
- It is more than 50% likely that ants have valenced experience (e.g., pain). [Ants sentient (50%)]
There were five response options from Strongly Disagree to Strongly Agree.
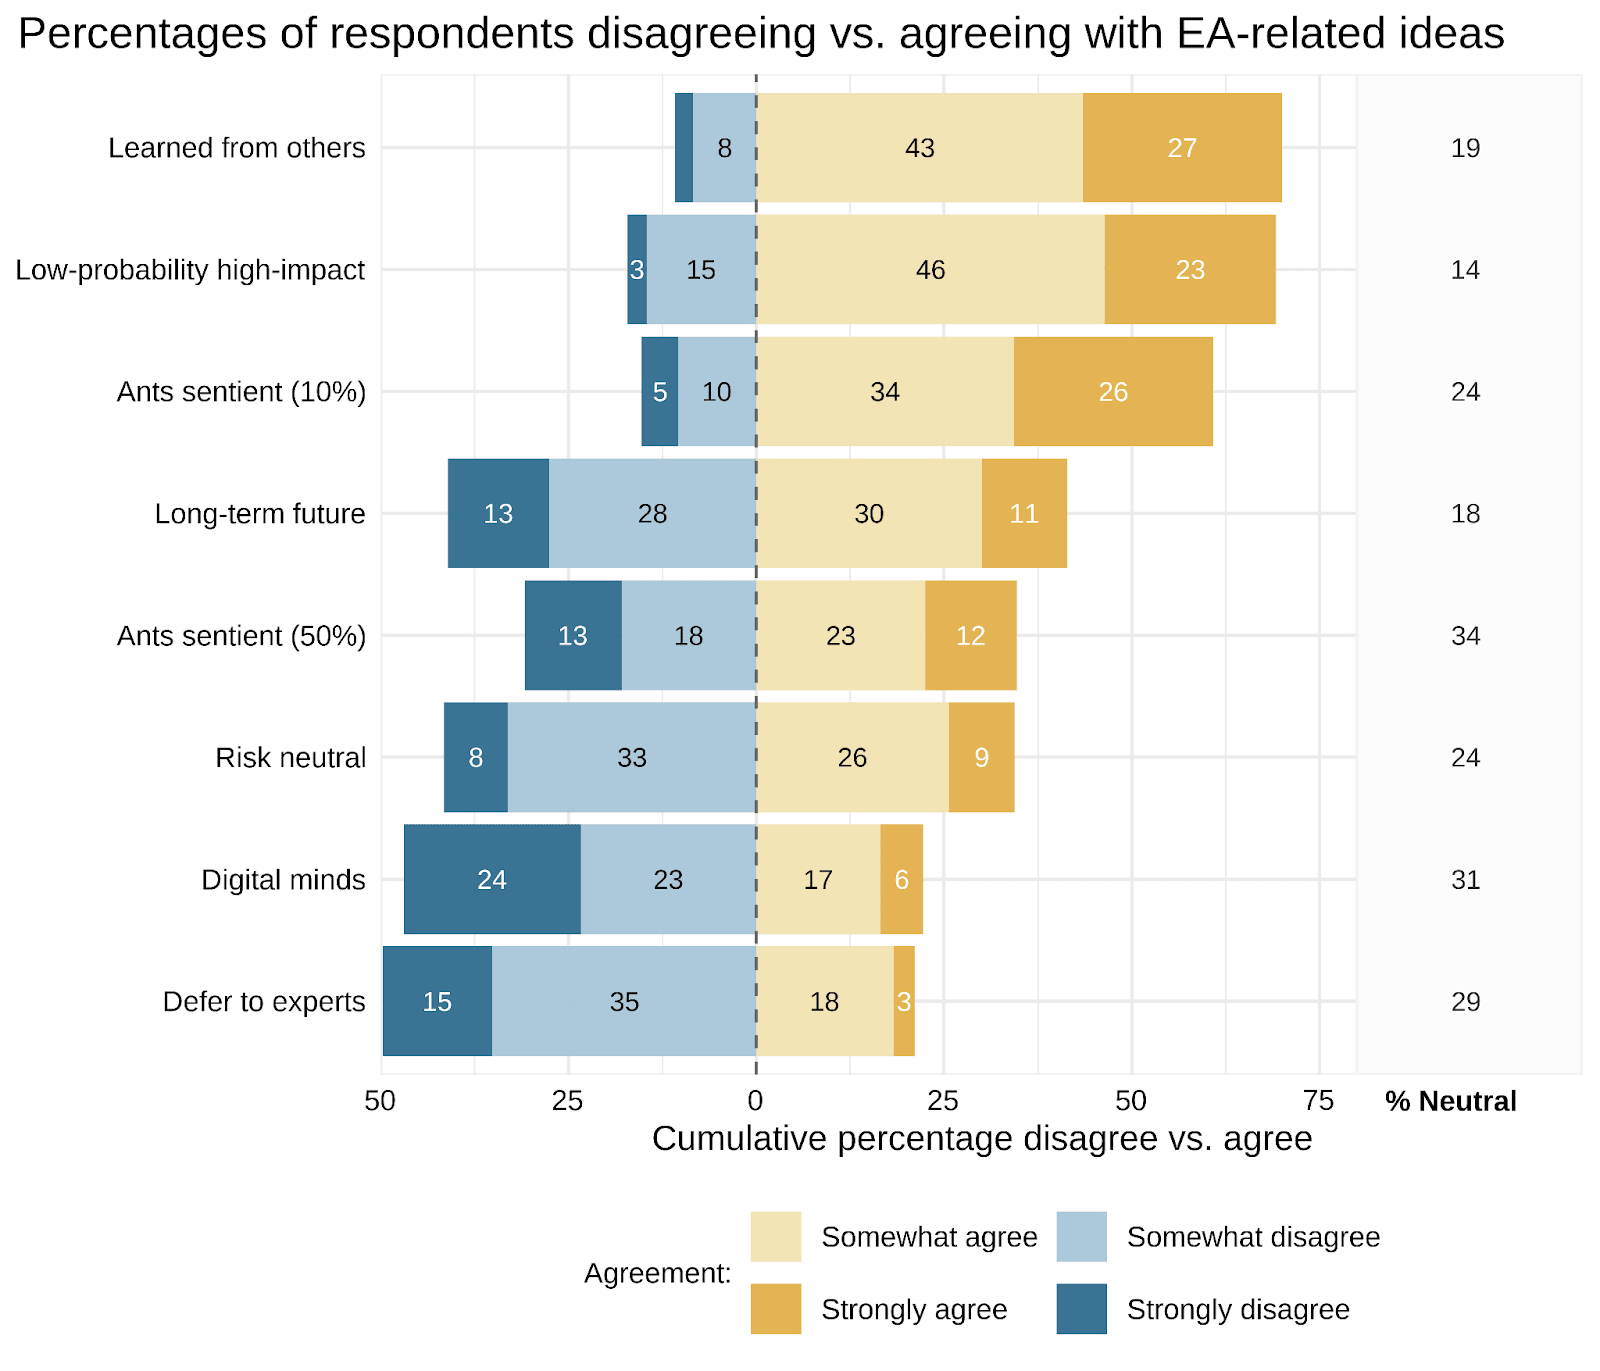
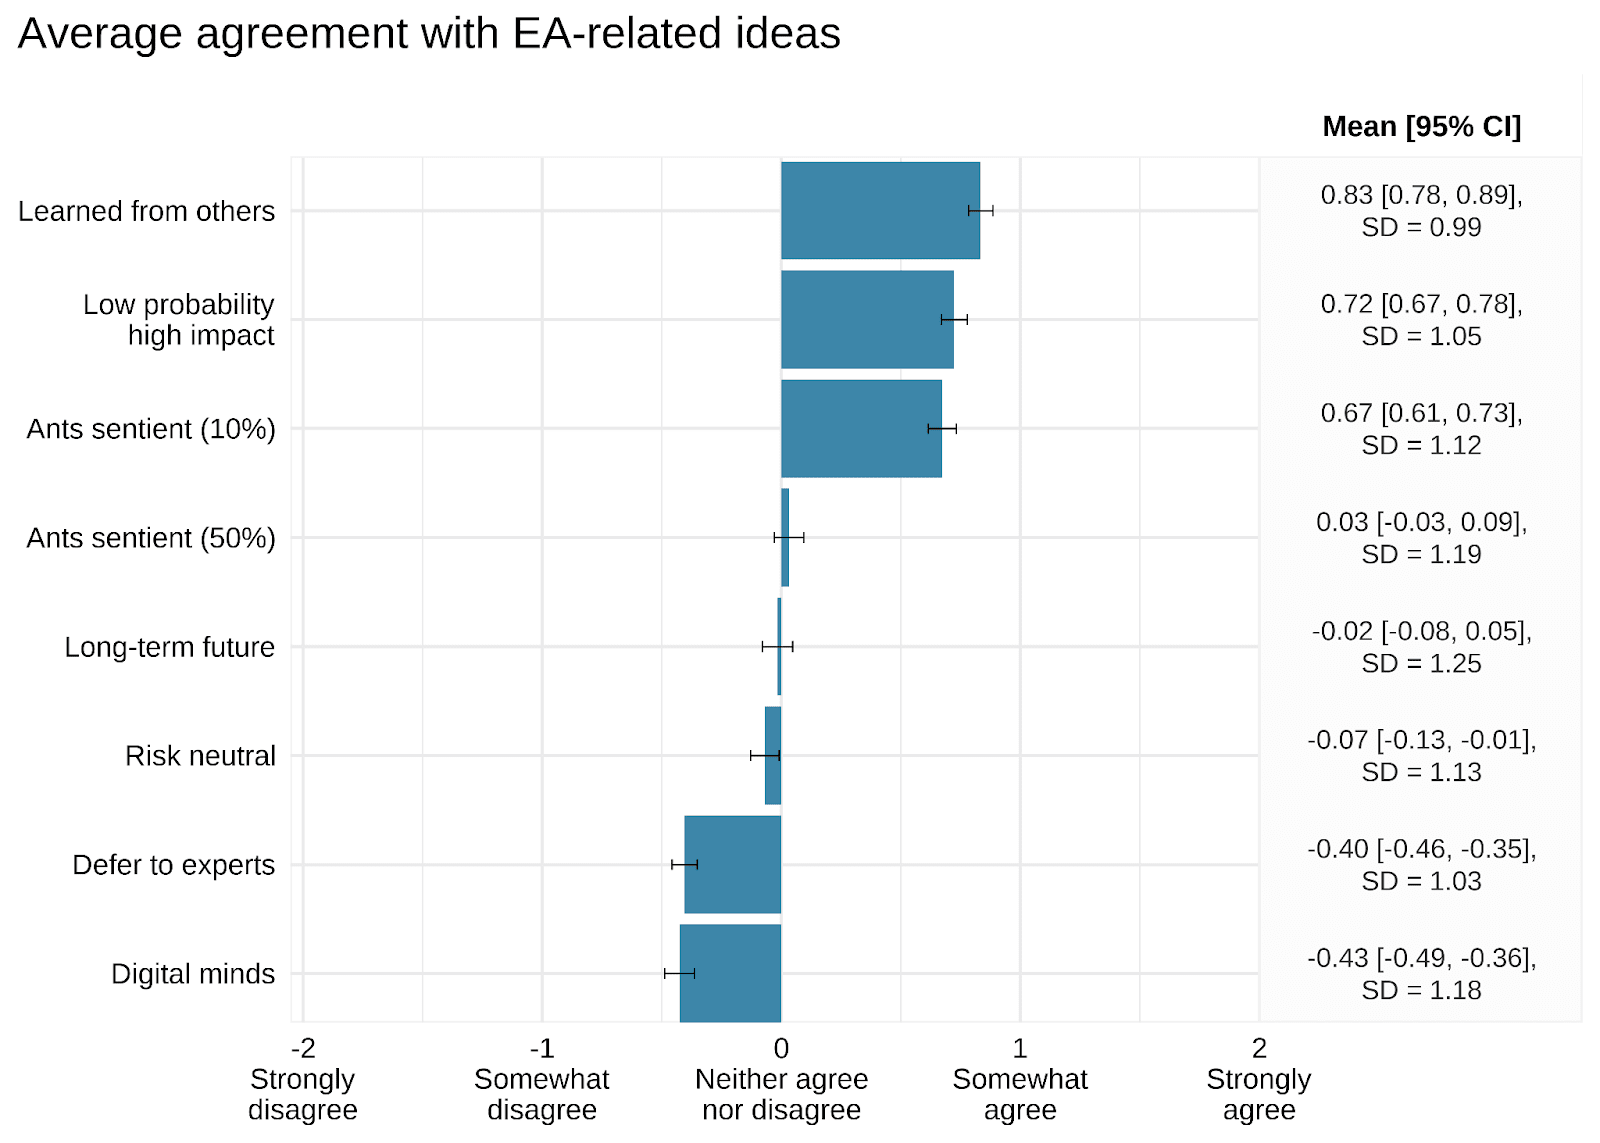
Respondents generally somewhat agreed with ideas relating to having learned from other EAs with different cause prioritizations, supporting low-probability high-impact interventions, and that there is a more than 10% likelihood that an ant has sentient experience.
A second class of ideas were neutral on average. These ideas endorse a risk-neutral stance, even at the cost of impact, a general longtermist stance, and the view that there is a more than 50% likelihood that ants are sentient. Endorsing a longtermist stance showed a bimodal distribution, indicating division among respondents. On the other hand, the ideas regarding a 50% likelihood of ants having sentient experience and risk neutrality were more normally distributed.
Finally, there was mild scepticism towards the ideas that digital minds or other non-biological sentiencies are the main source of future expected value, and that EA should defer to mainstream experts. Notably, while deferring to experts was relatively normally distributed, future expected value coming from digital minds, seemed to fall into two camps, with peaks at “strongly disagree” and “neither agree or disagree”.
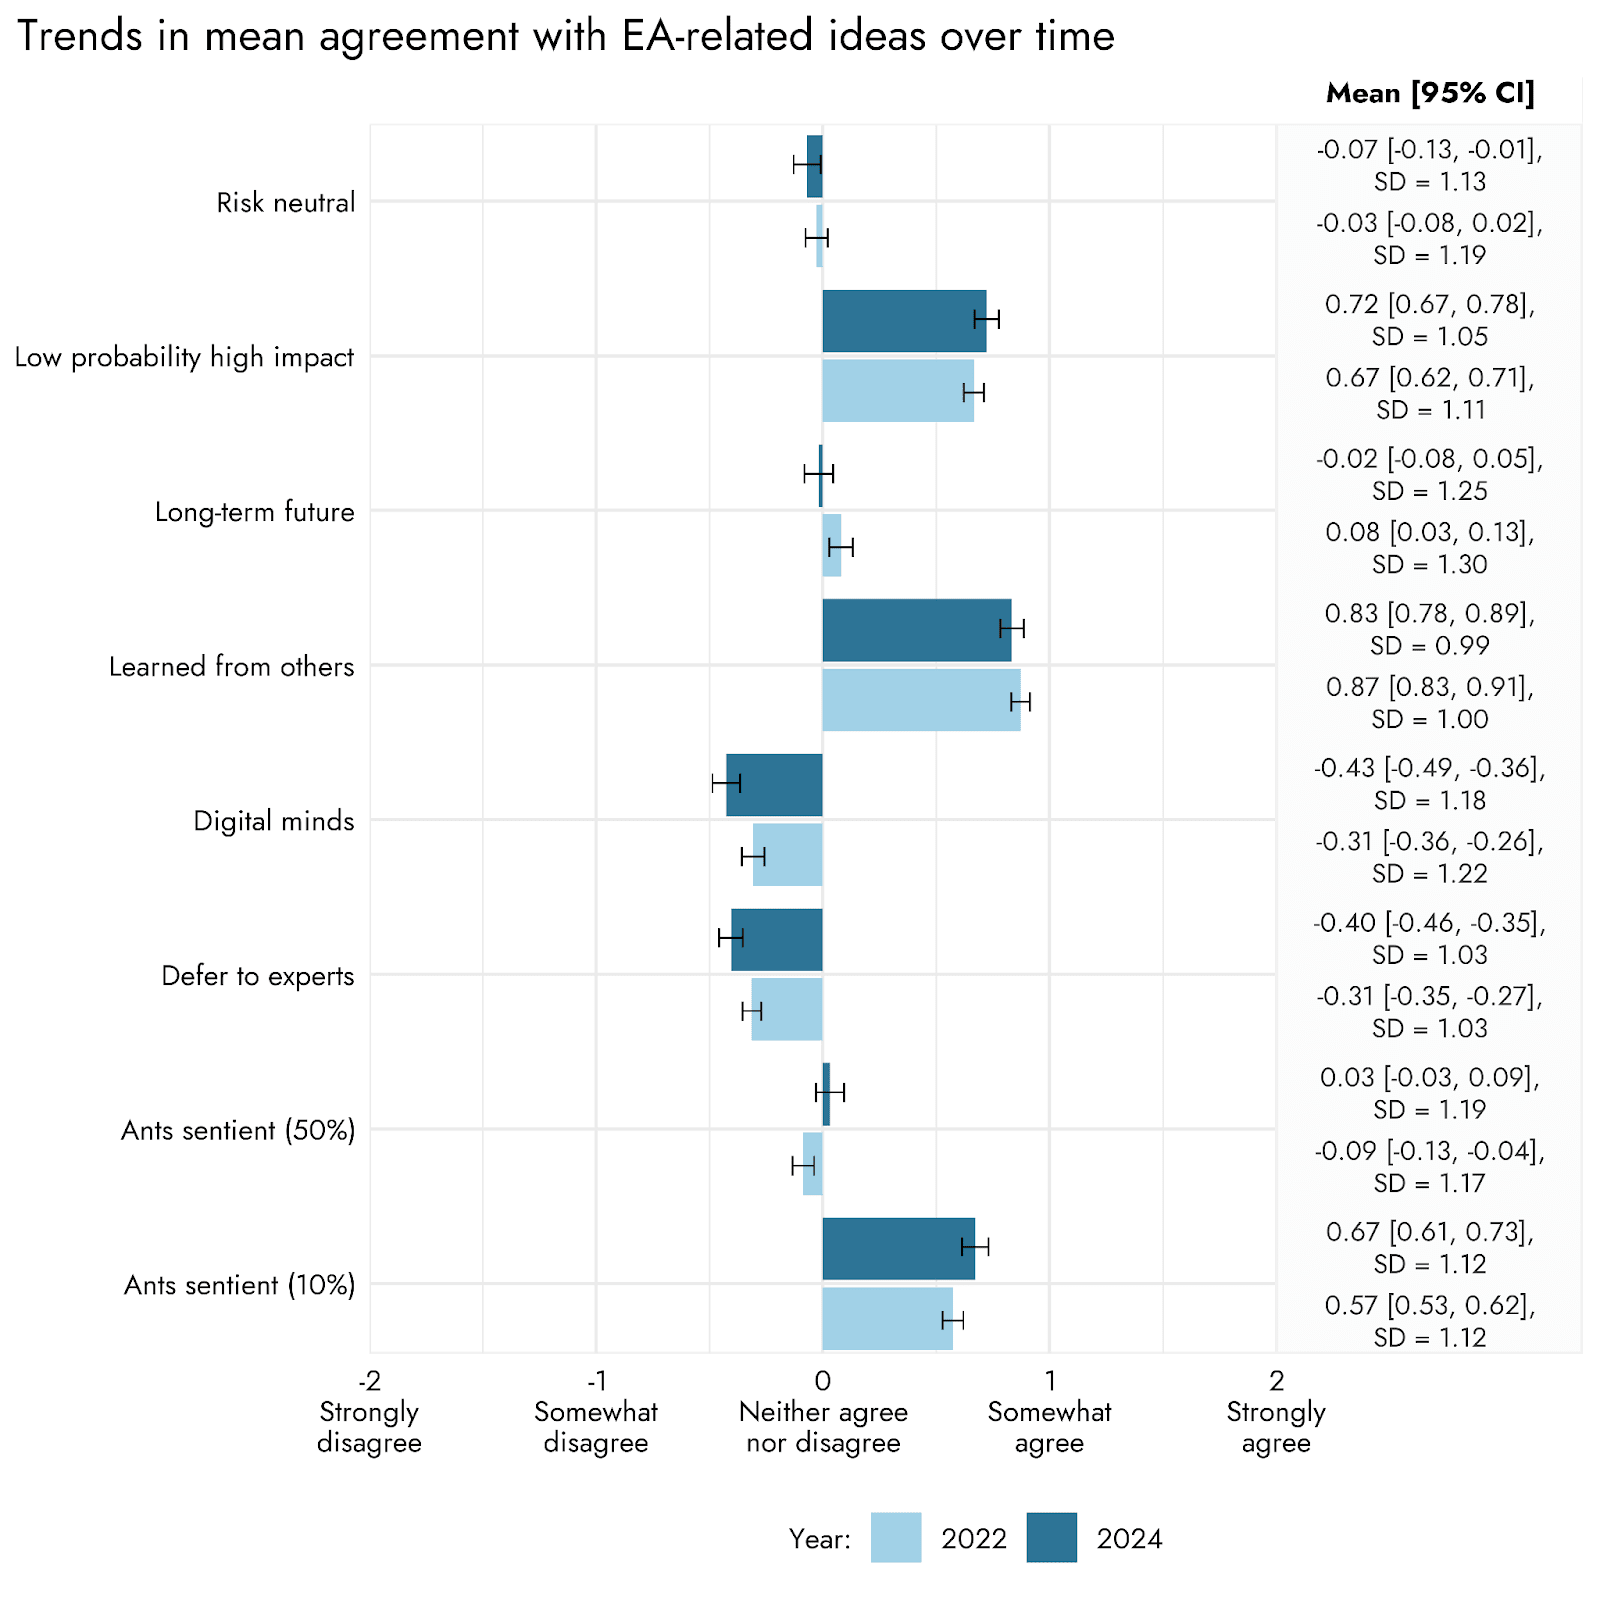
Since the 2022 EA survey, when these questions were first included, endorsement of each idea has remained relatively stable.
There was slightly more agreement, on average, with ideas about the likelihood of ant sentience and digital minds being the biggest source of future value in 2024 compared to 2022. Meanwhile, mean agreement with longtermism and deferring to mainstream experts decreased slightly since 2022. Notably, these changes were very small; each mentioned change was an absolute difference between years of ~0.1, i.e., a tenth of a point on the agreement scale.
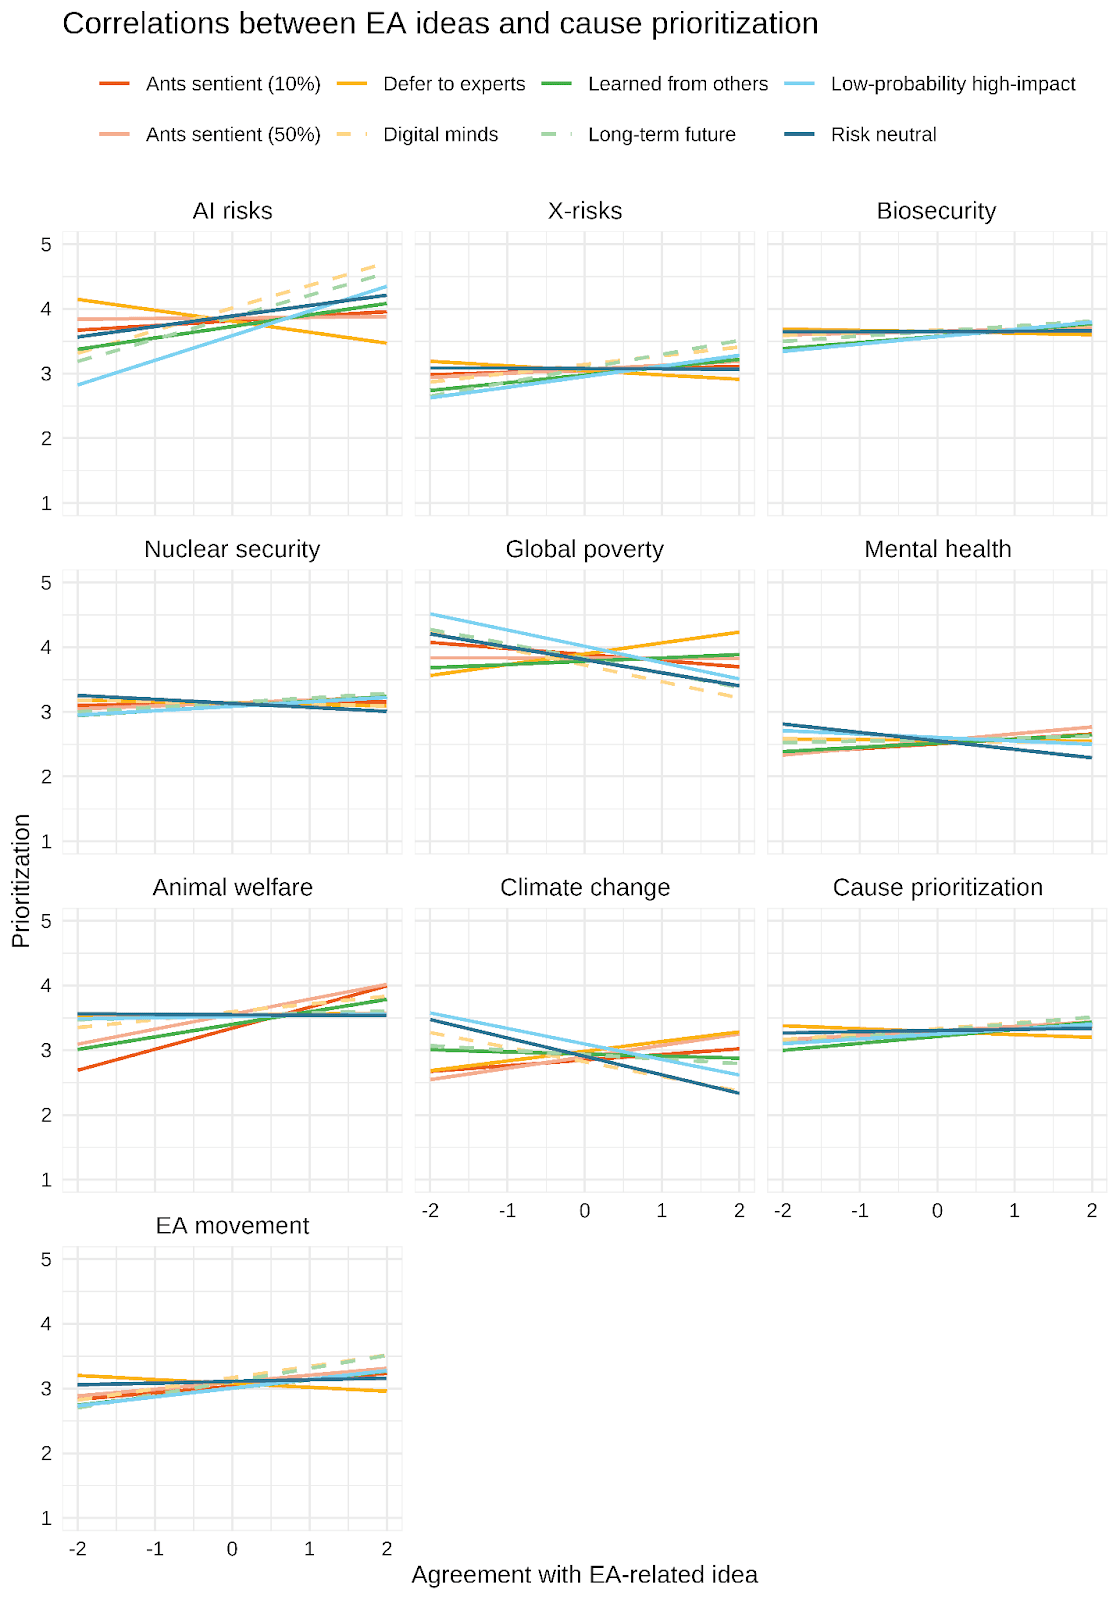
Relationship between ideas and causes
Endorsement of the EA-related ideas predicted some cause prioritizations.
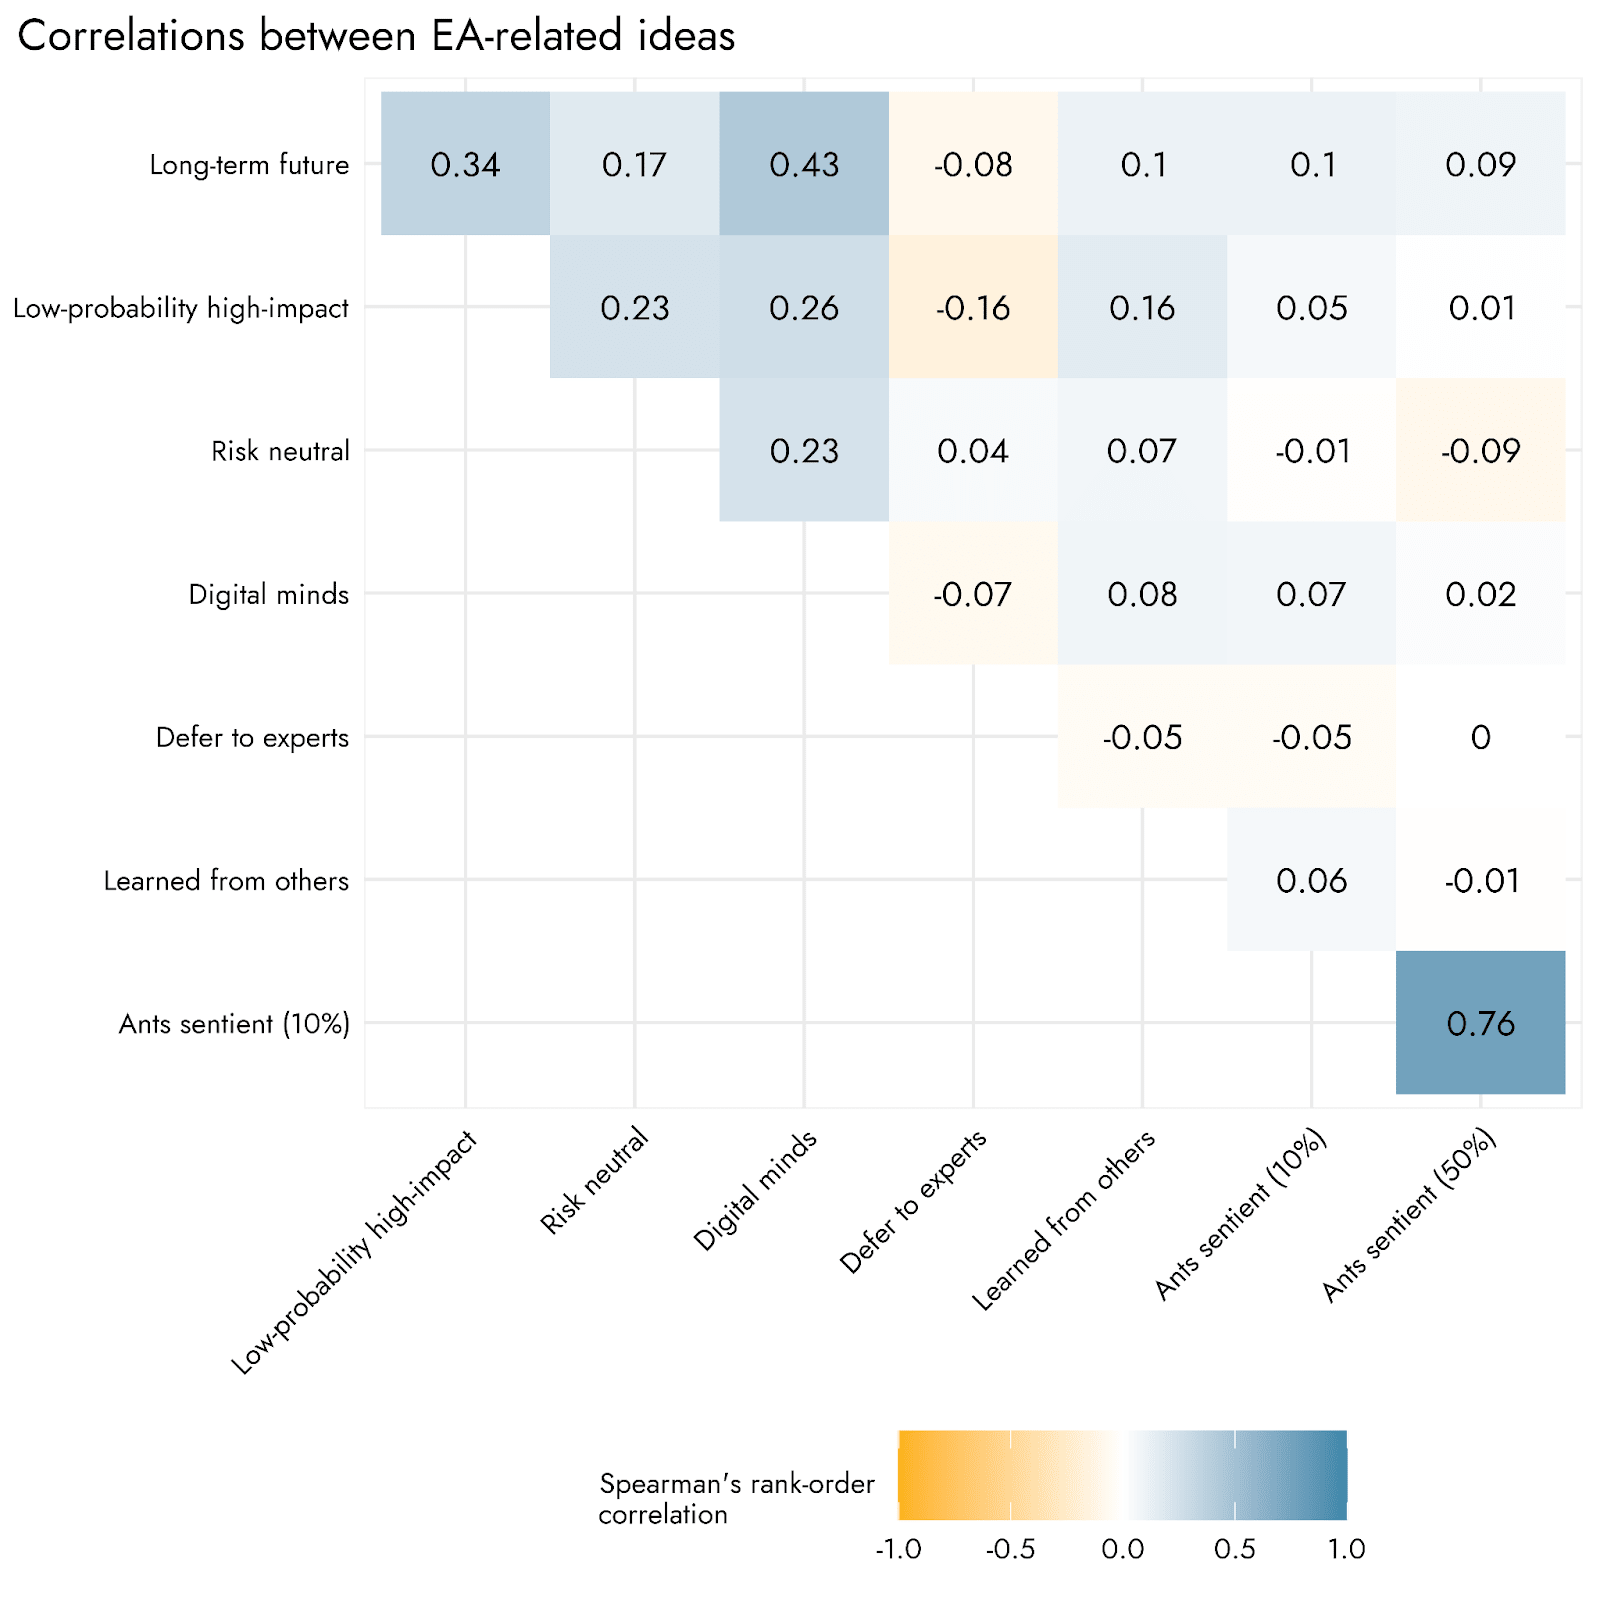
We found moderate positive associations (reported in the Appendix) between ideas relating to longtermism (“long-term future”), risk neutrality (“risk neutral”), expected future value of digital minds (“digital minds”), and low-probability high-impact interventions (“low-probability high-impact”). As a group, these ideas had stronger positive associations with AI risks than with other X-risks. Likewise, endorsing these ideas was related to prioritizing global health and poverty and climate change less. Interestingly, prioritizing AI risks highly was also associated with disagreeing with EA deferring to mainstream experts.
Agreeing with EA-ideas was not strongly related to cause prioritizations relating to bio- and nuclear security, mental health, and cause prioritization research.
Finally, ideas about the likelihood that ants have sentient experience were strongly correlated with each other and were both positively associated with prioritizing animal welfare more highly.
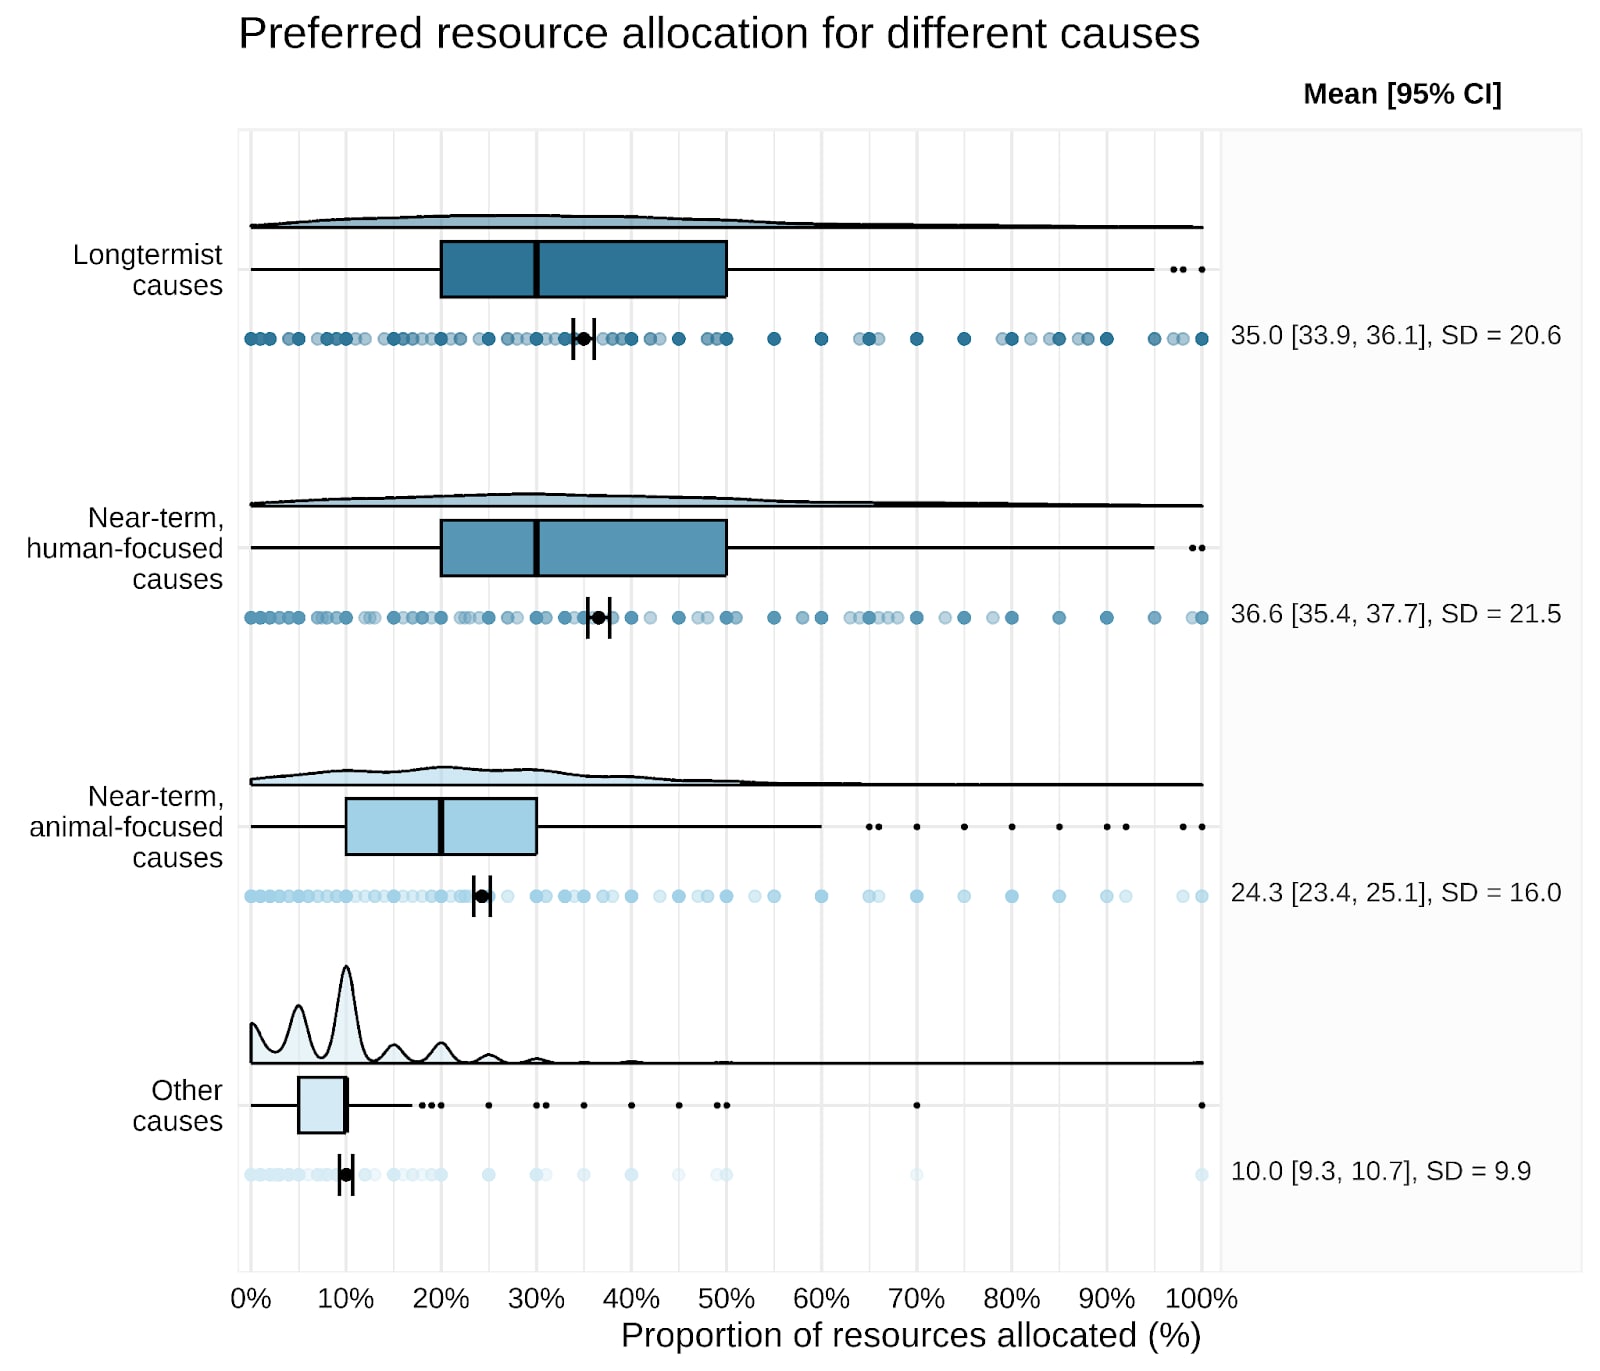
Allocation of resources across causes
This year, we also asked respondents to indicate what proportion (0-100%) of EA’s resources should be allocated to longtermist cause areas, near-term human-focused cause areas, near-term animal-focused cause areas, and other cause areas.
Allocations were largely in line with cause prioritizations: Longtermist and near-term, human-focused causes received the most resources (~35% each), while animal welfare received a smaller but sizable proportion, and on average, 10% of resources were allocated to causes outside these broad categories.
Notably, there was a lot of variability within the allocations for each cause. For each cause area, a few responses indicated an allocation of all resources. Likewise, all cause area categories had some respondents who did not allocate them any resources at all.
The relationship between resource allocations and cause prioritizations was within expectations, e.g. higher prioritization ratings for each cause were associated with higher allocations to the associated cause category (see Appendix).
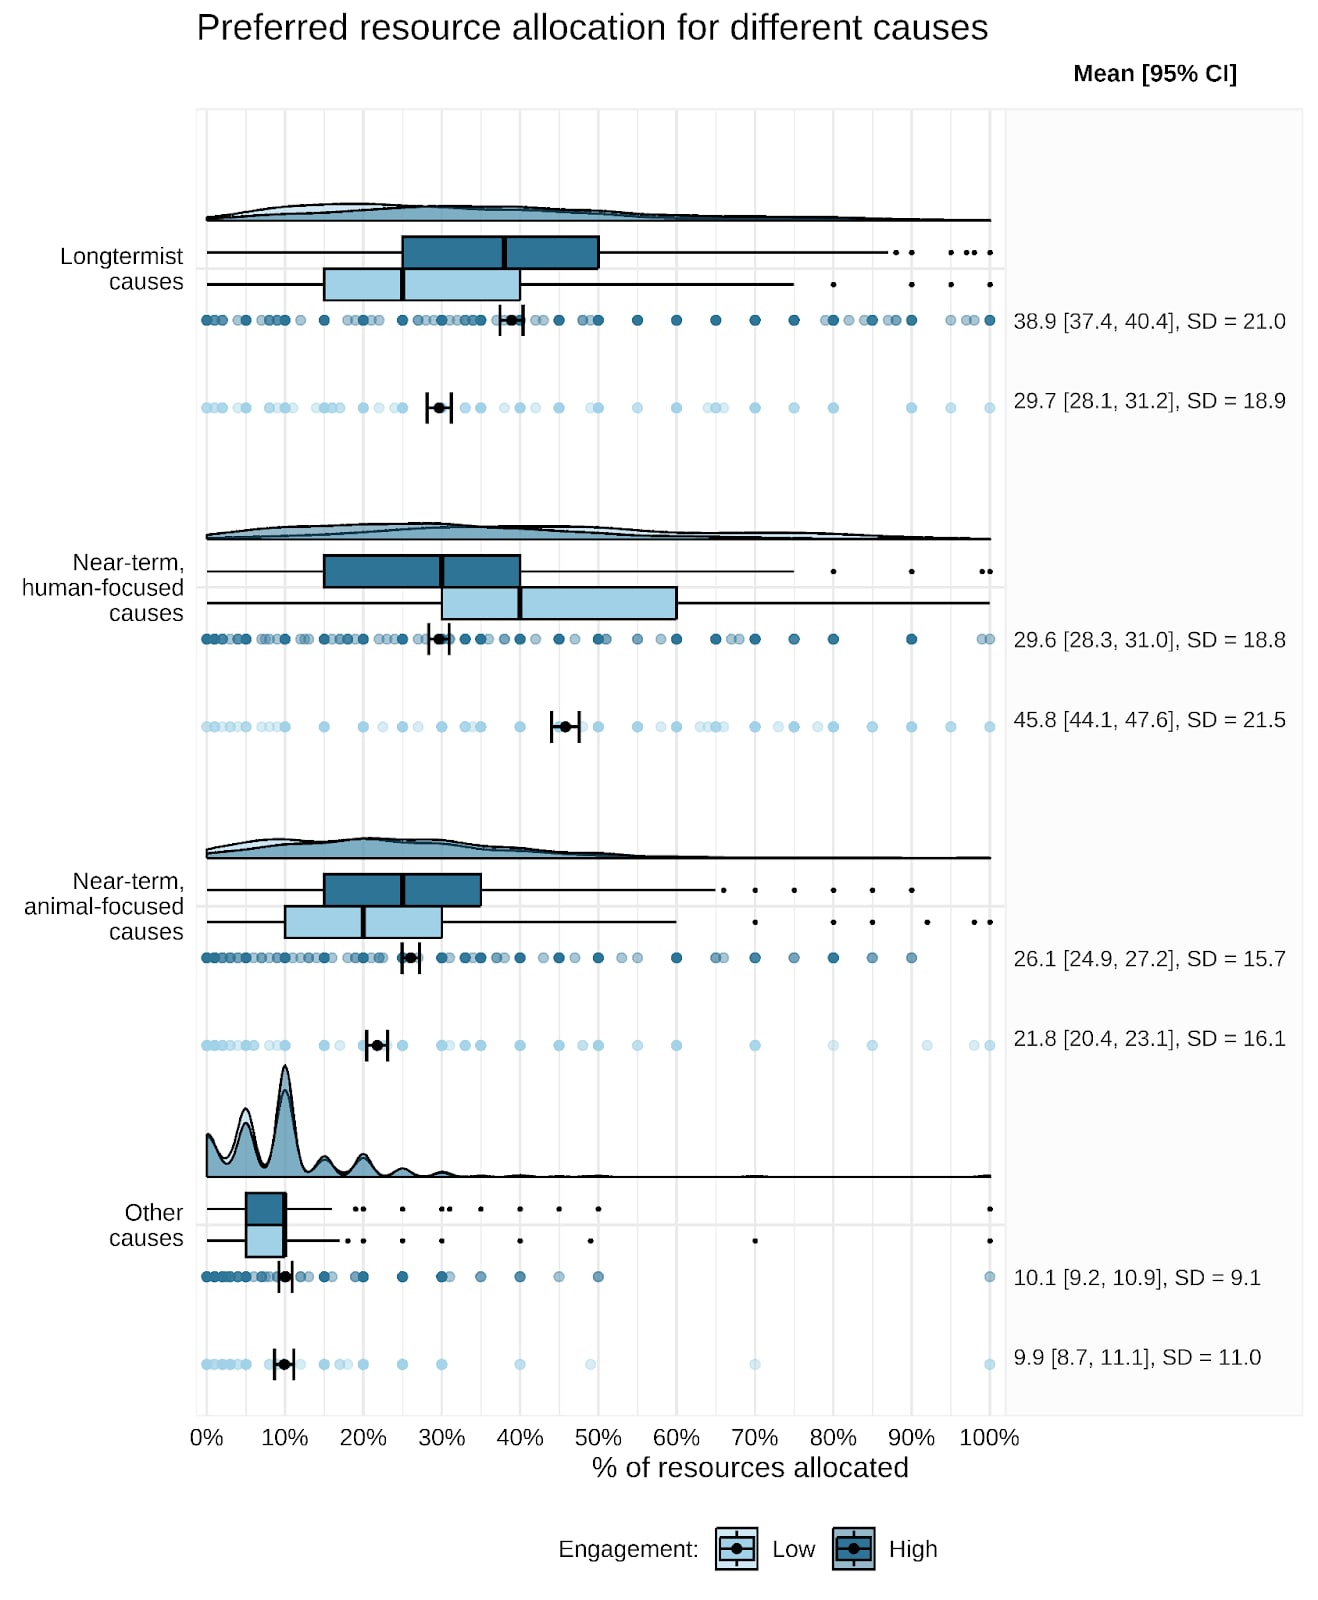
By Engagement
When we split responses by the low and high engagement brackets, we find a pattern similar to that in the cause prioritizations as well. That is, respondents who consider themselves less engaged allocated more resources to near-term, human-focused causes than any other category and relative to those with higher engagement. Highly engaged respondents showed the opposite pattern, allocating more resources to longtermist causes and animal-focused causes. Engagement did not relate to the proportion of resources allocated to cause areas outside the three categories.
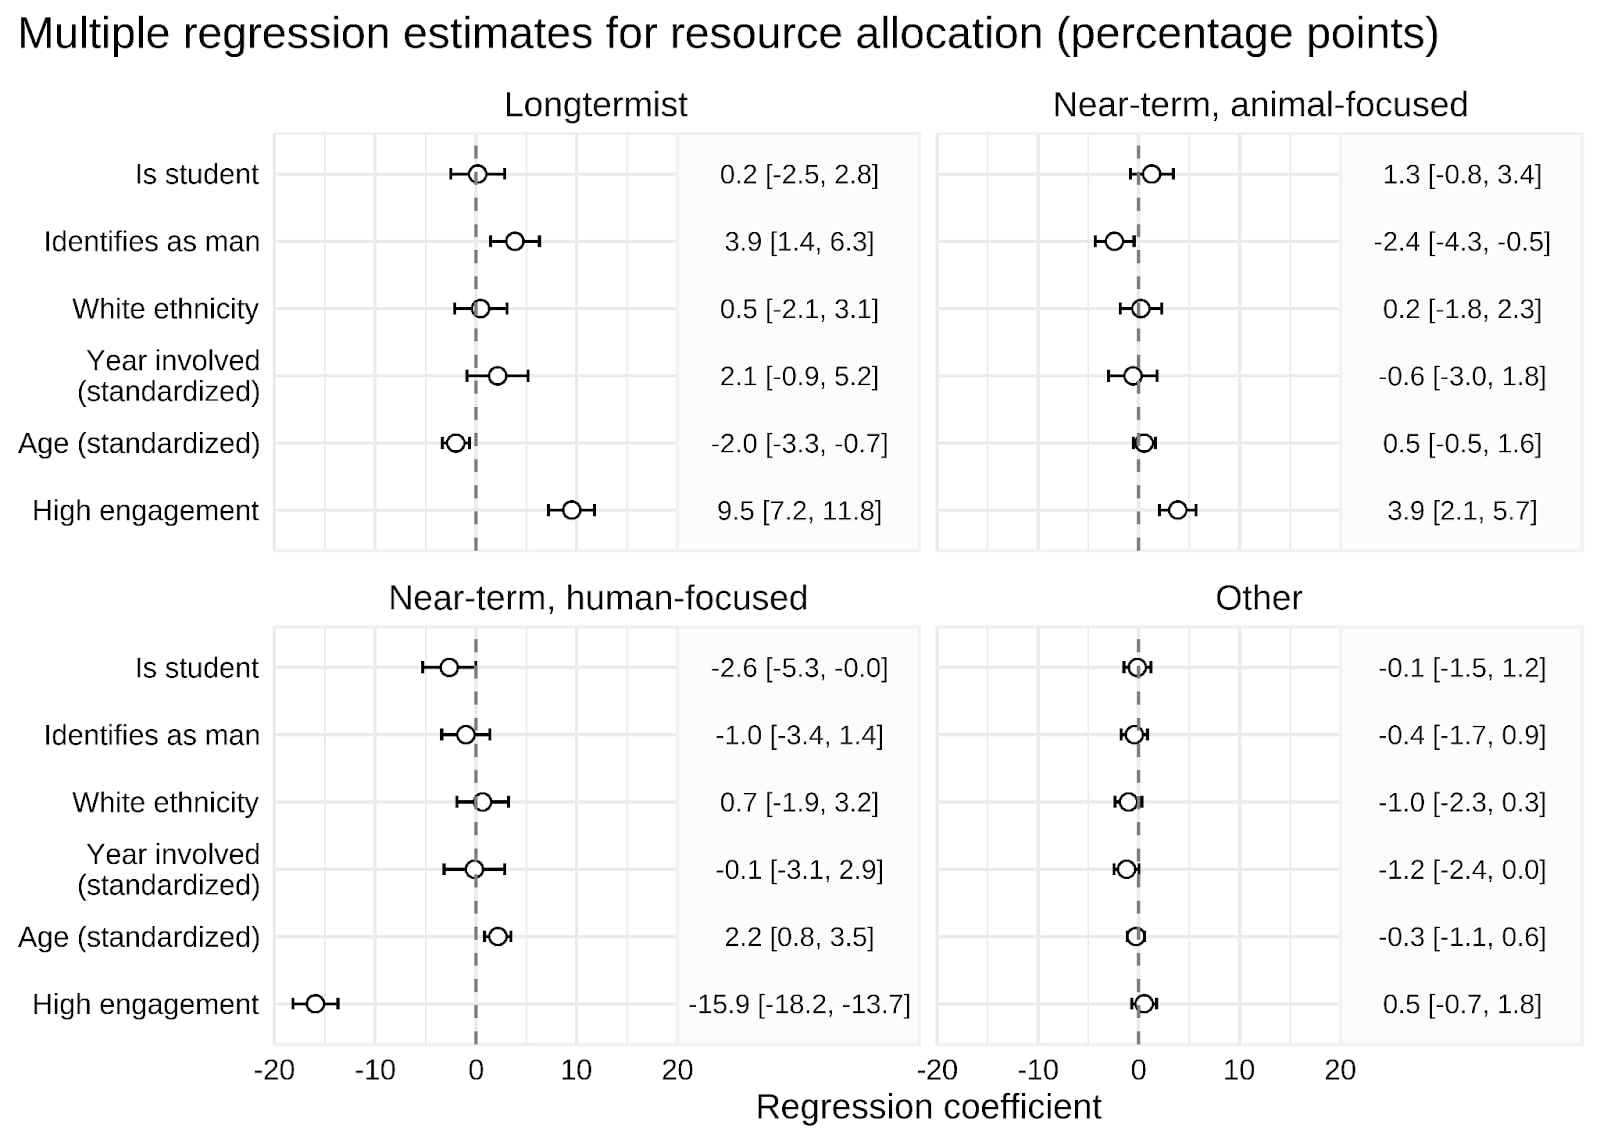
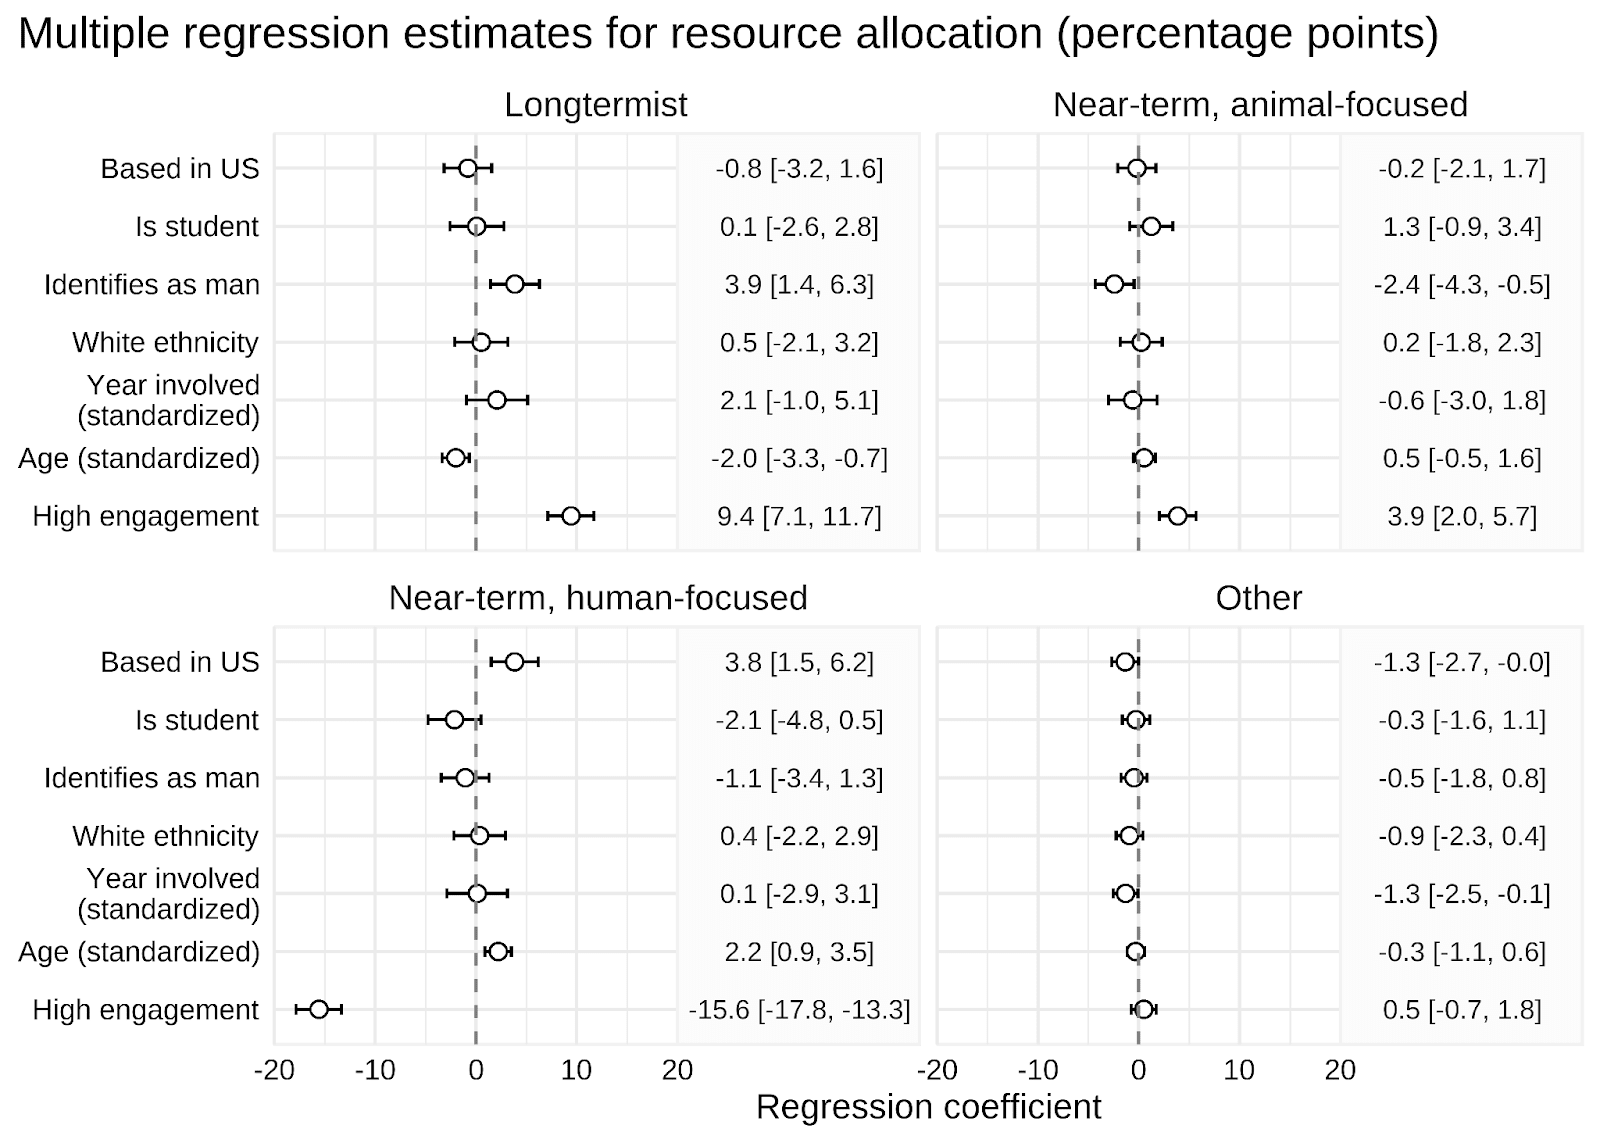
Factors linked with resource allocation
To investigate the factors that might explain these allocations, we ran a multiple linear regression model that included the same factors as the analyses on cause prioritization. We ran a model for each of the four cause area allocations.
Only engagement with EA seemed to affect resources allocated to each cause area. Respondents with high EA engagement tended to allocate much fewer resources to near-term, human-focused causes than those who considered themselves less engaged in EA. In contrast, allocations to longtermist causes had the opposite association with engagement. Likewise, higher engagement with EA was associated with slightly higher allocations to animal welfare.
Additionally, identifying as a man (compared to not) was marginally associated with allocating more resources to longtermist causes. Similarly, being a student (compared to not) was marginally associated with allocating fewer resources to near-term, human-focused causes.
No other factors had substantial relationships with resource allocations.
Acknowledgments

Authors: Julie Pedersen, David Moss. Thanks to Urszula Zarosa for editing.
Appendix
Methodological notes on cause prioritization, linear regressions
We conducted multiple additional analyses to ensure the reported analyses were appropriate.
We verified that the reported regressions respected the 1-5 scale of the prioritization ratings within the observed range of all predictors.
To verify that the linear regression models were appropriate for predicting cause prioritization ratings, we compared them to multiple alternatives to account for (a) issues with dichotomising categorical variables and (b) non-linearity of effects:
- A linear regression model with all levels of dichotomised, categorical variables, e.g., each country of residence has its own effect
- A random forest model fitted to all demographic information in the dataset, with all levels of categorical variables
We reliably found no or negligible differences in out-of-sample prediction. Therefore, we report the linear regressions with dichotomised predictors as they are easier to interpret.
While the alternative analyses did not increase explanatory power, they made clear that the effects of country of residence were misleading. Therefore, we decided to drop them from the analyses.
The original regression analyses (shown below) indicated effects of residing outside the US on prioritizations of AI risks, climate change, other X-risks, and mental health. Using the partial dependence plots from the random forest models, which show the predicated prioritization of the outcome of interest across all levels of a variable, we were able to investigate this further. The partial dependence of country of residence for AI risks, mental health, other X-risks, and climate change prioritizations are shown below. They indicate that (1) country effects may be highly variable between countries, (2) in no case was the US different from the tendencies of most countries, and (3) linear model effects were most likely driven by specific countries with large deviance from the general trends (e.g., the Philippines and India). Result (1) suggests the dichotomization of this variable will most likely not be informative. Results (2) and (3) specifically suggest that comparing the residents of the US and other countries is not meaningful.
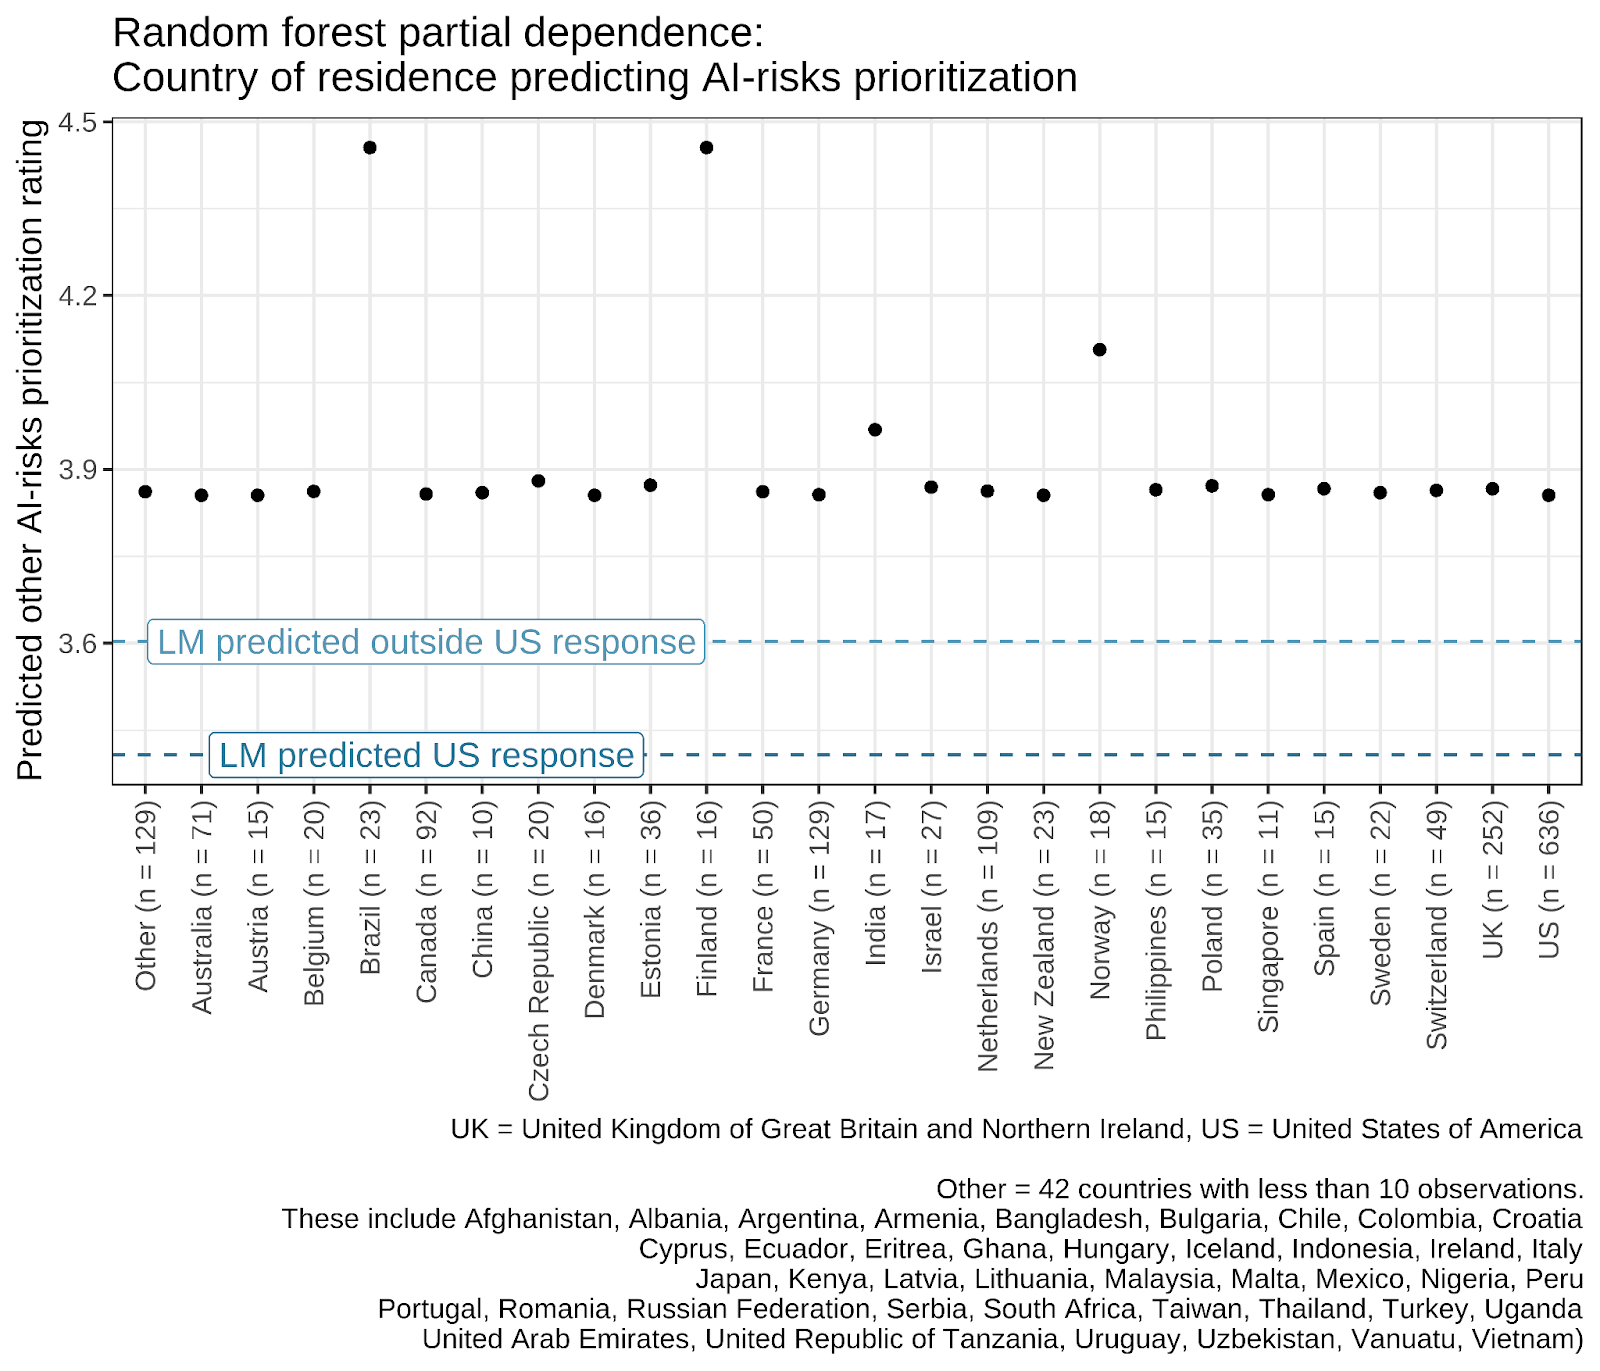
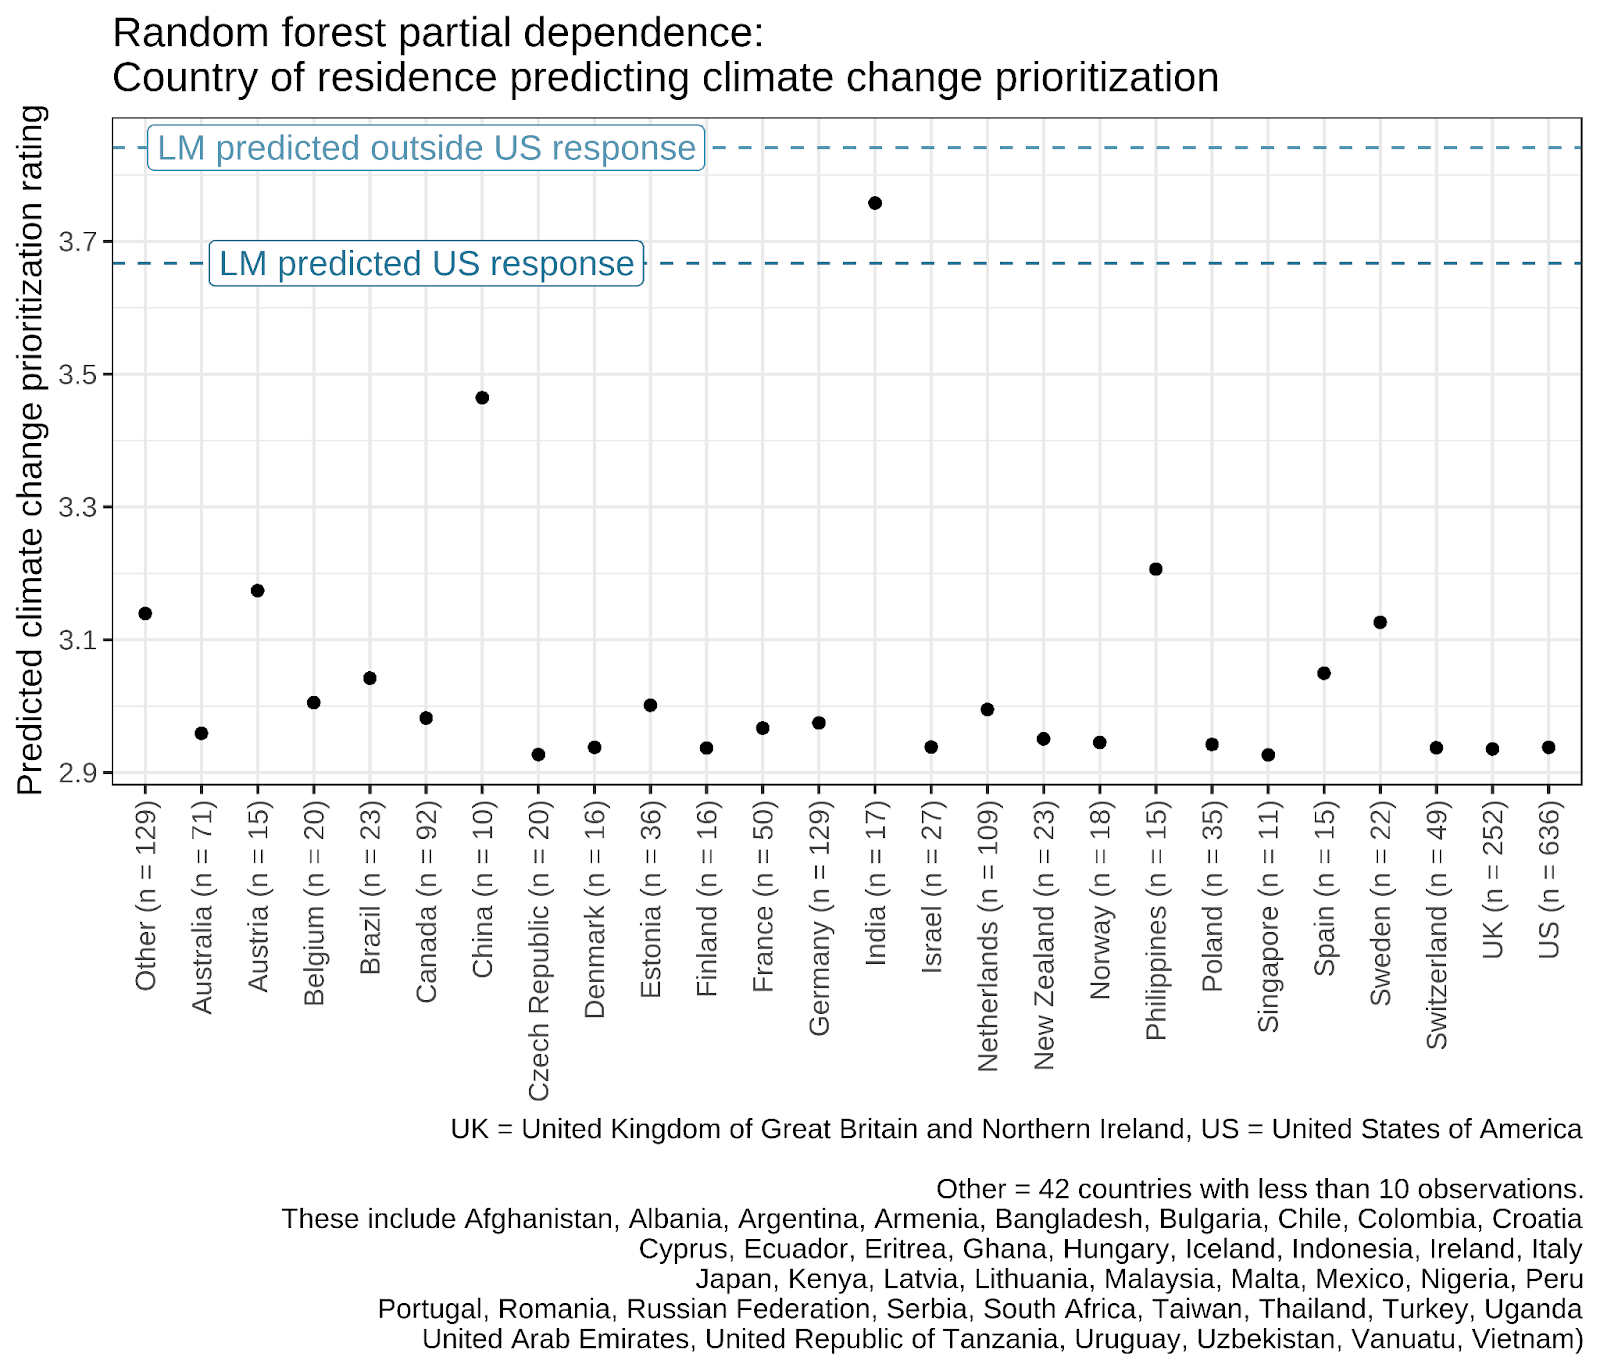
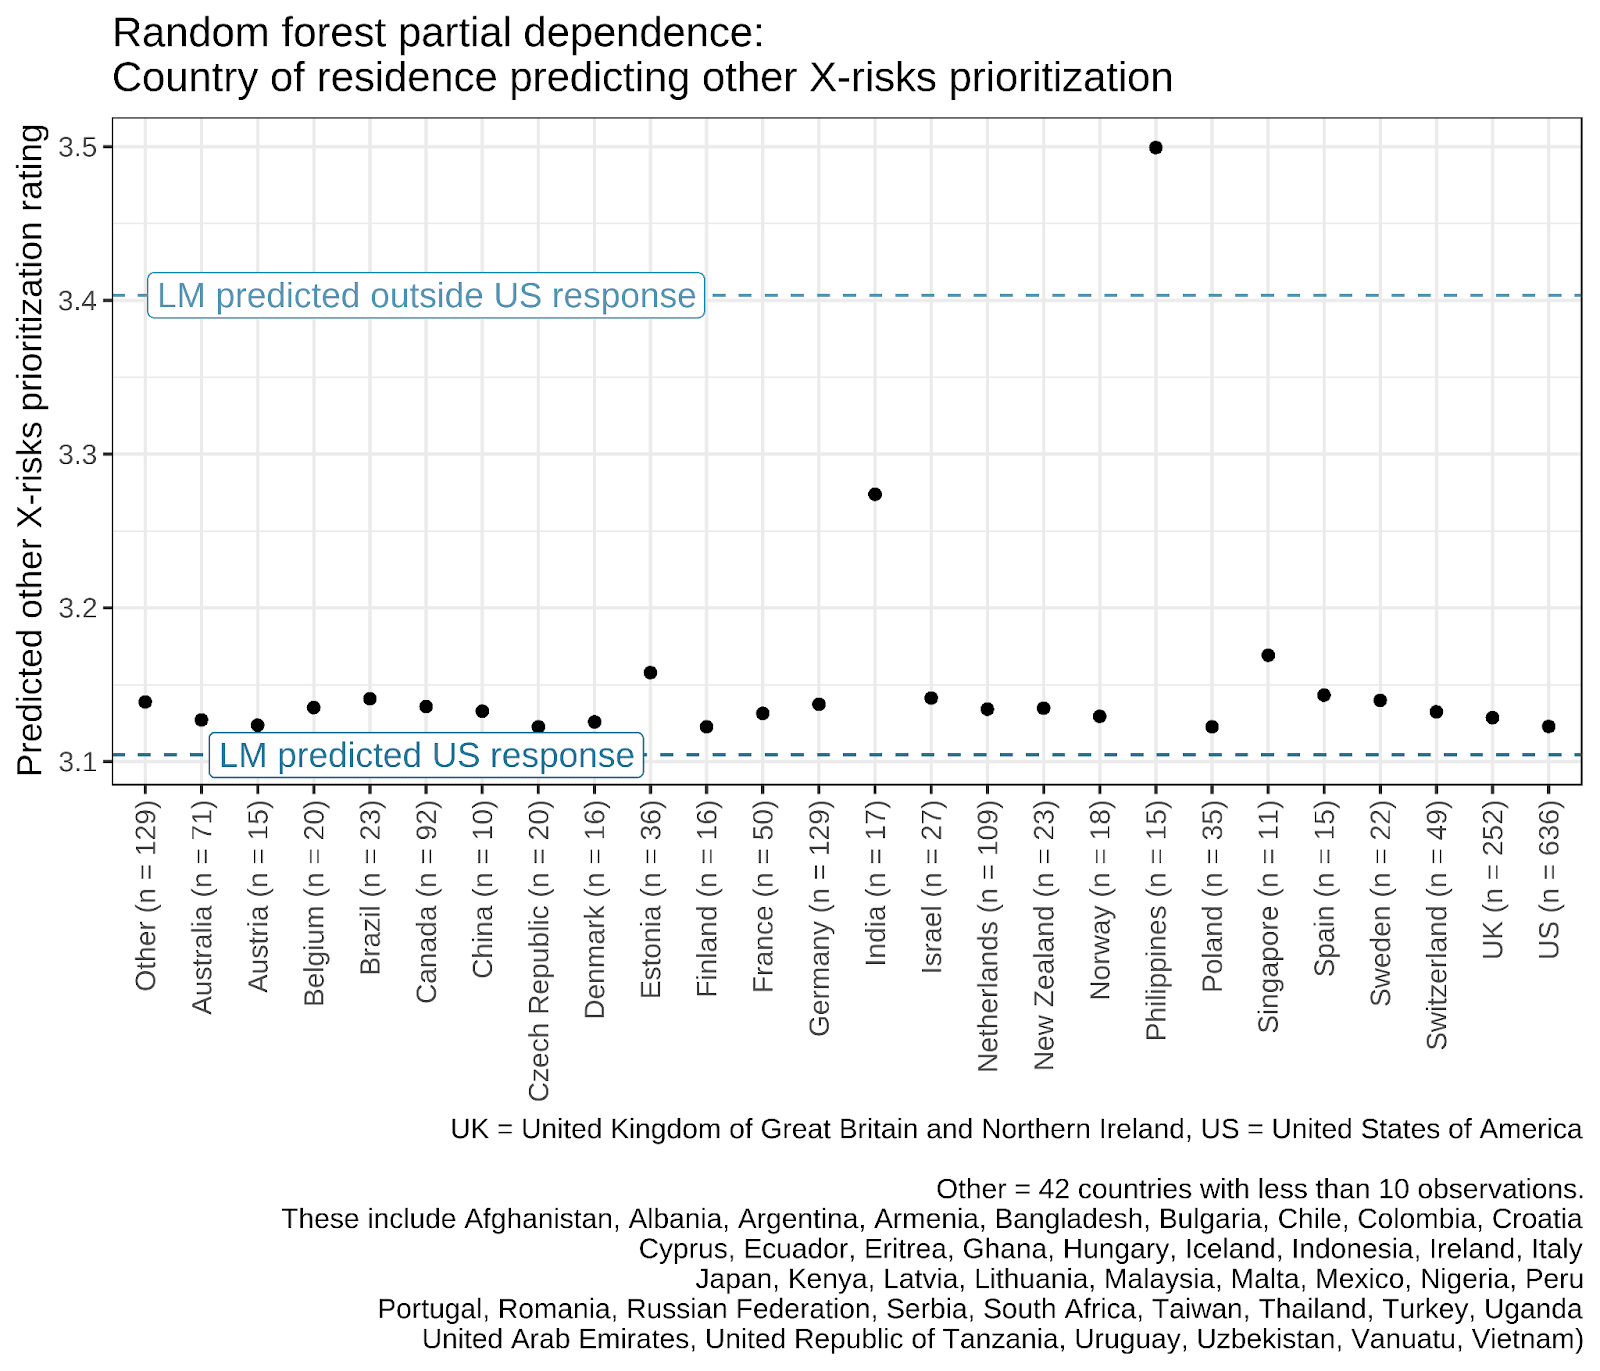
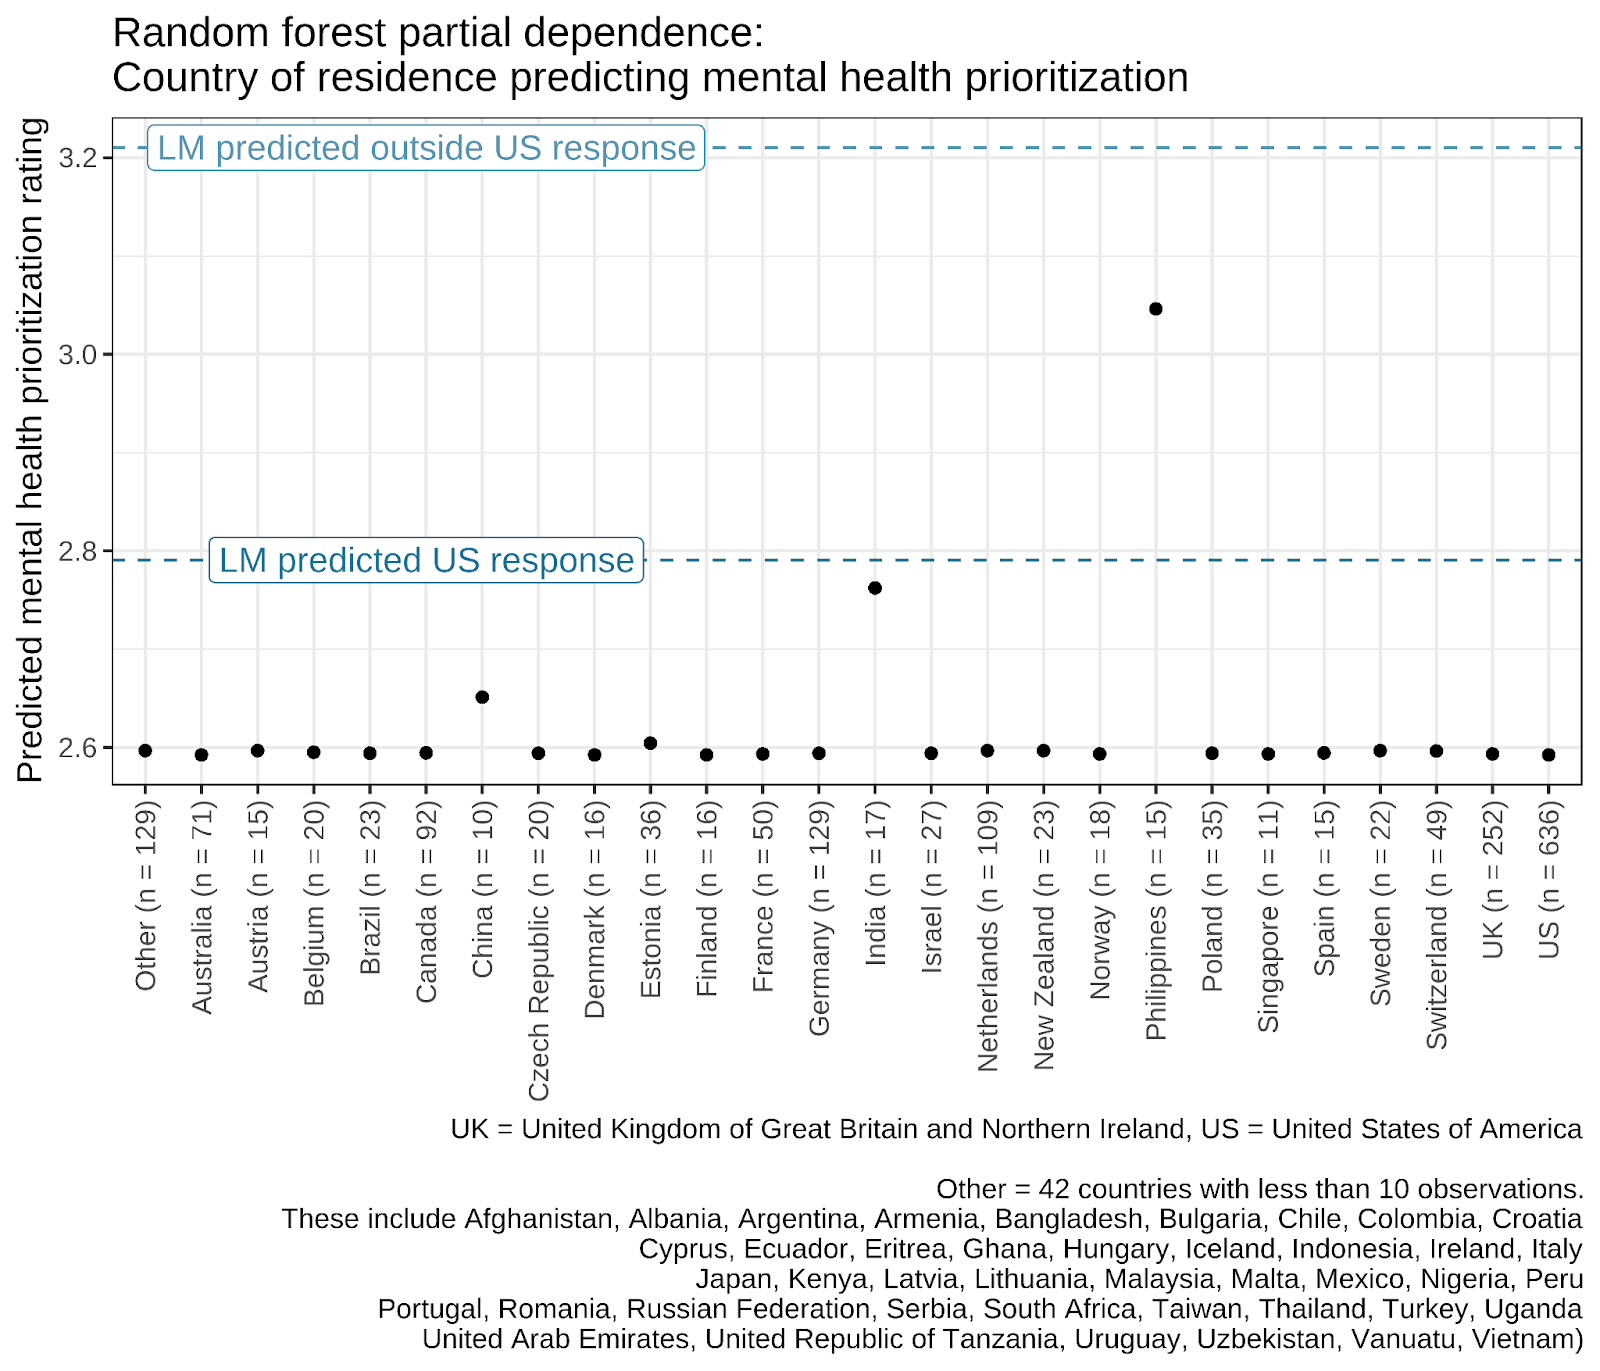
Note that the points in these plots are the random forest model predictions. The linear regression and random forest models were roughly equal in predicting out-of-sample data.
Additional partial dependence plots for cause prioritization linear regressions
Methodological notes on resource allocation linear regressions
Due to interpretability issues (discussed in the methodological notes on the linear regression model of cause prioritization ratings), we also removed being based in the US as a predictor in the modelling of resource allocations. The results, including this predictor, are provided below.
Associations between resource allocations and cause prioritization ratings


I take this as an indicator that we need to work harder to demonstrate that global mental health is a cause area worth investing in :)