David_Moss
Bio
I am the Principal Research Director at Rethink Priorities. I lead our Surveys and Data Analysis department and our Worldview Investigation Team.
The Worldview Investigation Team previously completed the Moral Weight Project and CURVE Sequence / Cross-Cause Model. We're currently working on tools to help EAs decide how they should allocate resources within portfolios of different causes, and to how to use a moral parliament approach to allocate resources given metanormative uncertainty.
The Surveys and Data Analysis Team primarily works on private commissions for core EA movement and longtermist orgs, where we provide:
- Private polling to assess public attitudes
- Message testing / framing experiments, testing online ads
- Expert surveys
- Private data analyses and survey / analysis consultation
- Impact assessments of orgs/programs
Formerly, I also managed our Wild Animal Welfare department and I've previously worked for Charity Science, and been a trustee at Charity Entrepreneurship and EA London.
My academic interests are in moral psychology and methodology at the intersection of psychology and philosophy.
How I can help others
Survey methodology and data analysis.
Posts 74
Comments667
Have you tried any platforms other than Positly? (I ask because you wrote "I haven’t been able to fulfill this quota through either Positly." which made it sound like you had already tried someone else).
Prolific nominally have 570 active UK Muslims (though I would expect to recruit fewer than that cited number), and 299 in the US.
SurveyMonkey claim to be able to reach 500 US Muslims.
Feel free to DM me if further suggestions would be helpful. I would also approach surveying respondents from website like Prolific a little differently to how I would approach surveying from most panels (e.g. many more checks required on the latter, but potentially higher representativeness on the former).
Thanks for the useful post!
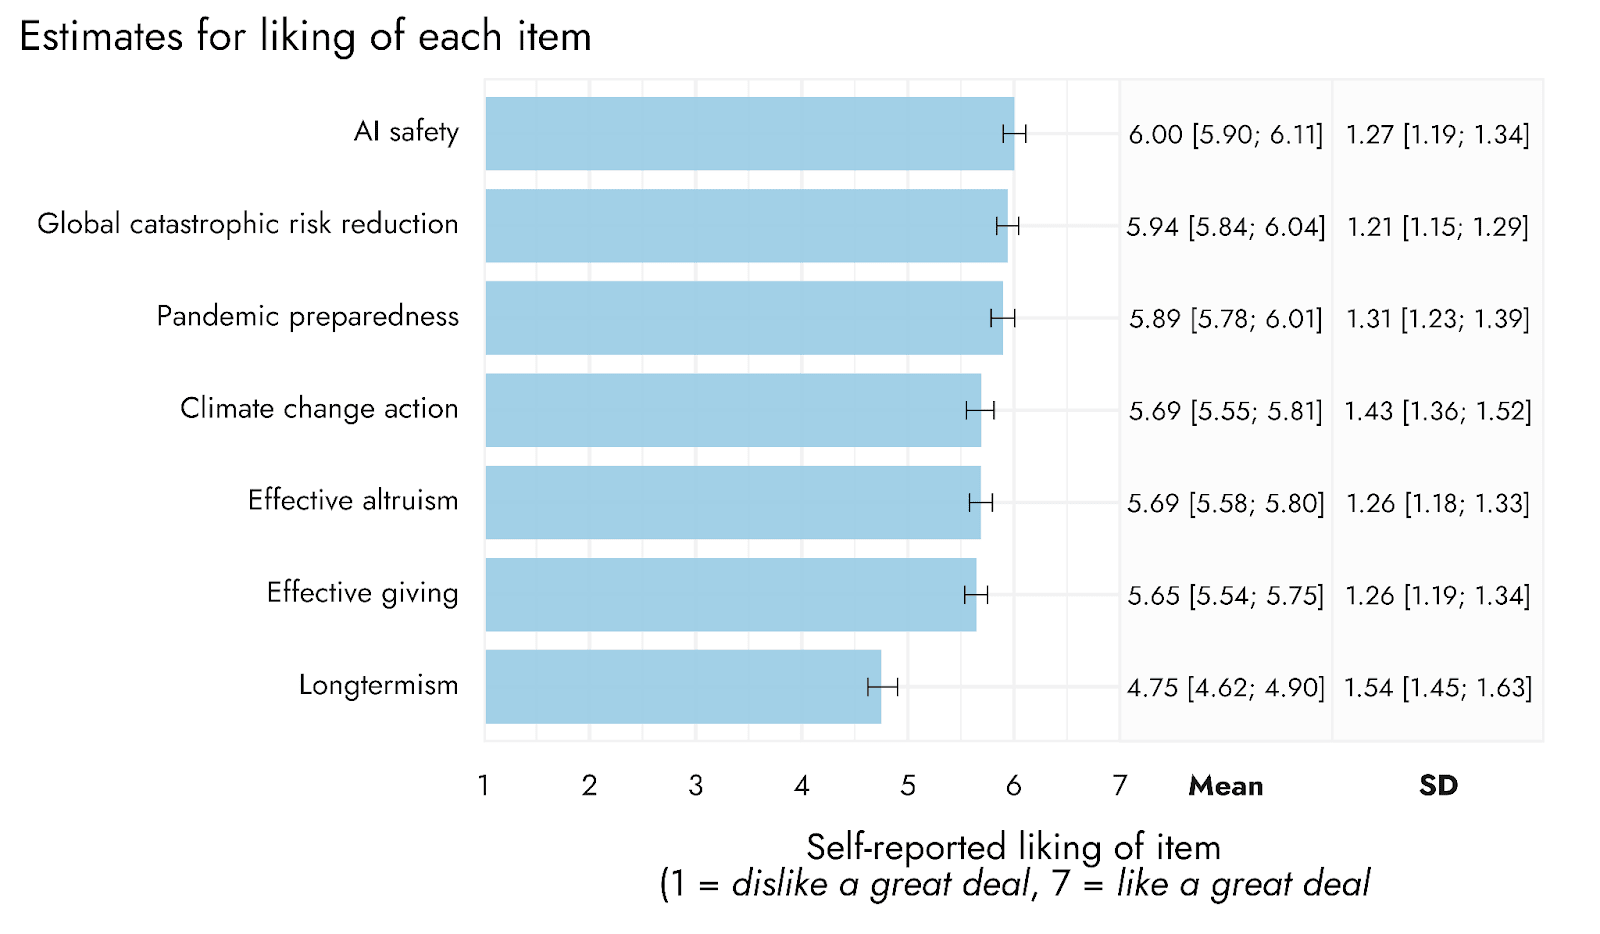
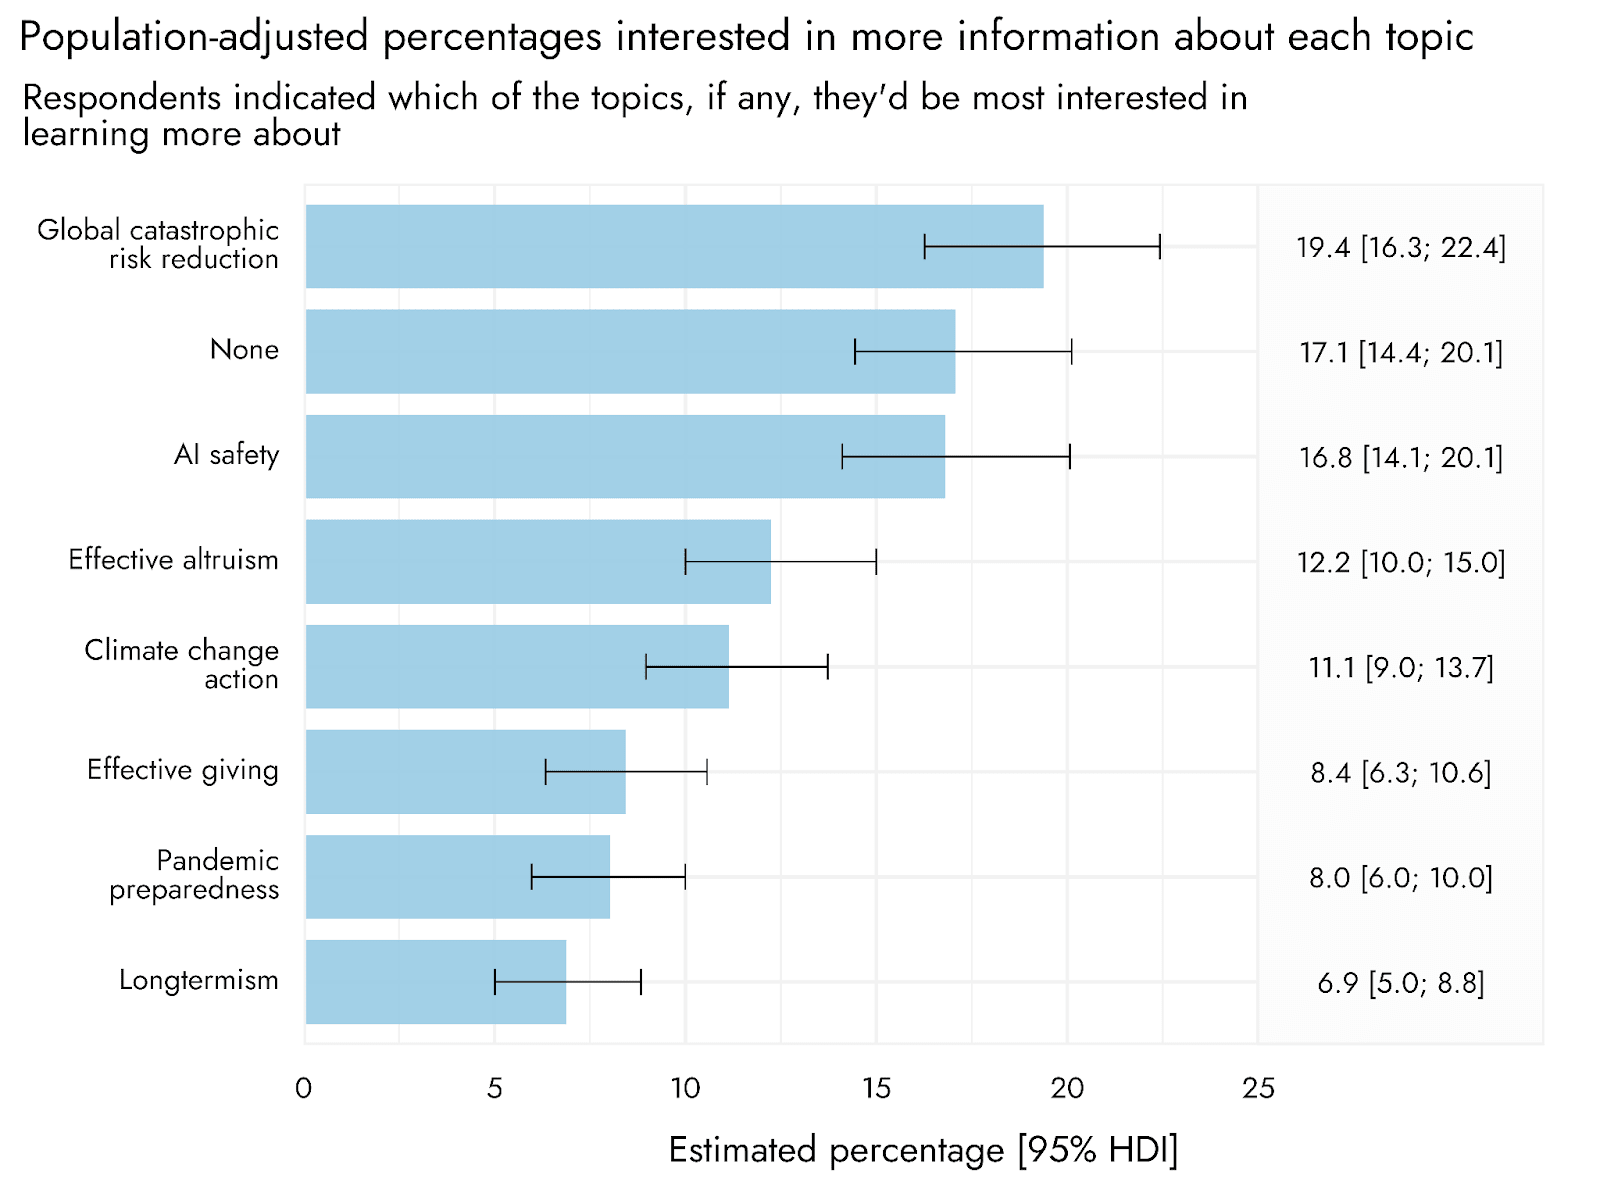
You may also be interested on our empirical studies on framing EA and longtermism.
We do, indeed, find that "longtermism" is distinctively unpopular as a framing. But messaging focused on global catastrophic risk reduction, or specific risks, such as AI safety in particular, performed quite well.
We're actually working on a new study examining EA vs AI framing specifically (including differences in who gets recruited by such framings). We'd welcome input on specific framings / elements to test.
Interestingly, community members' prioritisation of animal welfare appears to have been increasing in recent years. (https://forum.effectivealtruism.org/posts/CKwDgZGLipchAoxtN/ea-survey-2024-cause-prioritization#Trends_in_cause_prioritization_over_time)
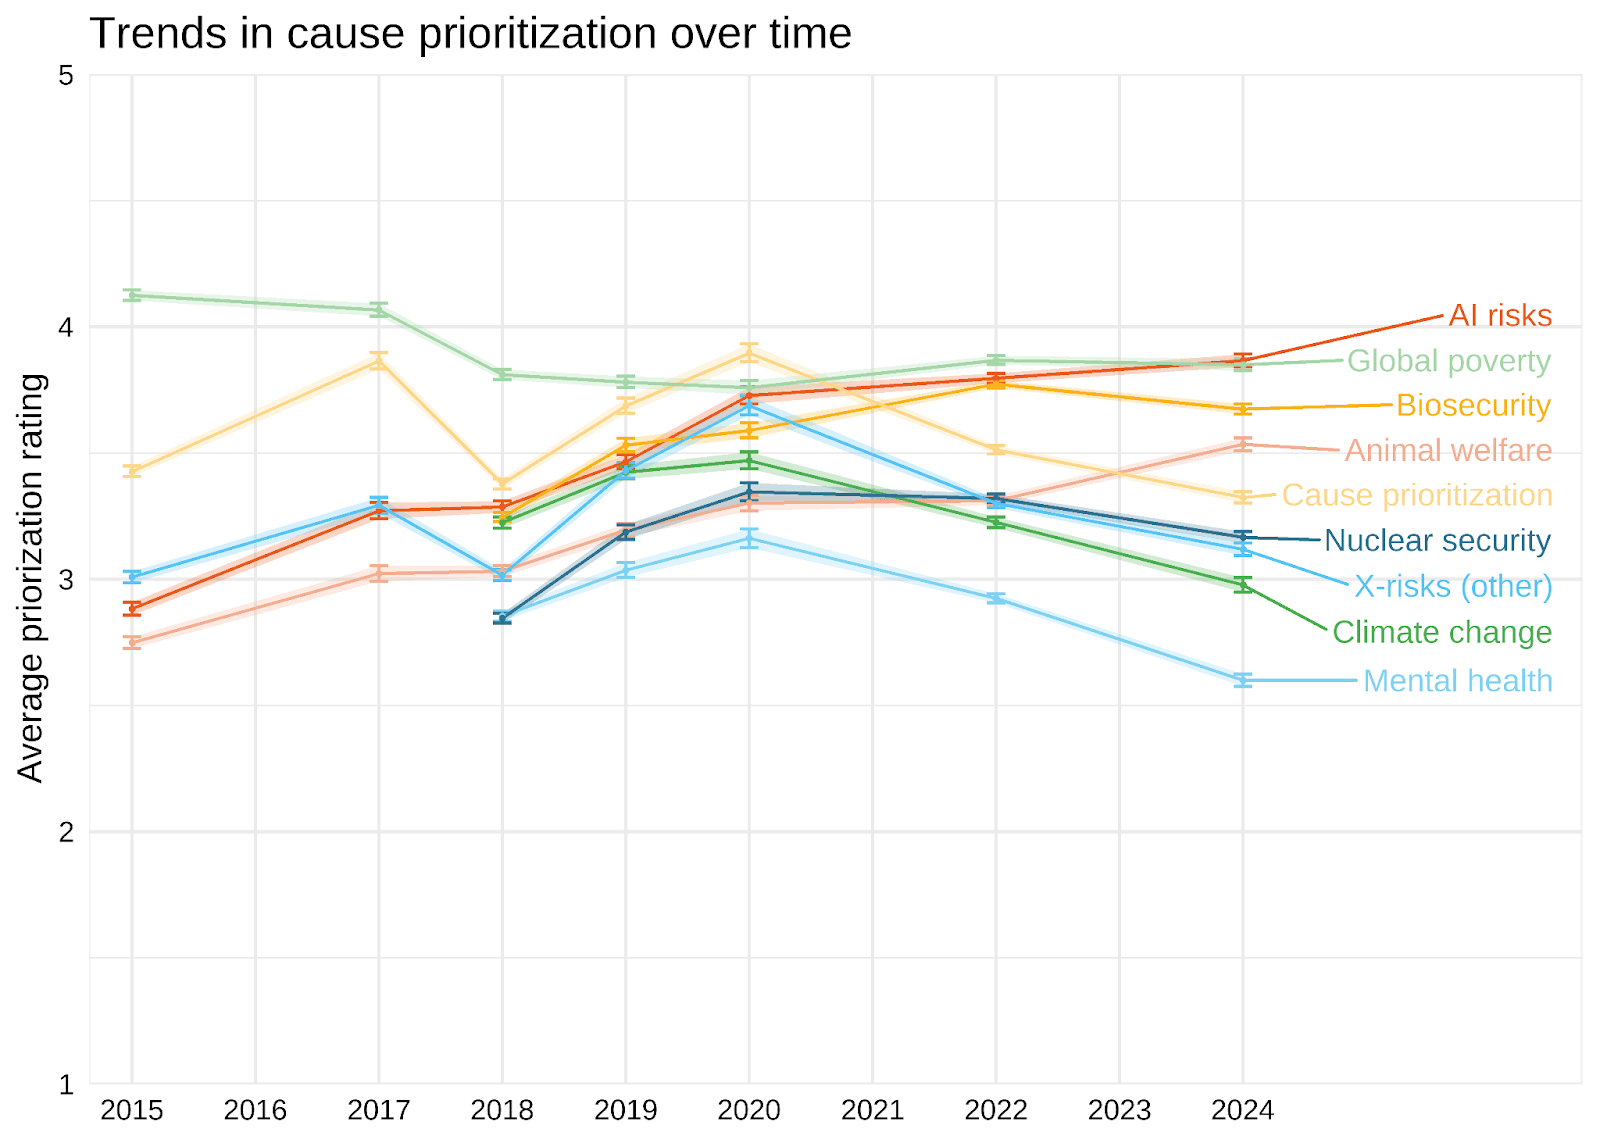
This is neither to agree or disagree with the observation about representation of animal welfare at EA conferences and such.
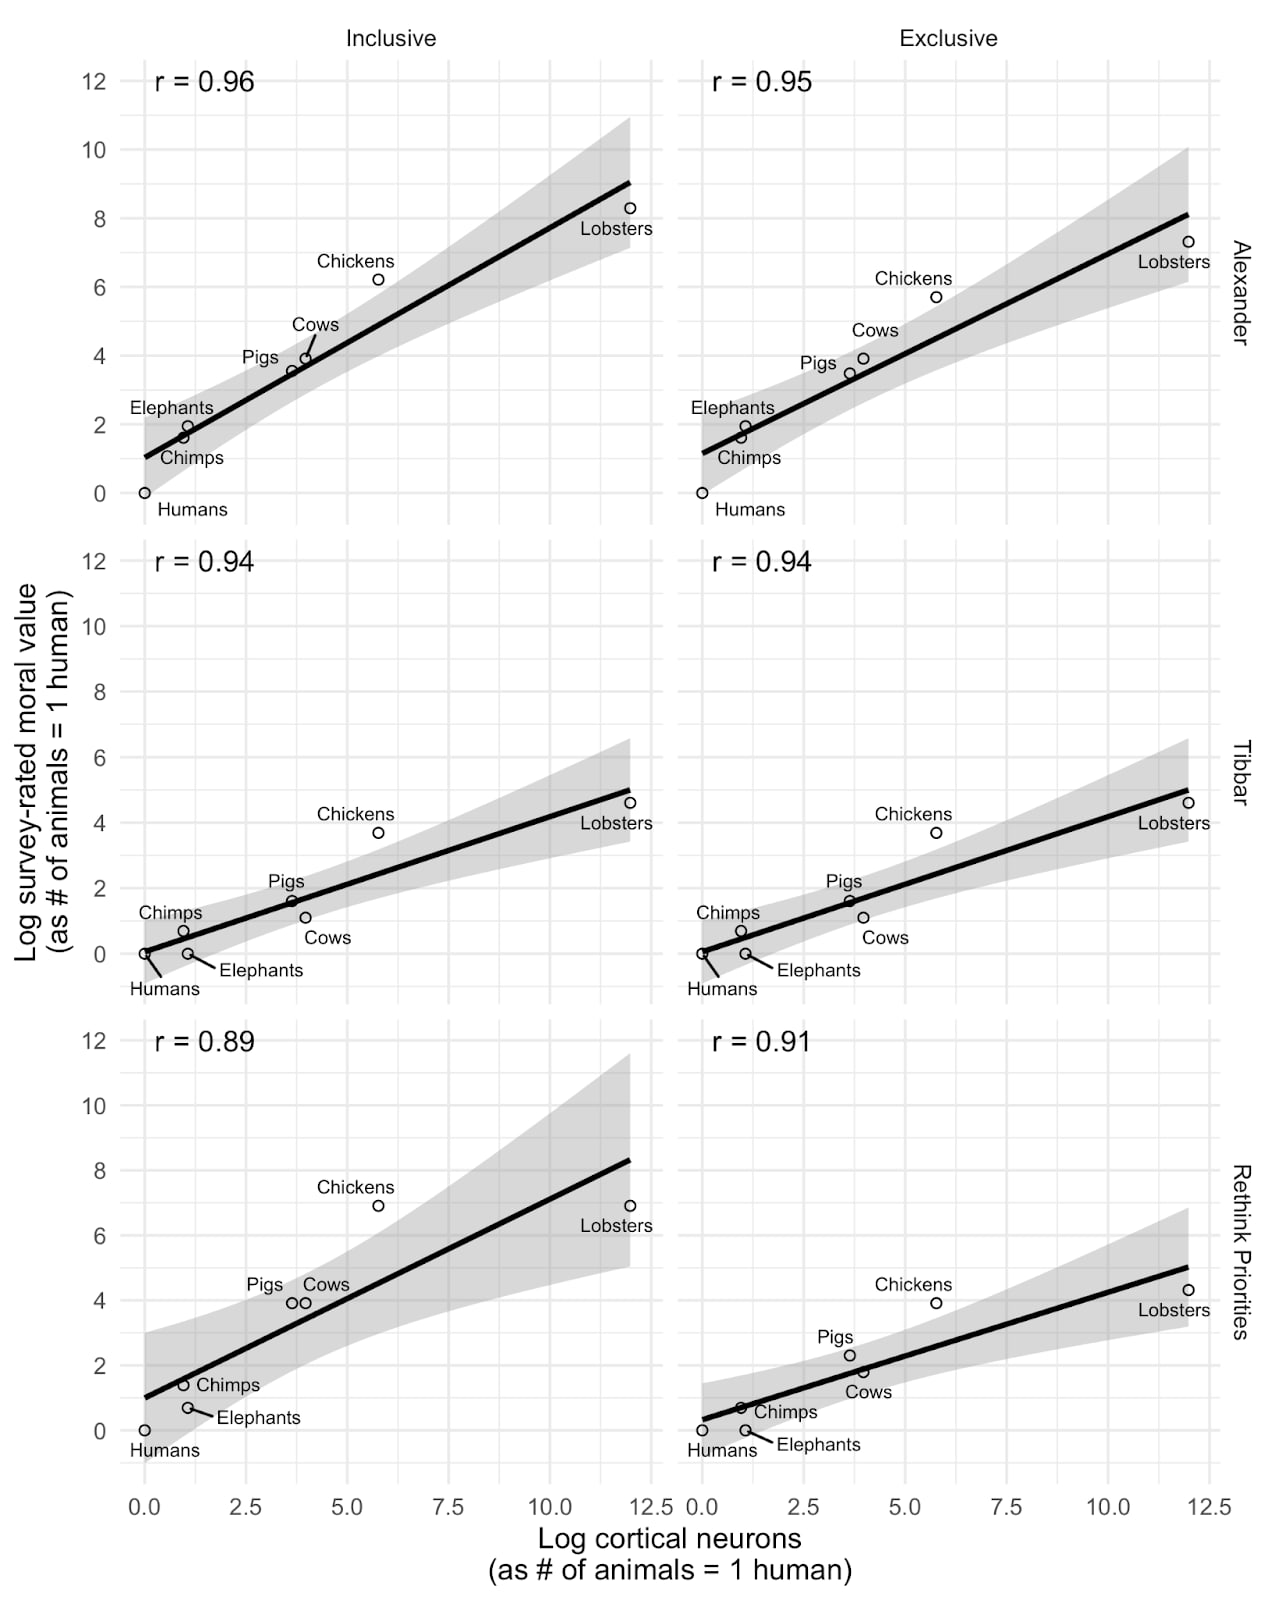
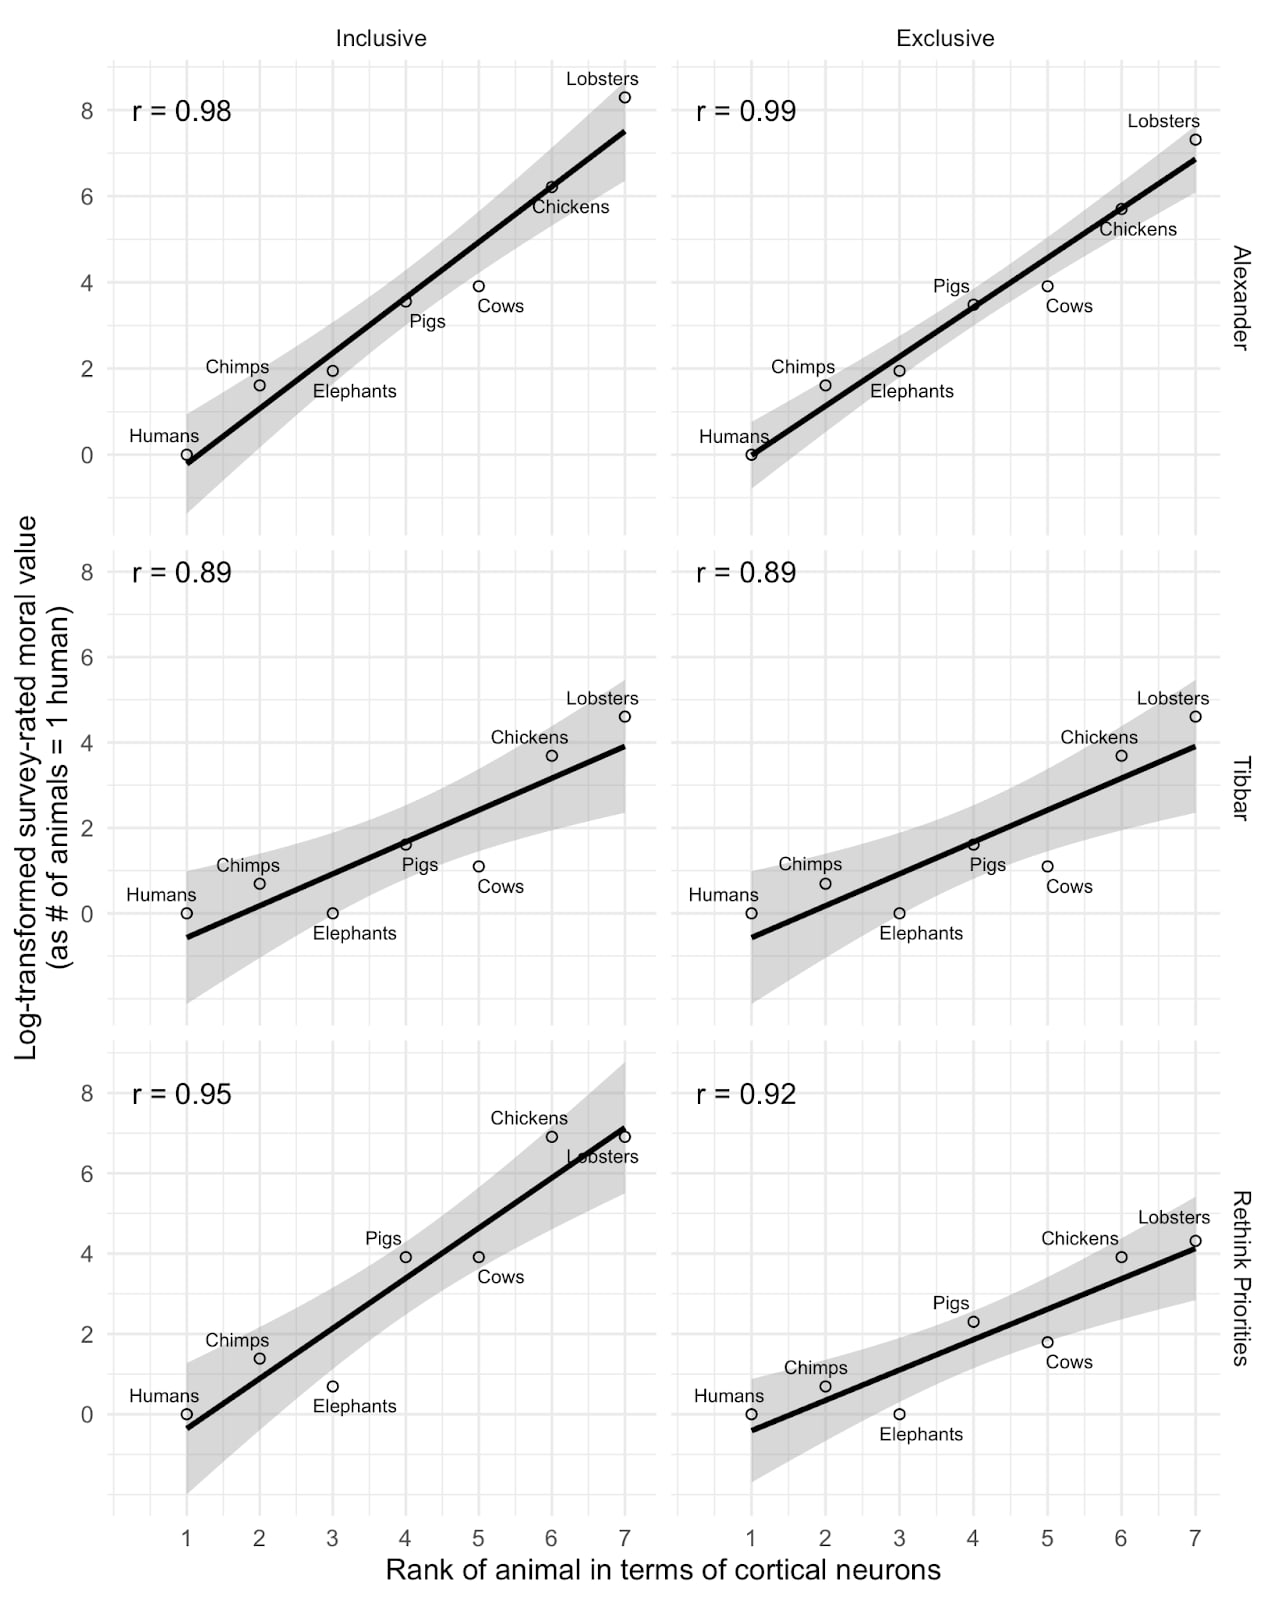
I think this is interesting, but I don't think we should infer too much from this relationship. This plot basically matches those we produced examining the relationship between cortical neuron count and perceived moral value of different animals (replicating SlateStarCodex and another's surveys). As you can see below, we found extremely strong correlations. But we also found similarly strong correlations using EQ or total brain size rather than cortical neuron count, or using a crude 0-100 measure of how people 'care' about the animal in place of tradeoff ratios. Notably, when we replace the moral value measure with a simple ordinal ranking of the animals by neuron count (as in the second plot below), we find even stronger relationships.
My impression is therefore that the strong correlations more reflect the fact that we have a small number of datapoints with animals differing dramatically on a wide variety of predictor (or, in principle, outcome) variables which are all highly correlated, rather than indicating that neuron counts are distinctively predictive of any outcomes of interest. See Andrew Gelman's similar discussion of our study.
I think to actually disentangle these we would need a larger sample of animals who diverge on the key dimensions (e.g., birds with high neuron density but small brains, or animals with higher neuron count but lower perceived similarity to humans).
Thanks Yarrow,
In this report, we don't actually classify any causes as longtermist or otherwise. We discuss this in footnote 3.
In this survey, as well as asking respondents about individual causes, we asked them how they would allocate resources across "Longtermist (including global catastrophic risks)", "Near-term (human-focused)" and "Near-term (animal focused)". We also asked a separate question in the 'ideas' section about their agreement with the statement "The impact of our actions on the very long-term future is the most important consideration when it comes to doing good."
This is in contrast to previous years, where we conducted Exploratory Factor Analysis / Exploratory Graph Analysis of the individual causes, and computed scores corresponding to the "longtermist" (Biosecurity, Nuclear risk, AI risk, X-risk other and Other longtermist) and "neartermist" (Mental health, Global poverty and Neartermist other) groupings we identified. As we discussed in those previous years (e.g. here and here), the terms "longtermist" and "neartermist", as just a matter of simplicity/convenience, matching the common EA understanding of those terms, but people might favour those causes for reasons other than longtermism / neartermism per se, e.g. decision-theoretic or epistemic differences.
Substantively, one might wonder: "Are people who support AI or other global catastrophic risk work, allocating more resources to the "Near-term" buckets, rather than to the "Longtermist (including global catastrophic risks)" bucket, because they think that AI will happen in the near-term and be sufficiently large that it would dominate even if you discount longterm effects?" This is a reasonable question. But as we show in the appendix, higher ratings of AI Safety are associated with significantly higher allocations (almost twice as large) to the "Longtermist" bucket, and lower allocations to the Near-term buckets. And, as we see in the Ideas and Cause Prioritizations section, endorsing the explicit "long-term future" item, is strongly positively associated with higher prioritization of AI Safety.
Perhaps they mentioned this elsewhere, but it could have added to their defence of this kind of question to note that 'third-person' questions like this are often asked to ameliorate social desirability and incentivise truth-telling, e.g. here or as in the bayesian truth serum. Of course, that's a separate question to whether this specific question was worded in the best way.
Agreed. Fwiw, in EA Survey 2024 data, people currently working at EA orgs are actually significantly more likely to be women or non-binary than those not (36.9% vs 29.1%, p=0.004).