Comments
Ethan Ligon and I submitted this to GiveWell for their "Change Our Minds" contest this year (2022). They will be announcing winners later this week (Dec 15, I think). But before they do, we wanted to share our submission here in case anyone is interested! Ethan has done some amazing work measuring real-world marginal utility by estimating demand systems using consumer purchases data. Seeing this prior work of his and thinking it may be particularly relevant to GiveWell's evaluations (and EA in general), I approached him and we wrote a short paper which we ended up submitting for the challenge.
Rather than post the entire paper here and risk losing info in the reformatting process, I ask that you see the Google Doc of it here. [1]While it does get a bit technical, I've tried to include non-technical summaries for most of the major sections. So in case you feel like some of the details are getting intense, I encourage you to at least read through the intro paragraphs and conclusions as you skim over it. If you get anything out of it, let it be that while total utility levels (over consumption) are unidentifiable, marginal utilities (over total consumption) are not--they can be measured with data!
In case you aren't convinced yet to read the full article, below is a quick excerpt from the Summary:
GiveWell bases much of their cost-effectiveness analysis on the value of doubling consumption. Since increasing consumption expenditures is the primary effect of the GiveDirectly cash transfers program, GiveWell uses the effectiveness (value generated per dollar) of cash transfers as a metric for evaluating the effectiveness of all other programs. However, by valuing “doubling consumption”, GiveWell has assumed the functional form of utility over “real consumption” x to be log(x) and the functional form of marginal utility over consumption to be 1/x (since this is the derivative of log(x)). This is a valid utility function in the sense that it is one of many functions that satisfies the conditions of rationality, but there is strong evidence that it is not a good representation of the preferences of the Kenyan beneficiaries of the GiveDirectly experiment.
The purpose of this article is to explain why GiveWell should reconsider using “doubling consumption” as the basis for assessing the value of consumption (or income) changes and instead value “halving marginal utility of expenditure”—what we think GiveWell actually intends to value. Using data from GiveDirectly’s cash transfers program in Kenya (Haushofer and Shapiro 2016), we provide empirical evidence that rejects the use of any function that implies homothetic preferences (including marginal utility of 1/x). We then empirically estimate the true marginal utility over consumption (λ) as revealed by Kenyan beneficiaries of GiveDirectly’s cash transfers program and show how the value per dollar of cash transfers is actually 2.6 times GiveWell’s current number (from 0.0034 to 0.009). This is because 1/x is quickly dwarfed by revealed marginal utility, λ, at low levels of consumption. Therefore, valuing “doubling consumption” underweights the value of cash transfers to the very poor if we let them “speak” for themselves.
Our "headline figure":
FIGURE 5: Utilitarian ROI. The curves labeled cfe use the estimated marginal utilities of expenditure λ(x, p), with p either the values at baseline, or endline. The curve labeled log uses the marginal utility of expenditures implied by a logarithmic utility function used (implicitly) by GiveWell.
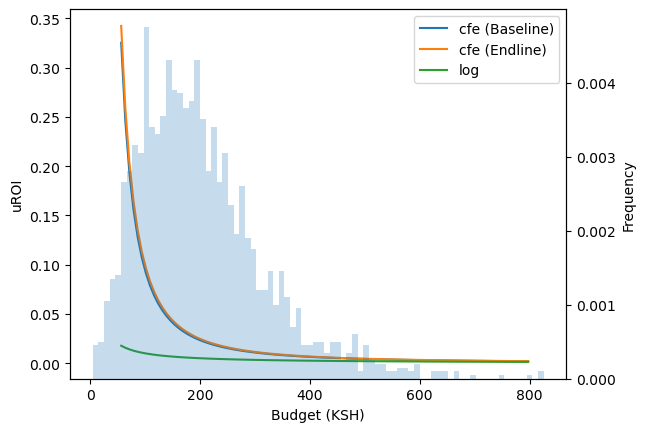
4.5. Utilitarian Return on Investment. For every dollar given to a particular household, there’s some increase in utility, which we can think of as a “utilitarian ROI”. This increase depends on household characteristics (e.g., size, composition), on the household’s budget (other things equal poorer households will benefit more), and on prevailing prices (e.g., if food prices are relatively high, the uROI will be relatively higher for poorer households).
For the households in the GiveDirectly experiment we trace out the uROI as a function of household budget x, using prices observed at the baseline, and “average” household characteristics. The GiveDirectly experiment distributed transfers randomly across the distribution of households pictured in Figure 5. The figure also plots marginal utilities of expenditures. The green line is the marginal utility of expenditures (x,p) corresponding to log utility. At higher budgets, this is very similar to the estimated MUEs, but the large divergence at lower budgets makes it clear where the greater estimated impact comes from: poorer households benefit much more from an additional dollar than do wealthier households. This is true for log utility as well, but to a far lesser extent.
How our results would affect GiveWell's moral weights:
5.1 Recommendation. For our particular empirical example involving the GiveDirectly experiment, the logic given above suggests that GiveWell should update the value of changes in households’ budgets. Specifically, wherever there’s presently a log(x) (where x is total budget for consumption expenditures within the period) this should be replaced with the more general −log λ(x, p). Note that the current use of log(x) is a special case of this, since with log utility, −log λ(x, p) = log(x).
In general, this calls for making predictions about future prices. In practice, we feel comfortable assuming the baseline prices for this experiment (note that Figure 5 above indicates that price changes between baseline and endline had very little effect). There are three particular cells in the GiveWell Cost Effectiveness Spreadsheet for GiveDirectly that are affected by the arguments advanced above:
Table 1: Utilitarian ROI. Key cells from the GiveWell Cost Effectiveness Spreadsheet for GiveDirectly. Cells B20, B21, and B26 are all directly affected by the arguments in this note. B31 is a summary output.
Table 1 shows the changes that our methods would produce—an increase in the overall value of consumption increases by a factor of 7.5/2.9 = 2.6. A similar factor applies to the other cells. The impact of our recommendation on cell B38 “Units of value generated per dollar spent” is particularly significant given its role in calibrating the efficacy of other programs.5.2 Implications. While we could have done this analysis for any program for which consumption or income changes are important outcomes, we chose to do it for the cash transfers program due to the centrality of its role in calibrating the entirety of GiveWell’s cost-effectiveness analysis. If GiveWell cares about knowing the true value of its top charities to their beneficiaries, this exercise (Ligon 2019) should be carried out for each program that involves consumption or income effects. From the “2022 GiveWell cost-effectiveness analysis” spreadsheet, this includes AMF, Deworm the World, END Fund, SCI Foundation, Sightsavers, and Malaria Consortium.
Evaluating these other programs in a similar way is beyond the scope of this article. However, it is not unlikely that doing so would yield increases in the value of their consumption/income components that are similar in magnitude to what we estimated in Kenya (2.6 times) if their beneficiaries are similarly impoverished. As such, there are two reasons this could quite plausibly cause GiveWell to reorder its top charities. The first is that those programs whose value relies more on income/consumption effects will now be relatively more effective (value per dollar). The second reason is that the distribution of expenditures across beneficiary populations might be different across programs. Thus, those programs that give transfers to poorer recipients will now be considered relatively even more effective.
Since GiveWell uses cash transfers as a metric by which to compare the effectiveness of other charities (especially to define “top” charities), it is also important to consider how our results would affect this relationship. Without evaluating other consumption-affecting programs as we have done for cash transfers, we cannot yet make definitive statements about how other programs that involve income/consumption effects now fare relative to cash transfers. However, it is at least safe to say that those programs which do not include consumption effects for the extremely poor would now be 2.6 times less effective relative to cash transfers in terms of value generated per dollar. For instance, such a program that was previously 10 times as effective as cash transfers would now only be 3.8 times as effective.
5.3 Conclusion. It is clear that GiveWell already cares about avoiding paternalistic evaluations of effectiveness. They have taken steps in the recent past to support research for the purpose of updating their efficiency calculations. We applaud this effort and recommend that GiveWell continue this pursuit by augmenting their moral weights to reflect revealed marginal utility rather than the ad hoc functional form of log(x). Doing so would not only provide an empirical foundation for GiveWell’s valuation of consumption and income effects but would also incorporate the true preferences of the extremely poor. As a result, the GiveDirectly cash transfers program should be valued 2.6 times as much per dollar as GiveWell’s current number (from 0.0034 to 0.009). Theoretically motivated and empirically estimated, is what GiveWell should use if their objective is to maximize the true value of their programs to beneficiaries.

Thank you for reading, now see the full article!
- ^
I may end up also posting the full version if there is enough demand for it. I initially started to do that but was afraid of not catching formatting mistakes.
83

