Previously titled “Climate change interventions are generally more effective than global development interventions”. Because of an error the conclusions have significantly changed. [old version]. I have extended the analysis and now provide a more detailed spreadsheet model below. In the comments below, Benjamin_Todd uses a different guesstimate model and found the climate change came out ~80x better than global health (even though the point estimate found that global health is better).
Word count: ~1800
Reading time: ~9 mins
Keywords: Climate change, climate policy, global development, global health, cause prioritization, prioritization research, comparing diverse benefits
Epistemic status: Uncertain and speculative. I don’t excessively hedge my claims throughout for clarity’s sake (#‘better wrong than vague’, #“say wrong things”, #"correct me if I'm wrong", #"All models are wrong, but some are useful").
Acknowledgments: Thanks to John Halstead, Danny Bressler, Sahil Shah, and members on the Effective Altruism forum, especially AGB, for helpful comments. Any errors are mine.
Comparative cost-effectiveness of climate change and global development
Summary
Does climate change deserve more attention within the effective altruism community?[1]
What is more effective: climate change interventions to avert emissions per tonne or single recipient global development interventions such as cash transfers?
Are targeted interventions to more fundamentally transform the lives of the poorest more effective than supplying broad global public goods such as a stable climate with comparatively small benefits to everyone on the planet?
To answer these questions, the following question is crucial:
“What value should we use for the social cost of carbon to adequately reflect the greater marginal utility of consumption for low-income people?”[2]
Here, I tried to answer this question. Surprisingly, I find that global development interventions are generally more effective than climate change interventions.
My spreadsheet model below shows that climate change interventions are only more effective than global development interventions, if and only if:
- Money is worth only 100 times as much to the global poor than people in high-income countries (i.e. if utility to consumption is logarithmic) and not more
- AND climate change interventions are very effective (less than $1 per tonne of carbon averted) AND/OR
- under quite pessimistic assumptions about climate change (if the social cost of carbon is higher than $1000 per tonne of carbon).
Key claims
I base the above conclusion on the following three empirical claims:
1. New research on the income-adjusted country-level social cost of carbon allows us to compare global development interventions to climate change interventions.
The new research is the first to use climate model projections, empirical climate-driven economic damage estimations, and also socio-economic projections which take into account greater marginal utility of consumption for every country individually.[3]
In other words, this takes into account “your dollar does (>)100x or more good if you give to the poorest rather than people in high-income countries”). More on income weighting in Appendix 2.
Other more canonical Integrated Assessment Models (IAM) such as DICE have only have one value for the whole world, and, while the RICE IAM has 12 regions,[4] this still understates the heterogeneous geography of climate damage.
The new research first estimated the social cost of carbon for every country in the world. Then, the authors summed up all the country-level costs of carbon to arrive at the global cost of carbon: US$417 per tonne of CO2 (66% CI: US$177–805, data explorer).
Dividing this value by how much more worth a dollar is for the poorest vs. people in high-income countries, e.g. 100x, allows us to directly compare climate change to cash-transfers to the poorest and other global development interventions. For instance, dividin by 100 results in ~$4.17 per tonne of CO2 (66% CI: $1.77–8.05)).[5]
While this global estimate also includes costs to more privileged people…
- ...in advanced economies (e.g. US, EU),
- …in the future who are richer due to economic growth,
- …in countries that are not as affected by climate change due to geography (e.g. some rich cold countries might actually benefit a little)
… these do not weigh as heavily in these calculations because the modelling adjusts for decreasing marginal utility of income.
The key point here is that the new model accounts more thoroughly for geographical heterogeneity and diminishing returns to consumption. We now need no longer worry as much that the social cost of carbon estimates obscure that climate change will be much worse for the poorest people in geographies more affected by climate change (who we could send unconditional cash transfers to).
The new paper’s social cost of carbon figure is controversial and has been criticized for being too high for various methodological reasons.[6] For instance, one very critical new paper also now estimates the social cost of carbon on a country-level, suggesting that the global social cost of carbon is only $24 (and, using various sensitivity analyses, values ranging from $3.38/tCO2e to $21,889/tCO2e).[7]
To account for the new paper overestimating or underestimating the social cost of carbon, below, we use sensitivity analysis to show how our model responds to over- or underestimating the true social cost of carbon by 10x.
2. Only some climate change interventions avert a tonne of CO2 for less than the global income-adjusted cost of carbon.
Only if a climate change intervention has a cost-effectiveness of social cost of carbon / income adjustment / X per tonne of CO2 averted, then it is X times as effective as cash-transfers.
So generally, climate change interventions create x more utility than cash-transfers, where
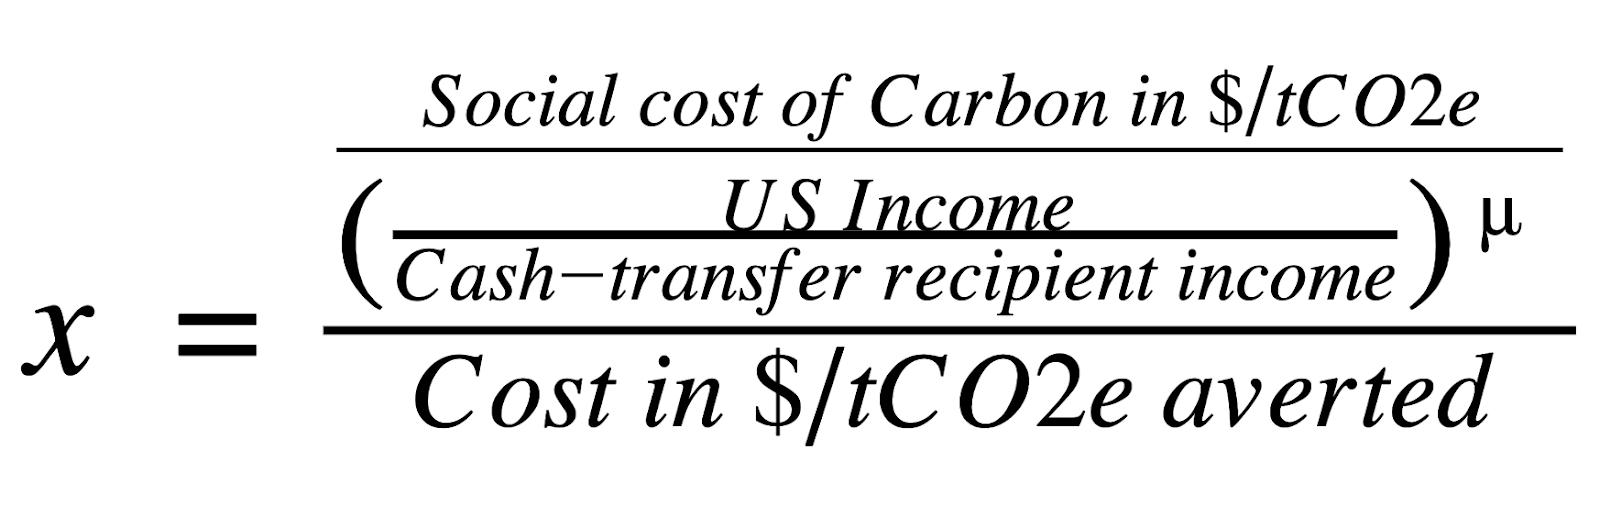
For instance, a climate change intervention with an effectiveness of $1 per tonne of CO2 averted would be ~4.17x more effective than cash-transfers if the social cost of carbon / 100 is $4.17. This is just the basic model. We complicate this analysis in the spreadsheet below with more parameters. For instance, some global development interventions are 17.5 more effective than cash-transfers.
3. Scalable climate change interventions are not generally as cost-effective compared to global development interventions.
Cash-transfers can absorb more funding with consistently high cost-effectiveness than any other intervention.
So even if many other high-risk, high-reward projects have a higher benefit-cost ratio than cash-transfers in expectation, they usually have smaller funding gaps and one needs to do more research to find them.
But climate change can also absorb large amounts of funding at scale with consistently high cost-effectiveness and only slowly diminishing returns.
Examples of interventions with cost-effective scalable interventions are:
- Ocean alkalinity might be a way to absorb large amounts of carbon up to 100 billion tonnes / year) for as little as $10 per tonne of CO₂ averted.[8],[9]
- Tropical reforestation between 2020–2050 could be increased by 5.7 billion tonnes (5.6%) at a carbon price of $20 per tonne of CO2 averted or by 15.1 billion tonnes (14.8%) at $50 per tonne of CO2 averted.[10]
- Avoided deforestation can prevent 55.1 billion tonnes at $20 per tonne of CO2 averted or 108.3 billion tonnes at $50 per tonne of CO2 averted.[11]
- The levelized costs of capturing CO2 from the atmosphere are projected to be $94-232 per tonne CO2[12] and could decrease to $35 by 2050.[13]
Multiplying the number of tonnes avertable by the (average) cost per tonne averted equals the funding gap. For some of these interventions this is in the trillions.[14] To get a rough estimate of the overall funding gap of climate change, we can multiply global emissions—roughly 37 billion tonnes per year—and assume an average cost-effectiveness of $50 per tonne. This suggests a funding gap of $1.85 trillion/year.
Yet, none of these scalable interventions can avert a tonne of carbon at scale for less than $4.17.
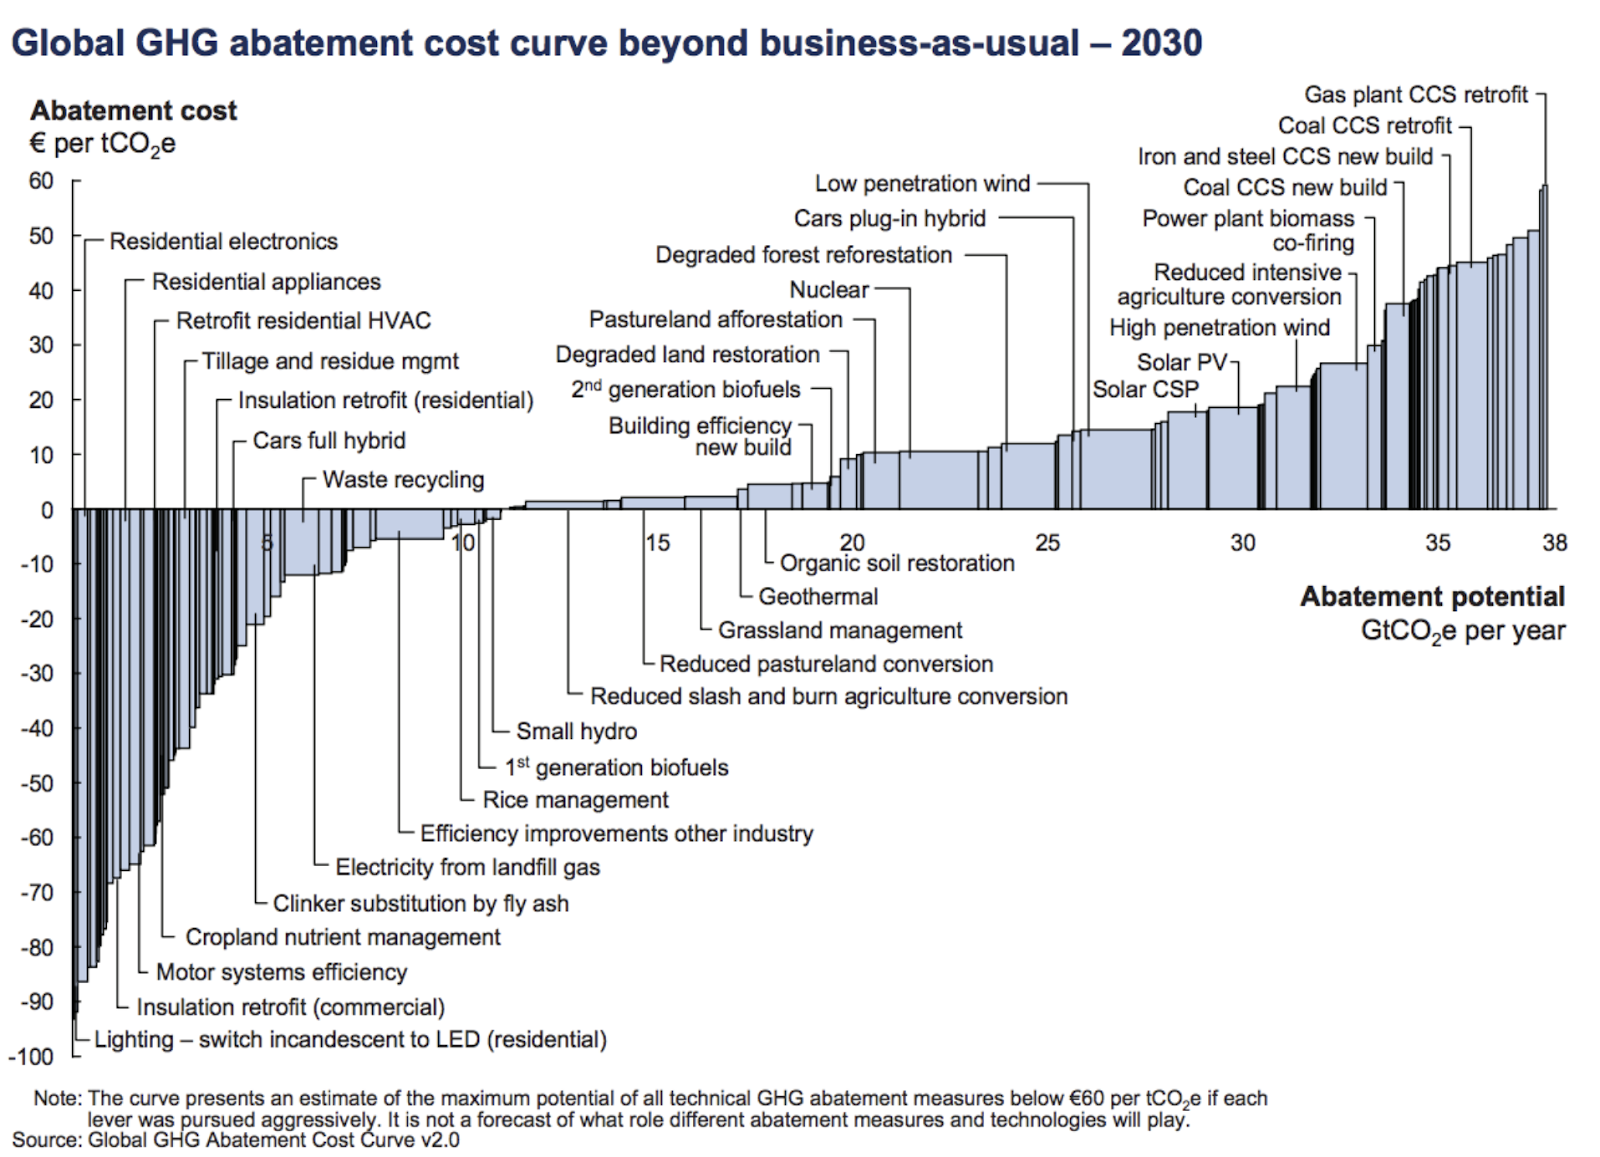
The figure below shows the cost-effectiveness of some more interventions and their overall abatement potential (though we should be skeptical of “free lunch” interventions with negative costs).[15]
Implications for cause prioritization
If none of these three claims above can be falsified, then it follows that, as a rule, we should consider prioritizing global development over climate change interventions. In other words, averting carbon should not replace unconditional cash-transfers to the poorest as the new ‘benchmark’ or replace global development as the new ‘mainstream EA flagship cause’.
However, under some pessimistic modelling assumptions, some select climate change interventions might be more effective than global development interventions and should be prioritized. Read on for our updated model on this.
When are climate change interventions more effective than global development interventions?
Consider the following spreadsheet (Google sheet). A more detailed description of the parameters, assumptions and scenarios are in Appendix 1.
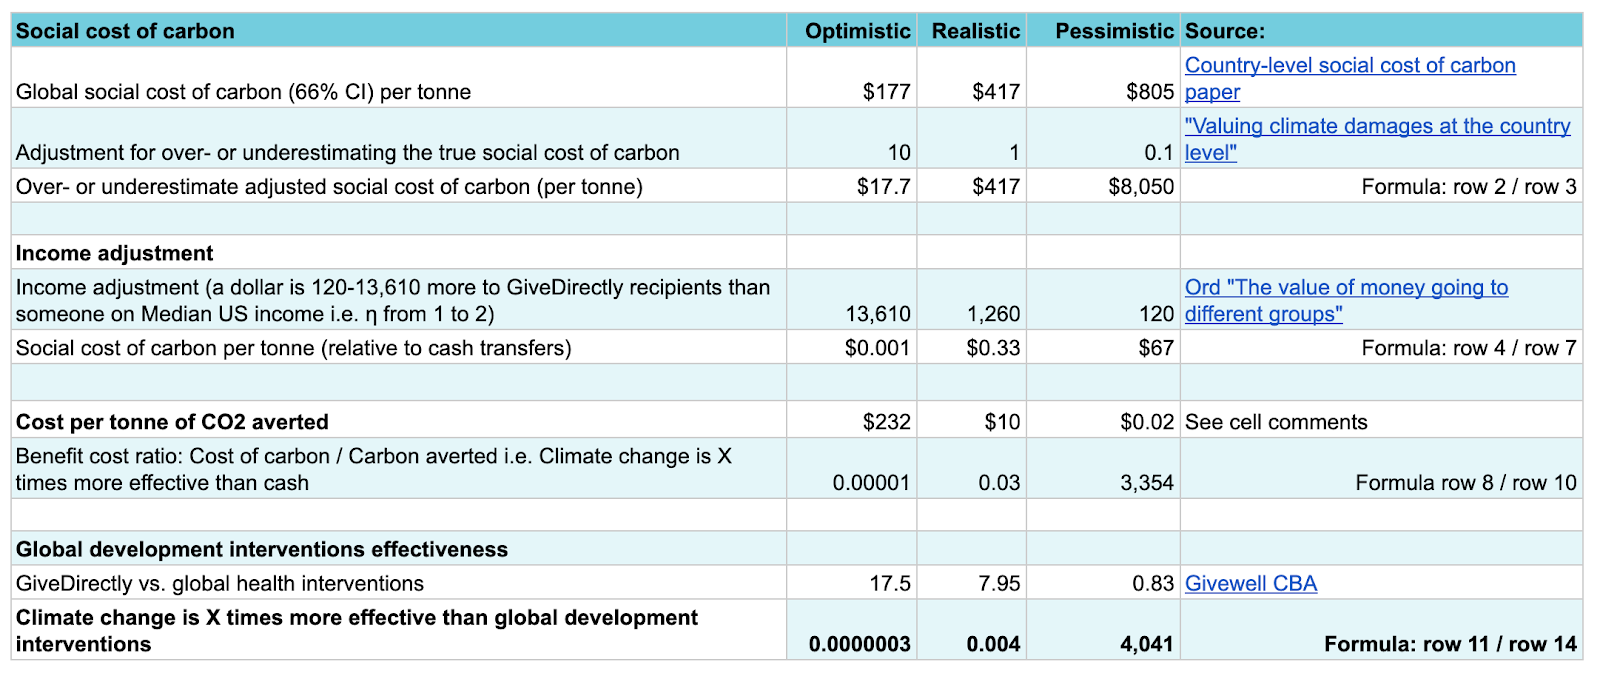
Optimistic scenario
Assumptions:
- Social cost of carbon is only $17.7
- an η of 2 (i.e. cash-transfers to the poorest are worth 13,610x as much as to people in rich countries)
- a high cost of $232 per tonne of carbon averted at scale,
- and global development interventions being 17.5x as effective as cash.
This results in climate change interventions being only 0.00003% as effective as cash-transfers.
Realistic scenario
Assumptions:
- Social cost of carbon is $417
- η of 1.5 (i.e. cash-transfers to the poorest are worth 1,260x as much as to people in rich countries)
- $10 per tonne of carbon averted at scale (e.g. deforestation prevention)
- and global development interventions being 7.95x as effective as cash (median Givewell charity effectiveness)
This results in climate change interventions being only 0.42% as effective as cash-transfers.
Pessimistic scenario
Assumptions:
- Social cost of carbon is high $8,050
- η of 1 (i.e. cash-transfers to the poorest are worth 120x as much as to people in rich countries)
- $0.02 per tonne of carbon averted at scale (e.g. lobbying for deforestation prevention)
- and global development interventions are cash-transfers, which are give 83 cents of every dollar to the poorest
This results in climate change interventions being 4,041x more effective than cash-transfers.
Conclusion
Global development interventions seem generally more effective than climate change interventions. However, under pessimistic modelling assumptions, select climate change interventions might be more effective than global development interventions.
Only if utility to consumption is logarithmic (i.e. only if a dollar going to the poorest is not more than 100x as much as going to people in rich countries) AND a given climate change intervention is very effective (less than $1 per tonne of carbon averted) OR under quite pessimistic assumptions about climate change (if the social cost of carbon is higher than $1000 per tonne of carbon), then climate change interventions are more effective than global development interventions.
So for those wanting to maximize expected utility, one should support climate change interventions only if they are very cost-effective (i.e. lower than $1/tCo2e averted).
The results of the model are also very sensitive to the income adjustment parameter η – if it’s just 1, i.e. returns to consumption are logarithmic, and money to the poorest is only 100x as good at going to the poorest, and the social cost of carbon is just in the hundreds of dollars, then some effective, but not super scalable interventions such as deforestation prevention on the order of $1 per tonne of carbon averted can beat some global development interventions.
Because the confidence intervals between climate and development are wide and overlapping, the value of information of reducing uncertainty is high. For instance, the value of better information on the transient climate response has been estimated to be $10 trillion.[16] In other words, if new research would show that the social cost of carbon is actually much higher, then this might lead to more optimal allocation of resources.
Appendix 1: Additional info on model parameters
Social cost of carbon
General note on social cost of carbon: Generally, climate modelling is much more uncertain than global development interventions (which can be studied with RCTs) and the effects of climate change are in the future (see Appendix 3). Altruists with high risk / uncertainty aversion and/or high discount rates might want to not support climate change interventions for that reason.
Yet, the estimate from above social cost of carbon modelling uses sensitivity analyses to account for uncertainty and uses discounting and so the estimates are at least somewhat robust to different specifications.
Also, some commenters note that the quantification of climate modelling is essentially useless (also see Appendix 3). However, one study estimated a lower bound of the global social cost of carbon at US$125 and argues that:
“Quantifying the true SCC value is complicated because of various difficult-to-quantify damage cost categories and the interaction of discounting, uncertainty, large damages and risk aversion [...] The best that can be offered is a lower bound based comes from a conservative meta-estimate that aggregates studies using high and low discount rates, it does not account for various climate change damages owing to a lack of reliable information, and it does not consider a minimax regret argument addressing damages associated with extreme climate change.”
Also, as an aside, outside of prioritization, for optimal policy the social cost of carbon should be:
- Set to the marginal abatement cost, which can be optimal and easier to estimate.[17] or
- Set to err on the side of overestimating externalities[18] (while reducing other non-Pigovian taxes).
Optimistic assumption: The new study's estimate is 10x higher than more canonical estimates such as the EPA’s $42 per tonne, which is based on IAMs. This because it contentiously assumes impacts on GDP growth permanently alter a country’s GDP [19] using different damage functions, not because they are accounting for greater marginal utility of consumption to individuals with lower consumption levels.[20]
For that reason, in our optimistic scenario, we downward adjust by 10x on the paper’s lower 66% CI, so that the social cost of carbon is $17.8. Note that this is conservative in the sense of being much lower even than the estimated lower bound of the social cost of carbon.
Realistic assumption: In the realistic assumption, we use the study’s central estimate ($417), and assume that the model is correct.
Pessimistic assumption: This assumes that the study’s estimate is actually 10x too low and adjusts for this.
This is plausible because of contributors to social cost of carbon not fully captured by empirical, macroeconomic damage functions, and their likely impacts on the social cost of carbon (see Table S5 in the paper’s supplementary material and Table 1 in[21]). For instance:
- Adjustment costs (short-term costs of adaptation)
- Non-market damages (biodiversity loss, cultural losses, etc.)
- Tipping points in the climate system (catastrophic climate events, hysteresis etc.)
- High inertia effects of CO2 (ocean acidification, sea level rise)
- General equilibrium effects (spillover, trade, etc.)
- Macro-scale adaptation (long-term restructuring of economy)
- Political instability and violent conflicts
- Large migration flows
- More extreme weather and natural disasters
- Bresler finds that explicitly accounting for climate mortality costs triples the welfare costs of climate change.[22]
- The highest social cost of carbon estimate in the literature is on the same order of magnitude ($1687[23]), and the highest figure amongst many in a recently published paper find that for 6 degrees of warming the cost will be (which has a substantial probability) is $21889 / per tonne) [24]
Income adjustment
The income adjustment takes into account that “your dollar does (>)100x or more good if you give to the poorest rather than people in high-income countries”). More on income weighting in Appendix 2. The optimistic case has an η value of 2, the realistic of 1.5, and the pessimistic of 1 (Source). This corresponds to 1 dollar being worth 120-13,610 more when it goes to the poorest people on the planet (e.g. via unconditional cash-transfers) than someone on Median US income (120 might be an underestimate according some of my calculations and it might be 250). For higher values going towards 2, this can dominate the analysis.[25]
Cost per tonne of CO2 averted
Optimistic case: The levelized costs of capturing CO2 from the atmosphere are projected to be $94-232 per tonne CO2[26] and could decrease to $35 by 2050.[27] We use the upper bound ($232) for the optimistic case.
Realistic case: For the middle case, we use ocean alkalinity which might be a way to absorb large amounts of carbon up to 100 billion tonnes / year) for as little as $10 per tonne of CO₂ averted.[28],[29] This is also roughly in line with the cost per tonne of CO2 averted through new clean energy generation over coal and other interventions, wind production tax credit in the United States, which have estimated carbon abatement costs ranging from $2-260 (Carbon capture and storage is on a similar order of magnitude, also see figure below for other interventions).[30]
Optimistic case: Preventing deforestation can have a cost-effectiveness of $0.57 per averted ton of CO2 at scale.[31] Donations to “Coalition for Rainforest Nations” for advocacy on deforestation prevention has been estimated to avert a tonne of CO2e for $0.12, with a plausible range of $0.02 - $0.72.[32] We use the lower bound, $0.02, as the optimistic case. Note that this is perhaps comparing apples to oranges, by comparing advocacy to direct interventions and that a fairer comparison would high-risk, high-reward global development science or policy interventions which have been suggested to be perhaps 100x more effective than cash.[33]
Global development interventions effectiveness
Optimistic case: Some global development interventions have been estimated to be 17.5x more effective than cash-transfers (e.g. deworming).[34] We use this as the optimistic case.
Realistic case: The median Givewell charity effectiveness vs. cash is 7.95.[35]
Pessimistic case: The proportion of total expenses that GiveDirectly has delivered directly to recipients is approximately 83%.[36]
Appendix 2: Income-weighting
A recent paper estimates the country-level social cost of carbon, using not only climate, but also socio-economic projections.[37] For the marginal utility substitution, they use a μ-value of 1.5 as a central value.
What concretely does this mean?
All else being equal, money going to poorer countries or people is better than money going to richer countries or people. Weyl suggests that assuming logarithmic utility giving 1 dollar to an extremely poor person is like giving 66 dollars to an American[38]. (“That is, if marginal utility is declining in levels of income, say utility is the natural log of consumption, then the marginal utility is 1/consumption. This implies a dollar’s worth of consumption in utility terms of a person at the global poverty line is worth 64 times as much as a dollar to person in the highest decile of consumption in the USA (63.6=(1/(1.9*365))/(1/44,152) so transferring income from a rich person in the USA to a globally poor person produces, in and of itself, massively higher total global utility (even if not Pareto improving).”[39]).
Weyl suggests that logarithmic utility is canonical in economics and supported by a wide range of data, “including recent happiness studies (Stevenson and Wolfers, 2008) and labour supply decisions (Chetty, 2006)”. This is also in line with work that finds a correlation between log income and happiness [40]:
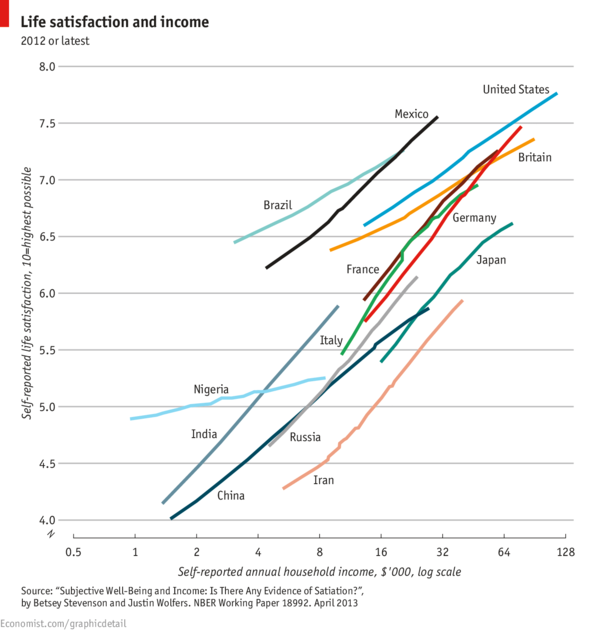
The law of logarithmic utility can be found in other areas such as research funding as well [41].
The general form of modelling utility consumption relationships using isoelastic utility function is: [42]:

Ord [43] explains this function as follows:
“This equation has one free parameter, known as η (‘eta’, which sounds ‘e’ for ‘elasticity’), which represents how steeply returns to consumption diminish. η must be between 0 and ∞, and can be estimated empirically.
The equation, for utility (u) at a given consumption level (c), and elasticity (η) is:
From this it follows that for η = 0 utility is linear in consumption, for η = ½ utility is the square root of consumption, and for η = 1 utility is logarithmic in consumption. Values of η above 1 correspond to utility having a finite upper bound, which is approached hyperbolically as consumption increases.
However, the main use of the equation is to just compare the slope of the curve at one consumption level to the slope at another consumption level. For example the ratio of the slope at $1,000 per annum to the slope at $10,000 per annum shows us the relative value of giving an extra dollar to someone with annual consumption $1,000 versus to someone with $10,000. When performing this calculation, the equation is very simple:
Giving a dollar to someone with k times as much consumption is worth only:
(1/k)^2
times as much.
There have been many attempts to measure η, and it is typically found to be between about 1 and 2. If η equals 1, then we have logarithmic utility of consumption and we have the very simple rule that a dollar is worth 1/k times as much if you are k times richer (and that doubling someone’s income is worth the same amount no matter where they start). If η equals 2, then we have to raise this to the power of 2, so being 10 times richer would mean a dollar is worth just 1/100th as much (and doubling your income is worth much less the higher your starting income). The truth is probably in between these limits.”
Appendix 3: Uncertainty around climate change modelling
Integrated assessment models have been heavily criticised. Consider the following quote by MIT Economics Professor Robert S. Pindyck from his paper “The Use and Misuse of Models for Climate Policy”:[44]
"In a recent article, I argued that integrated assessment models (IAMs) “have crucial flaws that make them close to useless as tools for policy analysis.” In fact, I would argue that calling these models “close to useless” is generous: IAM-based analyses of climate policy create a perception of knowledge and precision that is illusory, and can fool policy-makers into thinking that the forecasts the models generate have some kind of scientific legitimacy. IAMs can be misleading – and are inappropriate – as guides for policy, and yet they have been used by the government to estimate the social cost of carbon (SCC) and evaluate tax and abatement policies. What are the crucial flaws that make IAMs so unsuitable for policy analysis? They are discussed in detail in Pindyck (2013b), but the most important ones can be briefly summarized as follows: 1. Certain inputs – functional forms and parameter values – are arbitrary, but have huge effects on the results the models produce. An example is the discount rate. There is no consensus among economists as to the “correct” discount rate, but different rates will yield wildly different estimates of the SCC and the optimal amount of abatement that any IAM generates. For example, these differences in inputs largely explain why the IAMbased analyses of Nordhaus (2008) and Stern (2007) come to such strikingly different conclusions regarding optimal abatement. Because the modeler has so much freedom in choosing functional forms, parameter values, and other inputs, the model can be used to obtain almost any result one desires, and thereby legitimize what is essentially a subjective opinion about climate policy. 2. We know very little about climate sensitivity, i.e., the temperature increase that would eventually result from a doubling of the atmospheric CO2 concentration, but this is a key input to any IAM. The problem is that the physical mechanisms that determine climate sensitivity involve crucial feedback loops, and the parameter values that determine the strength (and even the sign) of those feedback loops are largely unknown, and are likely to remain unknown for the foreseeable future. 3. One of the most important parts of an IAM is the damage function, i.e., the relationship between an increase in temperature and GDP (or the growth rate of GDP). When assessing climate sensitivity, we can at least draw on the underlying physical science and argue coherently about the relevant probability distributions. But when it comes to the damage function, we know virtually nothing – there is no theory and no data that we can draw from. 4. IAMs can tell us nothing about the likelihood or possible impact of a catastrophic climate outcome, e.g., a temperature increase above 5°C that has a very large impact on GDP. And yet it is the possibility of a climate catastrophe that is (or should be) the main driving force behind a stringent abatement policy."
Yet, in a later paper Pindyck estimates the social costs of carbon through expert surveys to be in the hundreds of dollars range. This is in line with IAMs and leads me to believe that
“The Social Cost of Carbon Revisited:[45]
“An estimate of the social cost of carbon (SCC) is crucial to climate policy. But how should we estimate the SCC? A common approach uses an integrated assessment model (IAM) to simulate time paths for the atmospheric CO2 concentration, its impact on temperature, and resulting reductions in GDP. I have argued that IAMs have deficiencies that make them poorly suited for this job, but what is the alternative? I present an approach to estimating an average SCC, which I argue can be a useful guide for policy. I rely on a survey of experts to elicit opinions regarding (1) probabilities of alternative economic outcomes of climate change, but not the causes of those outcomes; and (2) the reduction in emissions required to avert an extreme outcome, i.e., a large climate-induced reduction in GDP. The average SCC is the ratio of the present value of lost GDP from an extreme outcome to the total emission reduction needed to avert that outcome. I discuss the survey instrument, explain how experts were identified, and present results. I obtain SCC estimates of $200/mt or higher, but the variation across experts is large. Trimming outliers and focusing on experts who expressed a high degree of confidence in their answers yields lower SCCs, $80 to $100/mt, but still well above the IAM-based estimates used by the U.S. government.”[46]
References
[1] "Does climate change deserve more attention within EA? - Effective ...." 16 Apr. 2019, https://forum.effectivealtruism.org/posts/BwDAN9pGbmCYZGbgf/does-climate-change-deserve-more-attention-within-ea. Accessed 1 Oct. 2019.
[2] "Research Fellow - Open Philanthropy Project - Google Hire." http://web.archive.org/web/20190828072238/https://hire.withgoogle.com/public/jobs/openphilanthropyorg/view/P_AAAAAAFAACuGJXzLj5l5Sp?trackingTag=googleSearch.
[3] ”Country-level social cost of carbon” - Nature Climate Change
[4] "Revisiting the social cost of carbon | PNAS." https://www.pnas.org/content/114/7/1518. Accessed 10 Sep. 2019.
[5] "The value of money going to different groups - Centre for ...." 2 May. 2017, https://www.centreforeffectivealtruism.org/blog/the-value-of-money-going-to-different-groups/. Accessed 13 Sep. 2019.
[6] "Valuing climate damages at the country level | Nature Climate ...." 24 Sep. 2018, https://www.nature.com/articles/s41558-018-0285-8. Accessed 13 Sep. 2019.
[7] "A social cost of carbon for (almost) every country - ScienceDirect." https://www.sciencedirect.com/science/article/pii/S014098831930218X. Accessed 26 Sep. 2019.
[8] "The Emissions Gap Report 2017 - UNEP Document Repository Home." https://wedocs.unep.org/bitstream/handle/20.500.11822/22070/EGR_2017.pdf. Accessed 9 Apr. 2018.
[9] "Negative emissions„Part 2: Costs, potentials and side ... - IOPscience." 22 May. 2018, https://iopscience.iop.org/article/10.1088/1748-9326/aabf9f/pdf. Accessed 29 Jul. 2019.
[10] "Potential for low-cost carbon dioxide removal through tropical ... - Nature." 27 May. 2019, https://www.nature.com/articles/s41558-019-0485-x. Accessed 29 Jul. 2019.
[11] "Potential for low-cost carbon dioxide removal through tropical ... - Nature." 27 May. 2019, https://www.nature.com/articles/s41558-019-0485-x. Accessed 29 Jul. 2019.
[12] "A Process for Capturing CO2 from the Atmosphere - ScienceDirect." 15 Aug. 2018, https://www.sciencedirect.com/science/article/pii/S2542435118302253. Accessed 31 Jul. 2019.
[13] "Techno-economic assessment of CO2 direct air ... - ScienceDirect.com." 1 Jul. 2019, https://www.sciencedirect.com/science/article/pii/S0959652619307772. Accessed 1 Aug. 2019.
[14] "Potential for low-cost carbon dioxide removal through tropical ... - Nature." 27 May. 2019, https://www.nature.com/articles/s41558-019-0485-x. Accessed 29 Jul. 2019.
[15] "The Cost of Reducing Greenhouse Gas Emissions - Harvard ...." 2 Aug. 2018, https://scholar.harvard.edu/files/stock/files/gillingham_stock_cost_080218_posted.pdf. Accessed 24 Sep. 2019.
[16] "Value of better information about TCR | Philosophical Transactions of ...." 5 Oct. 2015, http://rsta.royalsocietypublishing.org/content/373/2054/20140429. Accessed 9 Apr. 2018.
[17] Yew-Kwang Ng - “Optimal Environmental Charges/Taxes: Easy to Estimate and Surplus-yielding”
[18] Blogpost on policy by Paul Christiano
[19] "Valuing climate damages at the country level | Nature Climate ...." 24 Sep. 2018, https://www.nature.com/articles/s41558-018-0285-8. Accessed 13 Sep. 2019.
[20] https://forum.effectivealtruism.org/posts/GEM7iJnLeMkTMRAaf/climate-change-interventions-are-generally-more-effective?commentId=oE4jiWzi63HZxZvvw
[21] "A lower bound to the social cost of CO2 emissions | Nature ...." 26 Mar. 2014, https://www.nature.com/articles/nclimate2135. Accessed 13 Sep. 2019.
[22] "2nd Oxford Workshop on Global Priorities Research - 1-2 July ...." https://globalprioritiesinstitute.org/2nd-oxford-workshop-on-global-priorities-research/. Accessed 13 Sep. 2019.
[23] "The Economic Effects of Climate Change - American ...." https://pubs.aeaweb.org/doi/pdf/10.1257/jep.23.2.29. Accessed 13 Sep. 2019.
[24] "A social cost of carbon for (almost) every country - ScienceDirect." https://www.sciencedirect.com/science/article/pii/S014098831930218X. Accessed 25 Sep. 2019.
[25] "The value of money going to different groups - Centre for ...." 2 May. 2017, https://www.centreforeffectivealtruism.org/blog/the-value-of-money-going-to-different-groups/. Accessed 25 Sep. 2019.
[26] "A Process for Capturing CO2 from the Atmosphere - ScienceDirect." 15 Aug. 2018, https://www.sciencedirect.com/science/article/pii/S2542435118302253. Accessed 31 Jul. 2019.
[27] "Techno-economic assessment of CO2 direct air ... - ScienceDirect.com." 1 Jul. 2019, https://www.sciencedirect.com/science/article/pii/S0959652619307772. Accessed 1 Aug. 2019.
[28] "The Emissions Gap Report 2017 - UNEP Document Repository Home." https://wedocs.unep.org/bitstream/handle/20.500.11822/22070/EGR_2017.pdf. Accessed 9 Apr. 2018.
[29] "Negative emissions„Part 2: Costs, potentials and side ... - IOPscience." 22 May. 2018, https://iopscience.iop.org/article/10.1088/1748-9326/aabf9f/pdf. Accessed 29 Jul. 2019.
[30] "The Cost of Reducing Greenhouse Gas Emissions - Harvard ...." 2 Aug. 2018, https://scholar.harvard.edu/files/stock/files/gillingham_stock_cost_080218_posted.pdf. Accessed 13 Sep. 2019.
[31] "Cash for Carbon: A Randomized Controlled Trial of ... - NBER." http://www.nber.org/papers/w22378.pdf. Accessed 23 Sep. 2019.
[32] https://docs.google.com/spreadsheets/d/12lwvxlWLjwuSuXiciFvnBF2bkfcCkrusdqqT37_QWac/edit#gid=1267972809&range=E35
[33] "GiveWell's Top Charities Are (Increasingly) Hard to Beat ...." 9 Jul. 2019, https://www.openphilanthropy.org/blog/givewells-top-charities-are-increasingly-hard-beat. Accessed 2 Oct. 2019.
[36] "GiveDirectly | GiveWell." https://www.givewell.org/charities/give-directly. Accessed 23 Sep. 2019.
[37] ”Country-level social cost of carbon” - Nature Climate Change
[38] "The Openness‐equality Trade‐off in Global ... - Wiley Online Library." https://onlinelibrary.wiley.com/doi/abs/10.1111/ecoj.12469. Accessed 30 Jul. 2018.
[39] "Alleviating Global Poverty: Labor Mobility, Direct Assistance, and ...." 20 Mar. 2018, https://www.cgdev.org/publication/alleviating-global-poverty-labor-mobility-direct-assistance-and-economic-growth. Accessed 1 Nov. 2018.
[40] "Subjective Well-Being, Income, Economic Development and Growth." http://www.nber.org/papers/w16441. Accessed 30 Jul. 2018.
[41] "The law of logarithmic returns - Future of Humanity Institute." 20 Oct. 2014, https://www.fhi.ox.ac.uk/law-of-logarithmic-returns/. Accessed 30 Jul. 2018.
[42] "Isoelastic utility - Wikipedia." https://en.wikipedia.org/wiki/Isoelastic_utility. Accessed 30 Jul. 2018.
[43] "The value of money going to different groups - Centre for Effective ...." 2 May. 2017, https://www.centreforeffectivealtruism.org/blog/the-value-of-money-going-to-different-groups/. Accessed 30 Jul. 2018.
[44] "The Use and Misuse of Models for Climate Policy." http://www.nber.org/papers/w21097. Accessed 24 Jul. 2019.
[45] "The Social Cost of Carbon Revisited." http://www.nber.org/papers/w22807. Accessed 24 Jul. 2019.
[46] "The Social Cost of Carbon Revisited." http://www.nber.org/papers/w22807. Accessed 24 Jul. 2019.
Wait a second.
I'm very confused by this sentence. Suppose, for the sake of argument, that all the impacts of emitting a tonne of CO2 are on people about as rich as present-day Americans, i.e. emitting a tonne of CO2 now causes people of that level of wealth to lose $417 at some point in the future. There is then no income adjustment necessary (I assume everything is being converted to something like present-day USD for present-day Americans, but I'm not actually sure and following the links didn't shed any light), so the post-income-adjustment number is still $417. Also suppose for the sake of argument that we can prevent this for $100.
This seems clearly worse than cash transfers to me under usual assumptions about log income being a reasonable approximation to wellbeing (as described in your first appendix), since we are effectively getting a 4.17x multiplier rather than a 50-100x multiplier. Yet the equation in the quote claims it is 4.17x more effective than cash transfers*.
What am I missing?
*Mathematically, I think the equation works iff. the cash transfers in question are to people of comparable wealth to whatever baseline is being used to come up with the $417 figure. So if the baseline is modern-day Americans, that equation calculates how much better it is to avert CO2 emissions than to transfer cash to modern-day Americans.
I was about to say this and then saw your comment. My impression from the paper is the $417 is a sum of costs to different countries, and for each of them the cost is a present value to the people in that country, with discounting being applied based on the expected amount of economic growth in that country. So I don't think it's calibrated to present-day Americans, but I don't think it's calibrated to the world's poorest either, and I agree the argument doesn't go through.
There's another problem with the quoted claim, which becomes clear if you pick a value like X = 1/1000. Paying $417,000 to avert a tonne of carbon is a huge net bad and not just a much smaller net good.
It seems to me another problem is that if the social cost of carbon comes from effects on growth, you have to compare that to the effects on growth of cash transfers. It's generally easy for small changes in growth rate to outweigh small changes to level in the long run, so if you compare the growth effects of one intervention to the level effects of another intervention, it's no surprise that the former would seem more effective.
Am I right that what we need to know is whether, when assessing the total global social cost of carbon:
i) they multiplied harms to the world's poorest people, measured in equivalent dollars of their income, by ~100x;
ii) they divided the harms to the world richest people, measured in equivalent dollars of their income, by ~100x;
iii) or something in between?
HH's argument only goes through if it's the second of the three.
I agree with this. I would have assumed they would do (i), and other responses from people who actually read the paper make me think it might effectively be (iii). I don't think it's (ii).
I mentioned it in my comment elsewhere, but—from a quick look at the paper and the supplementary material—I don't think it's much like any of these. They don't make any special mention that I could find of trying to translate purely economic measures into welfare. The only mention I could find about income adjustment is "rich/poor specifications" which appears to be about splitting the formula for growth of damages into one of two forms depending on whether the country is rich or poor.
Edit: They do mention "elasticity of marginal utility" in the discounting module section which is also known as "intergenerational inequality aversion".
My nonconfident best guess at an interpretation is that, according to these estimates, for every tonne of carbon:
Future Indians suffer damages utility-equivalent to the present population of India paying a total of $76
Future Americans suffer damages utility-equivalent to the present population of the USA paying a total of $48
Future Saudis suffer damages utility-equivalent to the present population of Saudi Arabia paying a total of $47
Next are China, Brazil, and the UAE, all with $24, and then a lot of other countries, and the sum of all these numbers is $417. So it's as if the $417 is paid by this particular mix of the world's people, making it iii), something in between. These numbers are totals that don't divide by population, so an individual inhabitant of Saudi Arabia or the UAE pays a greater absolute amount than an individual American, who pays a greater absolute amount (but a smaller percentage of income) than an individual Indian.
Thanks for catching this mistake.
I've updated the analysis to reflect this.
I emailed the authors but they didn't reply.
But I think the social cost of carbon figures should generally be interpreted as current US dollars. They are then discounted for decreasing returns to consumption for future people who live in countries with higher consumption.
So we should divide the $417 figure by the 100x multiplier (or more, see my sensitivity analysis).
I'm still a bit worried about this.
It would have been reasonable for them to use the mean global income as the baseline, rather than dollars to the mean US citizen.
If I understand correctly, that would boost things by about a factor of 3 in favour of climate change (mean global income is about $20k, vs. mean US income of about $60k). Though, I suppose that's a fairly small uncertainty compared to the others listed here.
The assumption is that a policymaker will use these results to shape how strict climate policy is. Stricter climate policies will reduce present-day consumption in the policymaker's jurisdiction. The goal is to have a climate policy that is just strict enough to balance the future utility gain from improved climate with current utility loss from reduced consumption.
(Anthoff and Emmerling, 2016, p. 5, emphasis added).
I think it's conventional in the literature to use the US as the reference region: "In order to make the numerical results comparable with previous studies we take the US as reference region x throughout this paper" (ibid).
My current understanding of how we should interpret a social cost of carbon of $y is:
“Given certain assumptions about future climate effects, emissions trajectories, how utility scales with consumption, and how much we discount future utility, a utilitarian policymaker in country x should be willing to reduce current consumption in his country by up to $y in order to abate 1 ton of carbon emissions”
This also means that, due to assumptions about diminishing marginal utility, the choice of reference region majorly affects the SCC. For example, Anthoff and Emmerling show how reference region affects their results. (Remember that this, like all SCC estimates, is subject to lots of assumptions about the effects of climate change and discounting.)
(Sorry for the huge image)
If the SCC estimate is low enough it can actually be negative for some regions, meaning that any reduction in present-day consumption in those countries to mitigate climate change would reduce utility.
I wanted to jump in here while the discussion is active, but I'll also flag that John, Johannes and I are working on this and should have a post on comparing climate vs. global health/development interventions in the not-too-distant future.
Great, thank you for this! Look forward to seeing more work also.
And just a quick thought: if we know what the SCC of carbon is for Africa (looks like ~$10), and it's defined in the way you say, then we could also do the comparison directly with the Africa-SCC figure, rather than converting into US equivalent first e.g.:
1 tonne of CO2 averted -> equivalent to $10 of consumption in Africa If it costs $1 to avert a tonne, then $1 -> $10 consumption $1 cash transfer -> $1 of consumption in Africa (or maybe ~$5 to a GiveDirectly-recipient) $1 to AMF -> ~$50 African-consumption-equivalent (thinking of it as 10x GiveDirectly)
So with these figures, carbon offsets are better than cash transfers, but AMF is 5x better than carbon offsets.
I had emailed all the authors of this analysis and asked them, but they didn't get back to me, so I think it's ambiguous and not really replicable. But yes I agree it's a fairly small uncertainty compared to the others.
Thanks for rewriting and republishing this. All very interesting.
On this new revised version, something that stood out to me was the truly extreme range between the optimistic and pessimistic scenarios you describe.
I think the relative cost-effectiveness range you've given spans fully ten orders of magnitude, or a range of 10,000,000,000x. Even by our standards that's a lot. If we're really this uncertain it seems we can say almost nothing. But I don't think we are that uncertain.
By choosing a value out in the tail for 4 different input variables all at once you've taken us way out into the extremes of the uncertainty bounds. It looks to me like for these scenarios you've chosen the 1st and 99th percentiles for SCC, η, cost of abatement, and gain from doing health, all at once.
If that's right you're ending up at more like 0.01 * 0.01 * 0.01 * 0.01 --> 0.000001th percentile on the cost-effectiveness output on either end (not really, because you can't actually combine uncertainty distributions like this, but you get my general point). That seems too extreme a value to be useful to me.
Maybe you could put your distributions for the inputs into Guesstimate, which will do simulations drawing from and multiplying the inputs, and then choose the 5th and 95th percentile values for the outputs? That would go a long way towards addressing this issue.
Hope this helps, let me know if I've misunderstood anything — Rob
Thanks Rob for taking the time to comment and my sincere apologies for the delay in replying.
Generally, my agenda was probably a bit simpler than people might have supposed. This was not intended to be the last word on whether climate change or development interventions are always better. Rather it's a starting point and “choose your own adventure” model to help prioritizing between a concrete climate and a concrete development charity.
Note that there are four parameters that drive the results of this analysis (the SCC, the income adjustment eta, the cost to avert CO2, and the effectiveness of global dev/health vs. cash). For the first two, there really is a lot more uncertainty, but for the latter two, it’s more clear. This makes the model actually valuable and with action guiding potential.
For instance, if you’re a small donor and can’t decide between GiveDirectly and the Coalition for Rainforest Nations, then, if you believe that CfRN really has a cost-effectiveness of $0.02 / tCO2e averted, in many scenarios, especially the realistic one around which there is most consensus, it will often beat unconditional cash-transfers, even if you believe that social cost of carbon is quite low.
However, CfRN does lobbying, not a scalable intervention that one could invest a lot of money in. So, in contrast, if you’re a billionaire and are looking to decide between global development and climate change as a cause area for your foundation, then perhaps global development might be a better bet.
Re: Monte Carlos - I think some of the parameter inputs rely on Monte Carlos already. My hunch is that there’s no free lunch here that would reduce the uncertainty much over and above the point estimate / realistic scenario, but this is definitely that I’d like to see other people explore in future research.
I think working this through on guesttimate rather than mulitplying point estimates is really important.
I tried doing it myself with similar figures, and I found the climate change came out ~80x better than global health (even though my point estimate that that global health is better) - which suggests the title of the article could maybe use editing!
When you're dealing with huge uncertainties like these, the tails of the distribution can drive the EV, so point estimates can be pretty misleading.
Here's a screenshot of the model: https://www.dropbox.com/s/adtwlz3k2myv8gc/Screenshot 2020-05-25 20.57.11.png?dl=0
I also tried doing the calculations in a different way that I found more intuitive - where I estimate the 'utils' of each intervention: https://www.dropbox.com/s/8uczqc1qhi71lte/Screenshot 2020-05-25 20.58.02.png?dl=0
Some other reasons in favour of this approach:
Thanks for the comment!
I think I'll just leave the title for now, because it is confusing as it is and I'm not sure if it's worth it to redo/rewrite the analysis. I should probably have just called it "How to compare the relative effectiveness of development vs. climate interventions". I'll make a note in the beginning of the post linking to your guesstimate, saying that you found different results.
I can't quite follow your analysis from the screenshots (perhaps you could link the models and the assumptions for others). For instance, I'm not sure why the input value of money going to Americans vs. GiveDirectly recipients is 23 to 350.
But generally, I agree that Monte Carlo simulations and minding the distributions can be valuable for better error propagation. Also, I was probably being unclear but my analysis was not supposed to be a confidence intervals but rather my the best guess and extreme scenarios.
For instance, in the cell for cost per tonne of CO2 averted in the pessimistic scenario I intentionally picked the extreme value from the Founder Pledge analysis $0.02 and not their mean value (from the cell note: "A donation to CfRN will avert a tonne of CO2e for $0.12, with a plausible range of $0.02 - $0.72." https://docs.google.com/spreadsheets/d/12lwvxlWLjwuSuXiciFvnBF2bkfcCkrusdqqT37_QWac/edit#gid=1267972809&range=E35 ).
Echoing what Greg Lewis said about hobbyists modelling the C19 pandemic being perhaps not super productive, I'm also not sure how productive further
empirical work such as this is on the EA forum (I don't even know how many hits the forum gets generally, and this post in particular, how many climate modellers read it, etc.). I think maybe an org with more research capacity would be better suited to do further analysis on this. Or perhaps one could commission researchers with a background in climate modelling to do this (e.g. the author of this paper might be really qualified to do this: https://www.sciencedirect.com/science/article/pii/S014098831930218X ).
Hey Hauke,
That makes sense.
I do think more EA work on this topic would be useful for someone to do, since I don't think it's clear from a near-termist perspective that global health is more effective than climate change.
On guesstimate, there was an error and I was unable to save my model. If someone is looking to reproduce this though, I'd suggest they just make their own.
On the value of money to Americans vs. GiveDirectly recipients, my personal estimate was a lower ratio, because I think we should take into account some flow through effects and I think this causes convergence. I don't think values like 10,000x are plausible for the all-considered tradeoff (even though the ratio could be 10,000x if we're just considering the welfare of two individuals). More here: http://reflectivedisequilibrium.blogspot.com/2014/01/what-portion-of-boost-to-global-gdp.html
I'm still a bit unclear how useful these are due to Rob's point.
Below is one important point that I think is extremely difficult to know without being an active researcher in the field. Hauke hints at it in his footnote 6, but I want to expand on it since I think it is important to understand where the social cost of carbon estimates are coming from:
Ricke et al. 2018 (https://www.nature.com/articles/s41558-018-0282-y) are using a climate damage function that predicts much higher damages than the damage function that is used in the main integrated assessment models (IAMs) that predict the social cost of carbon (DICE, FUND, and PAGE). (I've included a note with links on this below for those who are interested). This results in an important point:
Most of the difference in the social cost of carbon between Ricke et al. 2018 and the main IAMs is because they are using different damage functions, not because they are accounting for greater marginal utility of consumption to individuals with lower consumption levels.
The more appropriate control would be to compare Ricke et al. 2018 to the gro-DICE model developed by Diaz & Moore 2017 ( https://www.nature.com/articles/nclimate2481 ), which uses a damage function that is more similar to Ricke et al. 2018. gro-DICE projects a social cost of carbon of $220, compared to Ricke et al.'s $415. However, the gro-DICE damage function is still less damaging than Ricke et al's damage function. Ideally, we would want to do a comparison of the social cost of carbon using the same damage function (so we could isolate just the effect of differences in marginal utility), but unfortunately we can't readily do this because these papers are all using different damage functions. Given that Ricke et al. are using the most damaging damage function, we do know that the effect would be less.
Note on climate damage functions: Ricke et al. 2018 use a damage function based off of Burke, Hsiang, and Miguel 2015 ( https://www.nature.com/articles/nature15725 ). This is the "most damaging" of the damage functions in the literature. Diaz & More 2017 uses a damage function based on Dell, Jones, and Olken 2012 ( https://www.aeaweb.org/articles?id=10.1257/mac.4.3.66), which is more damaging than the damage functions used in traditional IAMs, but not as damaging as the Burke, Hsiang, and Miguel 2015 damage function used in Ricke. et al. 2018.
These analyses predict much higher climate damages than the analysis that make up the DICE-2016 damage function (the DICE-2016 damage function is derived here: https://cowles.yale.edu/sites/default/files/files/pub/d20/d2096.pdf ). The reason for this is differences in econometric strategy, which is often called the "levels vs. growth debate." See Auffhamer 2018 ( https://www.aeaweb.org/articles?id=10.1257/jep.32.4.33 ) for a nice discussion of the reason why these vary. In general, this is an active debate in the field and there is not consensus on the appropriate way to predict economic damages from climate. 2018 Nobel winner William Nordhaus, for instance, would fall in the "levels" camp, and young superstar researchers Solomon Hsiang from Berkeley and Marshall Burke from Stanford would fall in the "growth" camp.
Thank you for this comment. Relevant quote from my updated analysis above:
"The new paper’s social cost of carbon figure is controversial and has been criticized for being too high for various methodological reasons.[6] For instance, one very critical new paper also now estimates the social cost of carbon on a country-level, suggesting that the global social cost of carbon is only $24 (and, using various sensitivity analyses, values ranging from $3.38/tCO2e to $21,889/tCO2e).[7]
To account for the new paper overestimating or underestimating the social cost of carbon, below, we use sensitivity analysis to show how our model responds to over- or underestimating the true social cost of carbon by 10x."
It might be helpful to flag where exactly you made the changes, and what the previous values were, and what key assumptions/estimates you changed so that it's clear to readers who read the previous version of this post.
The changes have been very substantial, because the first version was a much more simple model.
The main difference are that the first version had an error as pointed out by AGB in the comments.
Here's a comparison doc between the two version:
https://docs.google.com/document/d/1a-6xC7WjSq2-AtSuUPKaQf1ielxYFrElxfATVDBfMA4/edit?usp=sharing
Thanks Hauke! The comparison doc was very helpful.
Just an extra thought for those following up on this analysis:
I was wondering if this analysis stacks the deck against global health.
The basic idea is that SCC estimates aim to include all the costs of CO2 – these are discounted, but many of the damages come ~100 years in the future.
On the other hand, the analyses of global health mainly try to quantify the immediate effects on health and income. They don't include the idea that greater health and income now can lead to compounding economic benefits in the future.
Another way of seeing this is that the SCC estimates include 'medium-term effects', whereas the the global health ones might not.
Or another way of seeing it is that once we're willing to include long-term benefits in the equation, we're actually in the longtermist regime, and should focus mainly on existential risks.
In future attempts to compare climate change to global health, I think it would be useful to distinguish different worldviews used to make the assessment, which might be something like:
Very interesting.
In my experience the debate about climate damage is quite ideologically loaded so I am a priori very skeptical of using a single study for these kind of estimates, they always come with a host of assumptions that are ultimately fairly arbitrary.
In addition when you have a causal chain of at least three steps (climate sensitivity > impact of warming > human response) each with significant uncertainty that affects the next step it seems easy to get the estimate wrong by much more than one order of magnitude so the strategy of saying 'even if we take a tenth of the estimate' to save us from overestimation does not seem sufficient to me.
I would agree with this. My understanding is that the IAMs are so unmoored from reality as to be basically useless. They don't try to account for the risk of catastrophic impacts, and the damage functions are chosen in part for mathematical tractability rather than fidelity to what climate change will actually be like. This is why I would object to claims such as "new research shows that the social cost of carbon is $477".
This also seems like an area in which expert elicitation won't be very accurate. We're talking about impacts 100 years into the future for a problem heavily dependent on political developments which are extremely difficult to predict.
I agree that climate modelling is very uncertain, but we should not throw out the baby with the bathwater.
Quote from my analysis above:
"one study estimated a lower bound of the global social cost of carbon at US$125 and argues that:
“Quantifying the true SCC value is complicated because of various difficult-to-quantify damage cost categories and the interaction of discounting, uncertainty, large damages and risk aversion [...] The best that can be offered is a lower bound based comes from a conservative meta-estimate that aggregates studies using high and low discount rates, it does not account for various climate change damages owing to a lack of reliable information, and it does not consider a minimax regret argument addressing damages associated with extreme climate change.”
Also, as an aside, outside of prioritization, for optimal policy (e.g. carbon pricing) the social cost of carbon should be:
I now include more optimistic estimates (in the sense that the SSC won't be that high) in my sensitivity analysis.
Wow, I have never seen someone do this before! This is really impressive, excellent job being willing to reverse your conclusions (and article). Max upvote from me.
Tl;dr: This assumes pure rate of time discounting. I curious how well your analysis works for anyone who do not think that we should discount harms in the future simply by virtue of being in the future.
--
1.
THIS IS SO GOOD
This is super good research and super detailed and I am hugely impressed and hope many many people donate to Let's Fund and support you with this kind of research!!!
--
2.
LET'S BE MORE EXPLICIT ABOUT THE ETHICAL ASSUMPTIONS MADE
I enjoyed reading Appendix 3
• I agree with Pindyck that models of the social cost of carbon (SCC) require a host of underlying ethical decisions and so can be highly misleading.
• I don’t however agree with Pindyck that there is no alternative so we might as well ignore this problem
At least for the purposes of making decisions within the EA community, I think we can apply models but be explicit about what ethical assumptions have been made and how they affect the models conclusions. Many people on this forum have a decent understanding of their ethical views and how that affects decisions and so being more explicit would support good cause prioritisation decisions of donors and others.
Of course this is holding people on this forum to a higher standard of rigor than professional academic economists reach so should be seen as a nice to have rather than a default, but lets see what we can do...
--
3.
DISCOUNTING THE FUTURE, AND OTHER ASSUMPTIONS
3.1
My (very rough) understanding of climate analysis is that the SCC is very highly dependent on the discount rate.
(Appendix 3 makes this point. Also the paper you link to on SCC per country says "Discounting assumptions have consistently been one of the biggest determinants of differences between estimations of the social cost of carbon").
The paper you draw your evidence from seems to uses a pure rate of time discounting of 1-2%. This basically assumes that future people matter less.
I think many readers of this forum do not believe that future people matter less than people today.
I do not know how much this matters for the analysis. A high social cost of carbon seems, from the numbers in your article, to make climate interventions of the same order of magnitude but slightly less effective than cash transfers.
3.2
I also understand that estimates of the SCC is also dependent on the calculation of the worse case tail-end effects and there is some concern among people in the x-risk research space that small chances of very catastrophic affects are ignored in climate economics. I do not know how much this matters either.
3.3
I could also imagine that many people (especially negative leaning utilitarians) are more concerned by stopping the damage caused from climate change than impressed by the benefits of cash transfers.
SO:
I do not have answers to what effects these things have on the analysis. I would love to get your views on this.
Thank you for you work on this!!!
Thank you for your kind words Sam.
On discounting:
Of course, philosophically, pure time discounting is wrong, but:
"Another reason to discount is that far future benefits are more speculative, and changes to the world in the meantime can disrupt your project or make it irrelevant. For example, a vaccine development project that hopes to deliver a vaccine in a few decades faces a higher risk of being defunded or the disease in question disappearing, than does a similar project that expects to deliver a vaccine in a matter of years. This is a good reason to discount future benefits and costs, but the appropriate rate will vary dramatically depending on what you are looking at, and will not necessarily be the same every year into the future."
https://www.givingwhatwecan.org/post/2013/04/was-tutankhamun-a-billion-times-more-important-than-you/
The social cost of carbon is generally highly sensitive to the pure rate of time preference.
But:
"The national social costs of carbon of faster growing economies are less sensitive to the pure rate of time preference and more sensitive to the rate of risk aversion" from Tol
and from the Ricke paper:
"CSCCs were calculated using both exogenous and endogenous9 discounting. For conventional exogenous discounting, two discount rates were used, 3 and 5%. the results under endogenous discounting were calculated using two rates of pure time preference (ρ=1, 2%) and two values of elasticity of marginal utility of consumption (μ=0.7, 1.5) for four endogenous discounting parameterizations."
So maybe it's not highly sensitive to just discounting anymore.
But both the Ricke and the Tol paper use sensitivity analyses on their SCC and different parameterizations make SCC 10s to 1000s of $ per tonne and I guess they'll use "sensible" ranges for this.
I would love others to look into this more as well and could well imagine new research uncovering facts that would dominate this analysis.
I have included this estimate along with some commentary about why I disagree with your conclusion in an overall review of climate cost-effectiveness analyses.
Hauke's calculation simply determines a standard Benefit/Cost ratio. If it costs $10 to avert a tonne of CO2 that provides benefits of $417 (in damages averted), this Benefit/Cost ratio equals 41.7. This ratio should be directly comparable to Copenhagen Consensus 'Social, economic, and environmental benefit per $1 spent.' For the Post-2015 Consensus, 'Climate Change Adaption' is listed as providing a Benefit/Cost ratio of 2 while climate-related 'Energy Research' has a ratio of 11. I would weight these results from meta-level research must more strongly than that from a single study. But even if we believed Hauke's study, a benefit/cost ratio of 41.7 still lags 'Reduce Child Malnutrition' (ratio of 45) or 'Expanded Immunization' (ratio of 60). This hardly suggests that "we should consider prioritizing climate change over global development interventions." The unconditional cash transfer benchmark that Hauke uses is a minimum and not representative of highly cost-effective interventions in global development. Using GiveWell's estimates, deworming and malaria nets are more than 10x more cost-effective than cash. Before rushing to replace well-established priorities and interventions that are based on decades of research, we need to have substantial confidence in the new priority/intervention. This study is far from it.
Note that the Copenhagen Consensus and GiveWell results do not apply utility adjustments. If this new climate change study does so, its Benefit/Cost ratio would be distorted by improperly inflating Benefits, which make the ratio larger than it actually is.
Thank you- I've now included this in my model:
"Some global development interventions have been estimated to be 17.5x more effective than cash-transfers (e.g. deworming).[34] We use this as the optimistic case."
When a post like this on cause prioritization appears on EA forums, I expect it to go something like this: "the marginal costs of the best interventions are lower in category A than category B, under the following assumptions (though if we tweak the assumptions in a certain way, B looks better)... so it's likely that we should fund those best interventions in category A rather than B."
This post, however, doesn't appear to be based on the current EA thinking about the marginally-best interventions for climate change or global development. On climate, the last thing I heard was that clean energy R&D is most sorely needed... which agreed with my prior that molten salt reactors are awesome, scalable and sorely needed, plus the potential of things like enhanced geothermal energy to provide a transition path for the oil & gas industry, and then there's alternative fusion technologies like DPF and EMC2's Polywell (whose value to society is either zero or astronomical). Yet I don't see these on the chart of interventions. I don't recall what the best available interventions for global development are thought to be, but I thought I heard someone say that cash transfers likely weren't it.
And although we should be skeptical of "free lunch" interventions with negative costs, that doesn't mean they aren't real. Some of them could be great investments, and if so, should we not identify which ones are realistically negative-cost and invest in them?
(I only read the first half; sorry if I missed something important.)
You're absolutely right - generally, my agenda was probably a bit simpler than people might have supposed. This was not intended to be the last word on whether climate change or development interventions are always better. Rather it's a starting point and “choose your own adventure” model to help prioritizing between a concrete climate and a concrete development charity.
Note that there are four parameters that drive the results of this analysis (the SCC, the income adjustment eta, the cost to avert CO2, and the effectiveness of global dev/health vs. cash). For the first two, there really is a lot more uncertainty, but for the latter two, it’s more clear. This makes the model actually valuable and with action guiding potential.
For instance, if you’re a small donor and can’t decide between GiveDirectly and the Coalition for Rainforest Nations (or perhaps the Let's Fund Clean Energy campaign that you cite), then, if you believe that CfRN really has a cost-effectiveness of $0.02 / tCO2e averted, in many scenarios, especially the realistic one around which there is most consensus, it will often beat unconditional cash-transfers, even if you believe that social cost of carbon is quite low.
However, CfRN does lobbying, not a scalable intervention that one could invest a lot of money in. So, in contrast, if you’re a billionaire and are looking to decide between global development and climate change as a cause area for your foundation, then perhaps global development might be a better bet.
Thanks for this. One thing that perplexes me about the Ricke et al. (2018) analysis is that the SCC for most African countries looks to be lower than for the USA (fig.2), whereas the general consensus seems to be that the impacts of climate change will have far worse effects on individuals' utilities in Africa. So this makes me wonder have they properly captured the effect of marginal utility changing with income? I'm not an economist, so I don't know how to judge this myself.
Excellent point
I think it's a mixture of the following:
1. African countries are relatively small
2. the social cost of carbon measures the cost to GDP - and if your GDP is not very big to start with then there's not a big cost to you.
It is quite unintuitive/ disconcerting that the official social cost of carbon for the DRC (one of the poorest countries, 80 million people, close to the equator and particularly affected by climate change), only has a social cost of carbon of 30 cents per tonne, whereas the US has one of $40 - see:
https://country-level-scc.github.io/explorer/
As I said above, there are contributors to (true) social cost of carbon not fully captured by empirical, macroeconomic damage functions, and their likely impacts on the social cost of carbon (see Table S5 in the paper’s supplementary material and Table 1 in[21]). For instance:
That's why in the pessimistic version of my model increased the SCC by 10x (higher than most estimates).
Even after the update, I'm confused by this model. I'll restrict my attention to the "Realistic case" for simplicity.
The global social cost of carbon when constructed from the country-level estimates is effectively:
CCG=CCa+CCb+CCc+…
where CCG is the global social cost of carbon and CCa, CCb, CCc, etc. are the country level social costs of carbon for countries 'a', 'b', 'c', etc.
The spreadsheet model then uses an income adjustment factor of 1,260 expressing that a dollar means more to a poor person than a rich person. We can also think of this as a unit conversion factor: 1,260 American median income dollars = 1 GiveDirectly recipient dollar. We can write this conversion factor as 1260$A1$GD=1.
The next step in the model is to divide the global social cost of carbon by the income adjustment factor. If we expand global social cost of carbon, this looks like:
CCG1260=CCa1260+CCb1260+CCc1260+…
If we just look at the units, this is:
$G$GD$A=$a$GD$A+$b$GD$A+$c$GD$A+…
where $G is a country-level-cost-of-carbon-weighted dollar, $a is a dollar in country 'a', etc. Converting country 'a' dollars to GiveDirectly recipient dollars via $GD1260$A is only appropriate if country 'a' is in fact America. Otherwise, the units don't line up.
It seems like what we'd actually want as far as income adjustment is something like:
CCG−GD=$a$GD$a+$b$GD$b+$c$GD$c+…
where CCG−GD is the global social cost of carbon expressed in GiveDirectly recipient dollars.
In other words, we can't just apply the same income-adjustment factor to every country's social cost of carbon because not every country has the same income. We need per-country income adjustment factors. Applying the 1,260 income adjustment factor to American social cost of carbon works but in applying this adjustment to the global cost of carbon, we are also implicitly saying that the social cost of carbon in Burkina Faso ought to be discounted just as heavily.
I think the only way the current approach works is if we assume that country-level costs have somehow already been adjusted into American median income dollars.
Thanks for this comment and apologies for the delay in replying.
As mentioned I had emailed the authors and they didn't get back to me, and also the author of this paper this paper, "A social cost of carbon for (almost) every country" had apparently trouble replicating their analysis.
But both these papers do cite individual costs of carbon for each country - for instance here:
https://country-level-scc.github.io/explorer/
There you can for instance see that India's SCC is $85.4 . I think this is based average income till the end of the century taking into account growth ("socioeconomic projections" (perhaps $20k/capita ).) and how much they're hurt by climate damages given how rich they are. This figure is then income adjusted so that it is comparable with present day Americans (it might actually downward adjust the damages of rich countries which will be richer than present day US by the end of the century). Because then it can be interpreted as "this is what the Indian government should spend right now in USD to avert per tonne", which seems to make most sense.
These costs are then all added together to arrive at the global social cost of carbon and what we should spend collectively to avert a tonne of CO2. This is why I think we can compare this with Givedirectly and the analysis is roughly correct.
I think my current model is suboptimal in that it mixes up different income adjustment factor eta = 1.5 and combining it with a different eta they use in the paper. It might be good to standardize this in one analysis. This might change the results.
I'm sorry that I didn't understand quite the point you're making, but you might legitimately be onto something. I think to get to the bottom of this it might be best to create a new model with open and transparent code to figure this out. I saw that you did very good quantitative analysis in a different post, so perhaps you could take this on. But maybe this would be more something for a slightly bigger org with more research capacity to take on. Not sure how productive this is or whether there's really demand for such an analysis though.
Not sure which explanation will work better so I've included both a prose description of what I think is going on and a model. Look at whichever seems most useful.
Words
I think this is the crux of the discrepancy. I interpret the country-level social cost of carbon as expressing the cost in terms of that country's citizens' consumption. More concretely, if the social cost of carbon is $85/tonne of CO2 in India and everyone in India emits 5 tonnes of CO2, everyone's welfare in India is as though their income is actually $425 (5 * 85) lower. I understand you to be saying that if everyone in India emits 5 tonnes at $85/tonne, it's actually as though their income is reduced by $12.5 (5 * 85 / 34 where 34 is the poverty multiplier using an eta of 1.5 and an Indian income of $2000). The lower number comes because you believe the $85/tonne to be quoted in terms of dollars for the American median income and it needs to be adjusted to account for the fact that each dollar "means more" in lower-income India. Is that description intelligible? Is it an accurate account of your views?
Supposing that's right, I can now explain why I believe my version. I think the relevant parts of the paper and model are the damages module and the discounting module.
I don't think the sort of adjustment-to-America (i.e. "income adjusted so that it is comparable with present day Americans") would happen in the damages module. Indeed, a quick skim of the damage function reference shows it to be talking purely about macroeconomic indicators. So the output of the damages module very likely is in local terms (e.g. a 1% decline in India's GDP) rather than American terms.
Based just on the name, if this sort of adjustment-to-America were present, I'd expect it to take place in the discounting module. But the Ricke paper doesn't describe any sort of adjustment for disparate incomes at time T=0. The income-relevant adjustments they perform are an: (1) an optional rich-poor damage specification which affects how damages grow over time for countries in each bin; (2) an optional elasticity of marginal utility adjustment to account for how the cost diminishes as economies grow [1]. So it doesn't look like the discounting module does the required adjustment-to-America either.
Model
I've also made a quick spreadsheet model trying to explain what I think is going on.
The first two tabs are just data--the country level social costs of carbon and the GDP per capita (median income probably would have been better but alas).
The next tab to look at is probably "Hillebrandt Analogue". It replicates your calculation using country-level data. It applies your uniform "Realistic" poverty multiplier to each country and then sums rather than summing before applying the poverty multiplier. Reassuringly, we get basically the same result: a global social cost of carbon of $0.32.
The other two tabs show roughly how I think the modeling should be done.
"CSSC in American Dollars" uses American GDP per capita as a reference income to compute separate poverty multipliers for each country based on its GDP per capita. The multiplier is 1 for America, less than 1 for countries richer than America and much greater than 1 for countries much poorer than America. Applying each country's poverty multiplier to its country-level social cost of carbon and summing gives us a global social cost of carbon $36,834. If 100% of the social cost of a tonne of CO2 fell on an American making $62,641 (US GDP per capita), this would be the welfare-equivalent of a $36,834 reduction in income.
"CSSC in GiveDirectly Dollars" follows the same procedure but uses GiveDirectly annual consumption ($180) as the reference income. Thus the poverty multiplier is near 0 for most developed countries and is only over 0.5 for extremely poor countries like Burundi. Applying each country's poverty multiplier to its country-level social cost of carbon and summing gives us a global social cost of carbon of $5.67. If 100% of the cost of a tonne of CO2 fell on a typical GiveDirectly recipient, this would be the welfare-equivalent of a $5.67 reduction in income.
Interestingly, this $5.67 figure makes climate change interventions within a factor of 2 of GiveDirectly in terms of cost-effectiveness (assuming $10 tonne/CO2 averted).
I think it's pretty clear from context that this income adjustment is only applied within countries over time rather than across countries at time T=0: "We thus used growth-adjusted discounting determined by the Ramsey endogenous rule, with a range of values for the elasticity of marginal utility (μ) and the pure rate of time preference (ρ), but we also report fixed discounting results to demonstrate the sensitivity of SCC calculations to discounting methods." ↩︎
Thank you so much for this thoughtful comment.
Unfortunately, I won't have the time to give it the time it deserves to engage with it properly (e.g. rework the analysis etc.).
I think you raise interesting points and people looking to extend this work further should take your comment into account.
Okay, thanks. I will likely write this up as a post then so that the concern doesn't get lost here in the comments.
Thanks this is a great idea!
I'm really sorry that I don't have more time for this.
This post was awarded an EA Forum Prize; see the prize announcement for more details.
My notes on what I liked about the post, from the announcement:
Thanks, this is interesting! I quickly read through the core paper and am a bit confused.
It seems like you're understanding income adjustment to be one of the main additions in the paper. Where are you seeing that? The title/abstract/etc. seem to be pitching greater spatial resolution as the main contribution. Greater spatial resolution helps with income adjustment but isn't sufficient. As far as I can tell the paper primarily uses regular old GDP per capita (with the de rigeur acknowledgement that GDP isn't a great welfare measure). The only income adjustment I see is a couple of mentions of rich/poor specifications and the supplementary information suggests that this is just splitting the formula for the growth of damages based on whether a country falls into the rich bin or poor bin.
They explain the increased cost not as due to income adjustment (as I understand things) but because:
All that said, I wish it did use logarithmic utility because that seems like an important improvement!
(FYI: All the inline footnotes still link to a Google doc.)
This is really interesting. I'm curious about crowding out and marginal dollar effects. i.e. the smart money spends all its resources on this, allowing the dumb money to free ride and keep on with the status quo (or even get worse with less perceived consequences). Meanwhile, there are now far less smart dollars available to fund weird moonshots that only the smart money can think about.
One solution: more funding for geoengineering moonshots (and please, with fewer assumptions that geoengineering automatically means that safety and reversibility aren't major design criteria).