(Written on a plane to Christmas holidays, so apologies for lack of links, and further engagement being delayed to 2023). Thanks for writing this! I am looking forward to more work on this and to find the best thing in this space, but I am extremely skeptical of the claim that we do not know anything about how anti-deforestation compares to other things we can fund in climate.
As my team and I have spent thousands of hours at this point working on what gives rise to relative cost effectiveness in climate (which is what this claim is about) and I also conducted a 50h+ investigation on CfRN and REDD+ in 2020 when reevaluting (we were unable to publish this for organizational reasons, FWIW our estimates where in the upper end of the range cited here and I'd be happy to share in DM), I wanted to explain why (not sorted by importance, but by explanatory logic moving from more outside to more inside view):
1. First, in some trivial sense, it is of course true that we do not know with 100% certainty. But the claim that we know nothing about the relative cost effectiveness of anti-deforestation feels akin to the following statements: (a) "We do not know for certain that giving to the Center for Health Security (CHS) or donating PPE to your local hospital is more effective to reducing biorisk" , (b) "We do not know for certain that giving to the Good Food Institute is better to reduce animal suffering than giving to your cat shelter next door". These statements are trivially true, but I assume almost everyone reading this would feel quite confident in CHS > PPE for local hospitals and GFI > local cat shelter and would not be distraught by the lack of RCT evidence or unified identical methodology across evaluators. My tldr point is we should feel the same about this case, because -- like in those cases -- we know a lot about the structure of the problem including philanthropic biases, but also about the effectiveness of different strategies.
2. The reason for that, to me, seems a Bayesian mindset of "what should we believe given the evidence?" rather than what are we 100% certain of, a state we will never reach in an intervention space covering decades, uncertain futures, and global human and natural systems.
3. So what is the evidence against ignorance on cost-effectiveness? At its most outside-view-y the fact that three evaluators that have looked at this independently (FP, SoGive, Giving Green) and none of them has anti-deforestation as their top recommendation is evidence against this. The fact that FP stopped recommending CfRN is additional evidence of this kind, as is SoGive's work that led EA away from early recs in this space and the recent work by Vasco et al on tree planting cost-effectiveness.
4. This evidence is stronger when one takes into account significant donor pressures to find anti-deforestation good. I am sure we could all advise a lot more money if we had rainforest charities in our top recs, the opportunity cost of not recommending in this space is high in terms of advised money. (This is also the main reason I am writing this reply now despite heading out for holidays, I think such a claim of ignorance is quite negative for effective giving in climate because a lot of donors want to believe this as much as Mulder wants to believe in aliens).
5. Going one step less meta, Vasco et al's recent piece has an appendix that discusses considerations on what a reasonable prior on this might be. I am certainly biased in that they rely on our report to form that prior, but I think it gives a good brief overview of the key considerations why one should approach cost-effectiveness of forest-related interventions with skepticism compared to alternatives.
6. The most important reason against to me seems the utter non-neglectednees of anti-deforestation (even Republicans like planting trees!). I literally get emails from people I have not talked to in years who know I work in climate that ask me how to save the rainforest. Less anecdotally, natural solutions is one of the largest pots in climate philanthropy and the Bezos Earth Fund and several other for the other largest climate philanthropists have strongly increased giving in this space, so it is not only one of the largest spaces, it is also one of the fastest growing ones. What is more, philanthropy focused on conservation, also including interventions like this, is several X larger than climate philanthropy (last I checked at least 2-3). This should make one very sceptical to be able to find (under reasonable search cost, including opportunity cost) high quality room for funding that would not otherwise be quickly filled unless one has a systematic theory of why all large donors overlook this. (Maybe such an opportunity exists with small organizations that large donors consider peanuts, but for country level REDD+ this special consideration does not apply). Almost any charity will almost always offer room for funding and a good story so analysis of philanthropy data and donor behavior patterns is crucial to analyze in a space with as much money influx as climate when considering counterfactually adjusted cost-effectiveness which is what we are after.
7. More broadly, there has been a multi-decade global effort to find tractable cost effective interventions around avoiding deforestation. Given the salience of conservation before climate, I assume they preceed climate, but since I am more familiar with climate I will focus on this. Essentially ever since the birth of international climate policy in the early 1990s the international community has tried to solve the problem of rewarding poor countries for taking cheap abatement options, often in the context of forests and with REDD(+) since the early 2000s. Everyone wants this to work, whole governments (Norway in particular) spend enormous resources to make this work. Yet, as of mid-2020, when I last looked at the literature in depth, I think it was pretty clear this by and large did not work in a way that achieves additional and permanent anti-deforestation. It's of course possible something fundamentally changed since then but I haven't heard of it despite following climate news pretty closely.
8. I think we have good reasons to expect this to remain intractable because the two biggest problems in the space are irresolvable.Permanence can never be guaranteed until we figure out how to construe contracts that bind future governments of sovereign countries. Additionality of avoided deforestation can never be guaranteed until we can run and compare multiple worlds. These are not techical or governance issues that can be solved with better satellites or slightly improved international frameworks, these are deep reasons to be skeptical on the tractability of avoided deforestation vs more tractable strategies.
9. More subtly but quite importantly, the effectiveness of investing in anti-deforestation is negatively correlated with its value, anti-deforestation is least effective in the futures where it would matter most. This is the opposite of what we want, we would want at least robustness (independence of effectiveness and value) and ideally, for lack of a better term, hedginess (positive correlation between effectiveness and value; I discuss this much more in my SERI talk on the structure or climate risk and its implications for high-impact climate philanthropy).
Much of the uncertainty on cost-effectiveness of anti-deforestation is driven by uncertainty about permanence and additionality, which is arguably related to international and national political conditions. Anti-deforestation via REDD+ will be most cost-effective in futures where international cooperation is good and we get a functioning and, crucially, lasting global anti-deforestation market. These are worlds where the social cost of carbon, the value of additional abatement, is likely quite low because these conditions correspond with good climate progress overall. Conversely, in worlds where additional abatement is particularly valuable, with poor international coordination and low climate policy and lots of energy-intensive growth, REDD+ is unlikely to work. This sounds like an absurdly technical point, but given the shape of climate damage it is actually quite important and it makes reduced emissions in expectation the wrong metric for evaluating climate impact as long as we know something about how different interventions correlate with warming trajectories (and thus marginal value of abatement).
Crucially, energy innovation as the generally considered most cost-effective intervention (at least naively, when not adjusting for recent crowding), does not have this weakness. Somewhat roughly, solar will still be relatively cheap when climate policy breaks down, the world forms blocs, and there's lots of energy-intensive growth in emerging economies, but REDD+ will likely fail.
10. I could go on but this comment is already too long. To summarize, it seems to me we have all kinds of relevant evidence that should make us quite skeptical of the claim that anti-deforestation is likely to be particularly cost-effective, in particular in relative terms. It looks bad on the outside view, on neglectedness, it looks bad on tractability and on many more inside-view considerations. Moreover we do have more evidence than the post grants on the relative cost-effectiveness of other interventions. Since I first made the argument for innovation advocacy for neglected technologies in EA in 2016/2017 this was vetted by Let's Fund, Founders Pledge (before I joined), SoGive, and Giving Green. The fact that this theory of change / intervention strategy has stood the test of time across evaluators does carry information. While I am not sure it's still the best thing to do on the margin (given how philanthropic additionality is changing, I think it's possible that interventions to avoid carbon lock-in might beat it), it seems very unlikely for all the reasons discussed above that we should be in a state of ignorance when we compare it to REDD+.
I am still curious to see what you find and I think that when one is willing to incur a comparatively very large search cost there might be good things that can be found. But I don't think we are in a state of ignorance until then with regards to what we should expect on its relative cost-effectiveness, especially compared to interventions that have been investigated and found cost-effective by several evaluators.
Thanks for your very thoughtful comments, Johannes.
Please note that we do not have the bandwidth to respond in detail here to each of the 10 points you lay out in your comment (nor to all Forum comments on our reports), but we will do our best to respond to those we find most critical to the conversation and would love to find a time to further discuss these and your remaining points over separate correspondence.
With regard to the Bayesian mindset to which you allude (“what should we believe, given the evidence?), we agree with this approach. Of course, the evidence in the space of climate economics and policy is vast, so we hope we can agree that this approach is a significant undertaking that would benefit from coordination and collaboration across relevant orgs in EA. Given the vastness and complexity of various climate-relevant literatures, we believe that there is a real risk of jumping to conclusions too hastily, hence our interest in introducing some form of time-efficient peer review process among the major EA climate research organizations.
Our aim in this project was to summarize and discuss the best evidence we could find on the (cost-)effectiveness of REDD+ over about 8 weeks of two full-time researchers’ time, and to draw reasonable conclusions about the interventions’ potential impact and CE. We do not claim that this research is fully comprehensive and we caveat that it was undertaken early in 2022 (e.g., before the recent presidential election in Brazil or the 30x30 agreement, the implications of which we have not researched in any depth).
That said, we do hope that the EA community can use the research as a starting point for coming to a consensus on the CE of REDD+ as a climate intervention. We aim to be quite clear about our main uncertainties in the report and provide some suggestions for how researchers could usefully spend more time. After finding little in the way of comparable estimates in the EA climate literature, we concluded that it would be quite difficult to confidently claim that REDD+ was a relatively cost-effective intervention relative to other climate interventions, and even more difficult when broadening the comparison to global health and development interventions.
It is very possible that there is more consensus (using a comparably rigorous research approach, with comparable outcome measures) than we are aware of regarding the cost-effectiveness and potential impact of the myriad climate interventions that could plausibly “pass” an ITN shallow review, and that this EA consensus would be compatible with broader climate expert consensus. However, many of the EA-recommended climate charities we came across were related to climate advocacy, where cost-effectiveness estimates are understandably difficult to pin down given extreme sensitivity to modeler assumptions and relatively short-term political contexts, making direct comparison or ranking quite difficult.
We hope to discuss how to improve intervention comparability with you and others in the EA climate space in the near future! If there is indeed such consensus and comparability, perhaps we could collaborate to compile this information for ease of comparison, and we will update our report accordingly.
On the subject of neglectedness, the Bezos Earth Fund is indeed focused on natural climate solutions, though they have committed (i) “only” $10B over 10 years (where we anticipate RFMF an order of magnitude larger — and annually — over the next ten years for REDD+), and (ii) not specifically to the REDD+ framework, to our knowledge.
Regarding your point about historic REDD+ not having achieved additionality and permanence, we refer you to the report, where we largely agree with this perspective and hence recommend a focus on jurisdictional REDD+ programs that are gaining significant momentum, as well as continuous results-based payments for the entire duration of the desired avoided emissions. We also touch on reasons we expect additionality and permanence concerns to diminish going forward.
Finally, we have recently begun to consider whether it may make sense to recommend various options for different “types” of potential donors in the climate space (also for risk diversification). As you suggest, it is possible that a whole lot of potential philanthropic dollars are not being allocated (or are being allocated to other causes) due to donors’ preferences for near-term / more certain vs. long-term / more risky solutions, or for carbon savings alone vs. perhaps lower carbon savings with significant (human, gender, biodiversity, other) co-benefits, etc. Unless those potential philanthropic funds otherwise get allocated toward other high-impact charities (i.e. not “the cat shelter next door”, which seems plausible for individuals desiring near-term, tangible impact), neglecting to provide donation recommendations that align with donor preferences represents a missed opportunity for impact.
We have written some additional (and generally more specific) responses to some of your points, which we look forward to discussing with you in separate correspondence. Thanks again, and looking forward to continuing the conversation!
I'm pleased to see more work on REDD+, so thank you for your efforts here. I'd agree that among the "offset-esque" options, REDD+ is relatively promising.
I think this report understates the risks of PES. I'm willing to believe that PES generated real deforestation benefits when it came to the Jayachandran et al study. However there are some questions about generalisability. Successful implementation of PES requires effective land rights, effective monitoring, reporting and validation, and can be stymied by corruption (several sources have made this point, see e.g. CIFOR). Also I think that readers of this report may believe that all REDD+ interventions are PES, but that's not the case -- several other interventions are also used, including export taxes and regulation of land use. I.e. governments may well be using interventions which have an even weaker evidence base than PES (which might be sensible because of the concerns that I outlined about PES). I think this shows that it's really hard to implement REDD+ well -- some countries do appear to have achieved results, but continued success in this area is not guaranteed.
Additionality/reference levels -- did you account for the return of Lula? I liked your observations about the reference levels -- we too share these concerns. I'm sorry if I missed it in your piece, but I would have liked more detail on why you concluded that a range as high as 60%-100% was additional, especially given that the return of Lula in Brazil would likely be good news for forests anyway (even without REDD+).
You seem more confident than I am that leakage will be solved by jurisdictional REDD+. There are multiple ways that suppressing deforestation in one place can cause more deforestation to "leak"/displace to other areas. Even if some RCTs/studies do find that within-community leakage/displacement did not occur, leakage may still have happened. For example, when we looked into Cool Earth, we learned that the people who chop down trees often travel from some distance, e.g. in Peru they may have come from the Andean region, and elsewhere they tend to be large multinational companies. To the extent that deforestation is caused by a large multinational company, it seems that some sort of REDD+ would need to be implemented pretty much everywhere, which seems a tall order.
Failing to continue PES payments is not the only threat to permanence. Risks include political risks, or risks to REDD+ itself. As we highlighted in our report on CfRN (the organisation which administers REDD+), there are risks to the REDD+ scheme itself -- some countries have expressed concern that they have received only a fraction of the funds promised to them under REDD+. I'm unsure how much those concerns are reduced after Lula's win in Brazil.
We haven't built a cost-effectiveness model for REDD+ yet (and it may be some time before we do), however I predict ours might end up with numbers that are somewhat less favourable than yours.
I should also add that it's easy in comments like the one I'm writing to focus on areas of disagreement; I'm sorry if it makes the tone of my comment sound negative! I do think there are lots of useful and valid contributions in this report. Also, although I read through most of this, I didn't carefully read all of it, so it's possible that I've missed some things.
Thanks, Sanjay. Generalizability is indeed crucial, and we discuss the conditions for success of jurisdictional REDD+ (JR+ hereafter), including things like effective political incentives to avoid issues around property rights and corruption (see subsection “Political leaders need incentives to follow through”), as well as the need for effective MRV (see section “REDD+ measurement, reporting, and verification (MRV) standards are thorough but not yet sufficient to adequately account for forest degradation”), though we acknowledge that there is much additional research that could be done to understand these issues across various contexts. We (like the experts with whom we spoke) see reason for optimism in the recent advances toward JR+, technological advances in improving data collection and improving MRV, and improvements in certification in light of the very issues you mention. We also suggest that funding toward programs that aim to improve the likelihood of JR+ success along these dimensions could be worth researching, though we did not ourselves explore any such programs.
As mentioned in the response to Johannes, we conducted most of this research in the beginning of 2022 (i.e. many months before the Brazilian election). However, the lowest-cost opportunities according to the WEF and McKinsey (2021) report, on which we rely heavily for our CE estimates, are not in Brazil, so we imagine the change in the political landscape would not substantively change our general stance that JR+ appears cost-effective and there is RFMF to get it off the ground. The return of Lula may actually improve the prospects for JR+, given the difficulty of achieving its ends without political buy-in.
Indeed, we also make the point that efforts to expand the coverage of JR+ are crucial for preventing leakage. And we did not come across much in the way of countries threatening to abandon REDD+ due to lack of prompt payment in our research, though we would definitely be interested to hear more about this if you have some sources you could share, and we agree that Lula’s recent election will likely change the political rhetoric in the Brazilian context.
Indeed, we were more pessimistic about REDD+ when we started the research for many of the reasons that you and others have expressed skepticism, and rightfully. We hope the report adequately justifies our own stance. And of course, we are very open to comparing CE models and outcomes - please reach out if you do build such a CEA!
Sorry I don’t have the capacity to dig into all the sources but it would be helpful to understand:
Are your end results per year or forever? You say "we conclude with our best guess of cost-effectiveness, which ranges from $6 to $62 per tonne of CO2 (tCO2) abated with 80% confidence. " but is this $6-60 every year or is this a one off payment of $6-60 and then that land is never deforested? This makes a huge diffenrce to understanding so good to be explicit.
Do you have an estimate for tCO2 per hectare? The costs per hectare (e.g. in the Ugandan study) seem similar than you costs per tCO2, but there are like 500 tCO2 per hectare so confused about how you are converting one to the other.
Thanks for this impressive investigation!
do you intend to publish it on RP's research page? I'd like to share it with or cite it to people working on deforestation and climate change, and I suspect it'd look more legit for non-EA people if it wasn't on the Forum.
This is impressively thorough, thank you! Do any authors have a view on the pandemic prevention externalities of REDD+? The idea is that by reducing deforestation you also reduce the risk of zoonotic spillover. Would this consideration significantly increase broad cost-effectiveness? Should it alter our view of where in the world anti-deforestation efforts should be prioritised?
Thanks for your engagement with our piece, Ben! We haven’t looked into the zoonotic spillover/pandemic prevention implications of REDD+. Our team’s report doesn’t consider the co-benefits of reducing deforestation that are not already encapsulated in one’s estimated/preferred social cost of carbon (SCC), given the attempt was to constrain the cost of abating a tCO2(e).
As for a very hasty first pass [not to be taken seriously]: I’m thinking that considering pandemic co-benefits is like saying the social cost of forest carbon (SCFC) > SCC. Then there’s your second point, i.e., that SCFCregion A > SCFCregion B. Unfortunately I don’t have a good intuitive sense of these inequalities, nor overall how significant considering the pandemic co-benefit would be for influencing REDD+ regional prioritization. My very rough guess is therefore that the significance – for philanthropists interested in tackling deforestation – would probably depend on (1) the magnitudes of the inequalities, including the frequency/severity of deforestation-induced pandemics, (2) the extent of overlap between forests most prone to pandemic-inducing zoonotic spillover and those with the highest deforestation reduction potential/cost-effectiveness via REDD+, (3) perhaps how promising alternative pandemic prevention strategies are, and (4) maybe even moral weights, risk preferences, and other things I haven’t considered.
AI Use Note: Main body text entirely human written. Claude (Opus 4.8) helped develop models of animal life histories in the appendix.
Cross-posted from Good Structures.
Executive Summary
* Animal advocates sometimes make claims like “there are X of this animal...
“How long have you been v*g*n?”
This is one of the most common icebreakers at animal protection events. It’s a baseline assumption, and it mostly holds true: if you’re out advocating for animals not to be tortured or abused, realistically these days you are v**n, or close. And it makes for good conversation. It seems fairly safe to assume when you meet strangers.
But this assumption is hurting the movement in a way which we don’t always notice: someone new comes into the sp...
Summary
Back in November 2023 I posted here to launch Spiro and raise our first $198k. Two and a half years later this is an update and a fundraiser for the next step.
The short version: we've now reached over-5,900 people with TB preventive medicine, including over 3,000 children under five years old. Our early results have held up well an...
The purpose of this report is to provide a rigorous overview of the research and uncertainties in relation to REDD+, given disagreements and inconsistencies in the EA perspective on anti-deforestation initiatives (particularly the Coalition for Rainforest Nations) in the past. This preliminary evaluation of the intervention does not include recommendations for funding particular organizations, nor does it sit within a wider portfolio of such evaluations that would allow for comparisons in cost-effectiveness across similarly evaluated climate interventions. The research was commissioned by a client who sought an unbiased and academic research-driven perspective on the promise of anti-deforestation initiatives. We opted to focus our investigation on REDD+, since it is both the intervention that CfRN proposed and seemingly one of the most tractable anti-deforestation solutions of which we are aware. There was no direct communication between the researchers and the client — who remains anonymous to the researchers — for the duration of the project. We conducted a vast majority of the research in Q1 and Q2 2022, and we have not updated the research to reflect changes in the global landscape nor other research/publications since then.
Editorial note
This report is the first part of a two-part series on anti-deforestation initiatives. The overall project was commissioned by an anonymous donor.
This report examines the feasibility and cost-effectiveness of the REDD+ framework for reducing forest loss and degradation and for abating CO2 emissions that contribute to climate change. We first investigate the overall effectiveness of payments for ecosystem services (PES) programs, the broad category of environmental interventions into which REDD+ falls. We then evaluate REDD+ with respect to the issues that plague PES programs in general, and spotlight jurisdictional REDD+ (i.e., as implemented consistently within a state or country) as a promising solution. Finally, we estimate with 80% confidence that the cost-effectiveness of REDD+ falls within the range of $6-$62 per tonne of CO2 abated.
We have tried to flag major sources of uncertainty in the report and are open to revising our views as more information becomes available.
Epistemic status
Updated as of June 2023
We first published this report in December 2022. In March 2023, Dr. Matthew Dahlhausen of the National Renewable Energy Laboratory pointed out in a Slack post that our treatment of permanence required more nuance, since permanence can be assessed on different timescales. We have since had a constructive conversation with Dr. Dahlhausen, after which he sent us a more thorough written assessment of the issue. In total, we have engaged with his collective feedback for about three to four hours. We read more about and deployed the CarbonPlan permanence calculator in an attempt to understand how our cost-effectiveness estimates might be affected by stretching the relevant timescale of emissions reductions to 1000 years, as opposed to 100 years. The cost-effectiveness of the lower bound of our estimate range increases substantially when we consider a 1000-year timescale (from $6/tCO2 to $206/tCO2, assuming no risk of reversal, availability of permanent removal technologies costing $200 from 2050, and a discount rate of 0%). Given general uncertainty over the relevant timescale, Dr. Dahlhausen’s point has therefore reduced our confidence in our estimated cost-effectiveness range.
We also engaged with his more thorough critique, which we do not currently have the time to satisfactorily assess nor respond to with commensurate updates to our report, though we agree that they likely lead to potentially much more uncertainty and a wider cost-effectiveness estimate range. We also agree with his take that assessing cost effectiveness for anti-deforestation is extremely complicated, and there is not an easy fix. Based on our interview with McKinsey and the methodological appendix to their Nature and Net Zero report (on which we rely heavily for cost-effectiveness estimates), we are not confident that Dr. Dahlhausen’s critiques are adequately addressed in their modeling, though it is possible they will address these concerns in the future in collaboration with the LEAF Coalition. We remain sympathetic to the view that anti-deforestation measures are a potentially important “interim” and “enabling solution” until more permanent emissions reductions become less costly to achieve (McKinsey 2021, p. 30, Box 11), and we hope to have an opportunity to engage more deeply with Dr. Dahlhausen’s critiques in the future.
Key takeaways
Based largely on a 2021 consultation report by the World Economic Forum (WEF) and McKinsey & Company, we are fairly (~80%) confidentthatthe majority of emissions reductions from REDD+ over the next decade would cost $6-$62 per tonne of CO2 (tCO2). Despite ongoing implementation issues, REDD+ therefore represents a cost-effective abatement strategy in the near term (e.g., next 10 years), though not as cost-effective as previously claimed by EA organizations.
The ranking of climate change solutions in terms of cost-effectiveness will change over time, as low-hanging fruit is exhausted and technological innovation continues to increase the economic competitiveness of currently high-cost solutions. In the near term, anti-deforestation is a particularly salient mitigation approach since emissions from deforestation are irreversible. Implementation is immediately actionable (with several promising outlets for funding) andcost-effective compared to direct air capture, another popular carbon removal approach. Moreover, we would not expect market forces alone to slow deforestation in the coming decades.
REDD+ credits accounted for about 80% of forest and land-use related voluntary carbon offsets in 2019. There is still substantial room for more funding in this space, in the high tens to low hundreds of billions of dollars annually over the next decade.
The three core issues facing REDD+ are additionality, permanence, and leakage.
Our rough cost-effectiveness estimate adjusts WEF and McKinsey’s cost-effectiveness estimates to reflect findings from the literature regarding each of these issues.
Different carbon standards have varying ways to account for these problems, and ultimately REDD+ schemes may be somewhat higher quality than average due to strict requirements for measurement, reporting, and verification (MRV), and the need for certification.
With respect to MRV of emissions reductions, the primary issue appears to be the under-detection of forest degradation (e.g., selective tree cutting), an issue that appears surmountable with high-resolution satellite data.
We believe jurisdictional REDD+ — i.e., an emerging framework with consistent carbon baselines and crediting for all REDD+ projects within a given jurisdiction (e.g., a subnational region or a country) — is a promising intervention that can be high-impact and cost-effective, particularly if certain conditions are met. These conditions include:
Existence of a credible signal of sustained demand for high-quality credit supply
Incentives for effective government participation
Continued innovations and improvements in the development of market architecture, infrastructure, and financing
Establishment of a clear regulatory framework to align the market for forest credits with the goals of the Paris Agreement
We are not confident that recent advancements in REDD+ contracting will adequately address the issue of low credit prices, which have led to concerns about equity and incentive compatibility.
We lack a consensus framework to compare anti-deforestation with other potential charitable interventions. Without a comprehensive understanding of cost-effectiveness across climate interventions, it is impossible for us to say whether funding REDD+ is the most cost-effective climate intervention. Additionally, without a means by which to compare the impact of climate interventions with non-climate interventions in, say, global health or poverty reduction, it is highly difficult to incorporate the opportunity cost of funds toward REDD+. We hope to see progress along both of these dimensions in future research in the effective altruism community.
An introduction to REDD+
REDD+ is an international framework negotiated under the United Nations Framework Convention on Climate Change (UNFCCC) and endorsed in the Paris Agreement to include forest-related emissions in reaching global climate change mitigation goals, given forests’ important environmental role as carbon stores and sinks.[1] It is defined as “reducing emissions from deforestation and forest degradation in developing countries, and the role of conservative, sustainable management of forests and enhancement of forest carbon stocks” (UN-REDD Programme, 2016, p. 1).
REDD+ facilitates results-based payments following the payment for ecosystem services (PES) model. In the context of REDD+, the PES framework allows for money to flow from industrialized to developing countries in exchange for successful forest conservation — via public funds or carbon markets — that directly incentivize efforts to protect their forests. Payments are intended to compensate for the opportunity cost of not developing forest land for the production of agricultural and other commodities — such as beef, gold, soy, and palm oil — that drive deforestation.
According to an interview with Ruben Lubowski, co-founder of the Emergent Forest Finance Accelerator, chief carbon and environmental strategist at Lombard Odier Investment Management, and former chief natural resource economist at the Environmental Defense Fund (EDF), the largest current source of demand for REDD+ is the voluntary market. In turn, REDD+ credits accounted for about 80% of forest- and land-use-related voluntary carbon offsets in 2019 (Donofrio et al., 2020, p. 7). Other sources — such as the Carbon Offsetting and Reduction Scheme for International Aviation, the United Nations’ (UN) effort to ensure any growth in emissions after 2019 is offset elsewhere — may become important in the future, but currently account for only a small proportion of the carbon offsets (Prater, 2019).
To qualify for REDD+ participation, developing country participants must provide a reference emissions level (i.e., a baseline) against which to measure emissions reductions induced by REDD+; a measurement, reporting, and verification system to accurately assess forest cover change and associated emissions reductions; a national plan for reducing forest-related emissions; and a system for reporting on the implementation of measures to prevent environmental and social harm. “Readiness” funds are available to help developing countries meet these criteria and qualify for REDD+ payments (Forest Carbon Partnership Facility [FCPF], 2022; UNFCCC, 2015).
Conceptually, REDD+ addresses the equity issue that originally led to the exclusion of deforestation activity under the Kyoto Protocol — i.e., that industrialized nations had benefited economically from deforestation, so developing countries should be allowed to do so as well. However, issues of additionality (would the deforestation have been avoided anyway?), permanence (is the program effective at avoiding deforestation even beyond contract completion?), and leakage (did the program simply displace deforestation outside of the contracted area?) have continued to permeate discussions around REDD+ implementation.[2] REDD+ programs employ several forms of measurement, reporting, and verification (MRV) in an attempt to account for these concerns. Moreover, growing consensus around carbon standards and momentum toward jurisdictional REDD+ — an emerging framework characterized by consistent carbon baselines and crediting for all REDD+ projects within a given jurisdiction (e.g., a state or a country) — may also alleviate some of these pervasive issues that have consistently slowed progress. However, we are not confident that this recent progress addresses issues surrounding incentive compatibility and low prices for forest-related carbon credits.
We discuss the impact and pervasiveness of these issues and solutions in the section below on payments for ecosystem services, followed by an overview of jurisdictional REDD+ and some conditions for its success in overcoming them. Subsequently, we explore the literature on the cost-effectiveness of anti-deforestation interventions like REDD+. Based on our understanding of the issues and solutions we explore, we conclude with our best guess of cost-effectiveness, which ranges from $6 to $62 per tonne of CO2 (tCO2) abated with 80% confidence.
This range suggests that targeted funding — both to ensure that the conditions for the success of jurisdictional REDD+ are met and that sufficient funding is committed to pay forest owners for continuous certified emissions reductions in the coming decades — is a cost-effective climate change intervention relative to alternatives for which we have identified estimates. For instance, Giving Green (2022c) has recommended funding commitments to direct air capture (DAC) via the Frontier advanced market commitment; while Giving Green does not undertake its own cost-effectiveness analysis,[3] research suggests that DAC costs could drop to below $100/tCO2 (Service, 2018), and the United States Department of Energy has set a goal to reach $30/tCO2 (Ryser, 2020).
It is possible that advocacy is or has been more cost-effective than more direct implementation of greenhouse gas reduction strategies such as DAC or REDD+, though cost-effectiveness analyses to assess the impact of advocacy are extremely uncertain and often depend on political context. With Democrats having lost their majority in the House of Representatives this year, we believe that advocacy at the federal level is much less likely to remain as cost-effective as previous claims have suggested,[4] and we are currently unsure of the expected impact and cost-effectiveness of climate advocacy at the state level or outside of the United States.
Payments for ecosystem services programs appear effective but have important flaws
Given the findings of the sole randomized controlled trial (RCT) on a payment for ecosystem services (PES) program for reducing deforestation (i.e., 88% reduction in forest loss among enrollees relative to a control group) — in addition to our inclination to give significant weight to RCT evidence — our main takeaway from the academically published literature is that PES has very strong potential to significantly reduce deforestation if participation is sufficiently high (high confidence). However, we estimate with medium-high confidence that up to 40% of claimed emissions reductions may not be additional (that is, they may have happened in the absence of the intervention) and with low confidence that 20%-30% of emissions reductions may be impermanent. We do not believe that leakage will pose a major threat to the environmental integrity of future REDD+ programs, as we expect a successful and complete transition to jurisdictional REDD+ in the coming one to five years with medium-high confidence.
PES programs such as REDD+ involve results-based payments for environmental services
Payments for ecosystem (or environmental) services (PES) refers to “the voluntary payment by a (minimum one) buyer to a (minimum one) provider to ‘buy’ an environmental service (or a land use likely to secure that service), if and only if the provider secures the environmental service” (UN-REDD Programme, 2018). In other words, PES involves an agreement between two parties — a buyer and a seller of an environmental service, such as carbon sequestration — where the buyer offers to pay the seller an agreed amount of money conditional on the seller’s delivery of the environmental service during the contract term.
Our non-exhaustive reading of the academic literature leads us to believe (with 90% confidence) that the majority of forest-related PES programs have led to a decline in deforestation rates of 0%-55%, though the effect for those eligible for the REDD+ project who actually enroll can be much higher (up to about 90%).[5] We believe that the effectiveness of the program in reducing deforestation depends on the size of the incentive, ease of enrollment, and awareness and understanding of the program. Additionally, we emphasize that these results pertain to historical project-based REDD+ programs devoid of much of the (jurisdictional) REDD+ infrastructure and technology that have become available since the programs were undertaken, or that we might expect to become available in the coming years.
In addition to their potential for preventing deforestation, PES programs can also offer tangible benefits to communities on the ground. Financial flows from higher- to lower-income countries, where most of the low-cost anti-deforestation potential lies,[6] create further sustainable development opportunities (many embodied in the UN Sustainable Development Goals) while also addressing global inequalities.[7]
Academic research suggests PES is highly effective at reducing deforestation
The only randomized controlled trial of PES suggests that its effect on REDD+ enrollees is high (88% reduction in forest loss) but enrollment is low (32% enrolled), leading to an overall reduction in forest loss of 54%
A number of studies attempt to evaluate the effectiveness of PES in the context of avoiding deforestation and degradation, though we are only aware of one RCT that evaluates a “treatment” akin to a REDD+ incentive. Jayachandran et al. (2017) randomized a PES program at the village level across 121 villages (60 treated) in Uganda over a two-year period. The PES program offered 70,000 Ugandan shillings (about $28 in 2012 USD) per hectare of forest conservation[8] annually to participating households, who received payment at the end of each year. Of the 564 private forest owners (PFOs) in the treated villages, 180 (32%) enrolled in the program, an enrollment rate that the authors considered to be low given the lack of punishment for non-compliance once enrolled; however, an endline survey indicated that lack of awareness and enrollment logistics led to low enrollment, suggesting a role for higher investment in initiatives centered around education and awareness as well as attenuation of the hassle costs of enrolling. Of those who enrolled, 88% complied with the requirement to preserve the forest.
The results of the RCT suggest that treatment significantly reduced tree cover loss, with 9.1% loss in control villages compared to 4.2% loss in treated ones, indicating a sizable 4.9 percentage point treatment effect and a 54% reduction in tree cover loss. Payments to enrolled PFOs averaged $113, and they received 74% of payments for which they were eligible. According to the endline survey results, the PES program led treated households to increase patrolling and reduce others’ access (e.g., they had previously allowed other, likely poorer households to gather firewood or timber for building[9]). The authors perform a cost-benefit analysis, finding that program benefit-to-cost ratio ranges from 0.8 to 14.8 (2.4 in the base case), depending on the assumed rate of deforestation following the expiration of the PES contract (which they do not measure); the higher figure assumes permanent forest conservation and leads to an estimated cost per tCO2 of $2.60, whereas the lower figure leads to a cost per tCO2 of about $48.10.[10]
While PES thus seems highly cost-effective in reducing CO2 emissions, it is possible that unsatisfied demand from treated villages led to higher deforestation rates in control villages, which would bias the treatment effect. The authors claim that the small size of the trial limits such an effect in this case, though they still caution about such general equilibrium effects at scale. Additionally, the benefits measured in the study do not include co-benefits to, for example, biodiversity, or benefits from redistributing income from the global wealthy to the global poor.
Non-RCT research suggests that payments are effective at reducing tree cover loss (by 35%-50%), but warns of significant reversal upon discontinuation of payments
A number of studies use different approaches to estimate the effectiveness of PES schemes targeting deforestation and degradation. For instance, Roopsind et al. (2019) assess the effectiveness of the Norway-Guyana REDD+ program, which took place at the national jurisdictional level. They find that tree cover loss was 0.031 percentage points (35%) lower per year over the five-year project period than in a counterfactual produced using synthetic matching (i.e., creating a “no-intervention” scenario built based on weighted observations in similar nearby countries; see Figure 1, and see our section on leakage for methodological caveats). Given evidence of accelerated tree cover loss following the program, they recommend a regional REDD+ approach with continuous payments for forest protection.
Additionally, Simonet et al. (2019) conduct a difference-in-difference analysis of a REDD+ project in the Brazilian Amazon, identifying a reduction of 50% in the deforestation rate among participating farms,[11] reducing the amount of land allocated to grazing and having no impact on cropland. They estimate a cost of about $0.84/tCO2. Alix-Garcia et al. (2018), when evaluating a PES scheme in Mexico, find about a 40% reduction in deforestation rates.[12]
Figure 1: Observed gross tree cover loss for Guyana and for its synthetic counterfactual. From “Evidence that a national REDD+ program reduces tree cover loss and carbon emissions in a high forest cover, low deforestation country,” by A. Roopsind, B. Sohngen, and J. Brandt, 2019, Proceedings of the National Academy of Sciences, 116(49), p. 24495, (https://doi.org/10.1073/pnas.1904027116). Copyright 2019 by the authors.
Several meta-analyses attempt to summarize high-level implications and treatment effects from such site-specific research. Börner et al. (2020) identify 99 studies that report treatment effects (based on counterfactual methods) of various forest conservation mechanisms, ultimately deriving 136 comparable effect estimates from 51 papers. With caveats related primarily to small sample sizes and the importance of context, they find that “the protection of indigenous lands and incentive-based conservation tools, such as PES and [integrated conservation and development], range at the higher end of the effectiveness spectrum” (p. 59),[13] but generally conclude that the effectiveness of any intervention is moderate (p. 54).
Burivalova et al. (2019) — the first author of which helped to found an interactive platform to increase transparency around the effectiveness of anti-deforestation strategies (Mongabay and Burivalova, 2016) — echo concerns about the “inadequacy” of the scientific literature on the effectiveness of conservation strategies “due to poor design, lack of scope, and too few examples” (p. 1). Regarding PES, they find that all 17 data points are associated with either a decline or no significant change in deforestation, with quasi-experimental cases generally showing decline in forest loss and the only experimental case (i.e., Jayachandran et al., 2017) also associated with a decline in forest loss. They find similarly promising results for PES programs targeting water quality. Unfortunately, neither Börner et al. (2020) nor Burivalova et al. (2019) provide an effect-size estimate for percentage decline in forest loss.
In addition to the question of effectiveness, experts have highlighted three central concerns that plague PES schemes: additionality, permanence, and leakage. Various PES programs have found innovative methods to address each concern, with different levels of success. The following section explores the three issues in more detail and explains how PES programs address them.
We estimate with medium-high confidence that 60%-100% of reported emissions reductions are additional and would not have occurred without REDD+
In carrying out a PES program, one wants to ensure that emissions reductions from changes in forest-related activity have been the direct result of PES (that is, that the reductions would not have occurred in the absence of the program). A counterfactual assessment measures “additionality,” meaning the extent to which the program in question induced additional benefits beyond what otherwise would have occurred. Accounting for the various estimates we have come across in the literature, we estimate with medium-high confidence that 60%-100% of reported emissions reductions from future (jurisdictional) REDD+ projects will be genuinely additional.
Historical data and empirical evidence suggest that reference-level gaming has been a threat to additionality
The lack of a clear baseline of previous or counterfactual deforestation against which to measure program impacts — along with the perverse incentive of participating countries to exaggerate baseline emissions from deforestation to increase revenues from PES schemes — means it is extremely difficult to be confident in programs’ additionality. Many PES schemes rely on setting an initial reference level (RL), known in the context of REDD+ as a forest reference emissions level (FREL). This level is set by choosing a “typical” period of forest emissions against which to compare future emissions levels. As one might expect, the decision is fraught:
The exercise of setting an RL is by nature a hypothetical one: what would the state of deforestation and forest degradation – and resulting emissions – be in the absence of REDD+? Deforestation rates typically vary from year to year, adding noise to the data. At low rates, deforestation, forest degradation, and forest regrowth can be hard to detect and monitor. Equally, there is no scientific consensus on the most appropriate methodology, on which factors to include in the estimation of RLs, or on the time period for which to calculate historical deforestation (or emissions). (Angelsen et al., 2018, p. 49)
Incentives to “game the system” are evident when comparing countries’ claims to different programs with varying standards. Angelsen et al. (2018) express further concern about this dynamic:
RLs may also be candidates for gaming [i.e., manipulation and misrepresentation of emissions data to increase PES revenues]. The time period, definitions and statistical approaches for estimating historical emissions vary in the UNFCCC submissions, and this may greatly affect the actual RL – and hence the estimated emissions reduction. There are few formal checks and balances in place to avoid inflated RLs. Country submissions are subject to a technical assessment by UNFCCC. … While there may be good reasons for this consensus approach, it also limits the scope for critical assessment to detect systematic biases across submissions. (p. 50)
A useful example to illustrate this dynamic is Brazil, which experienced high rates of deforestation until the mid-2000s. For the Amazon Fund, which is overwhelmingly funded by the Norwegian government, the starting year used to calculate Brazil’s RL — a 10-year average updated every five years — is flexible and changing over time, to reflect a continuously updating counterfactual (Amazon Fund, 2018). Brazil would have claimed credit for 4 GtCO2 or $21.5 billion worth of avoided emissions from 2006 to 2016 under this reference level. However, Brazil has retained autonomy to set its own reference level as reported to UNFCCC. By fixing its FREL in the higher-emission year of 1996 rather than in 2006,[14] Brazil added an extra 3 GtCO2 of claimed avoided emissions from 2006 to 2016, which would indicate that Brazil received $36 billion in payments, perhaps half of which rewarded Brazil for maintaining forests that may not have been in serious danger of deforestation during the period in question. Thus, Brazil may have received payments for benefits that were not the direct result of the REDD+ program.
Even if we assume the Amazon Fund reference level of 2006 was correct (though we assume it is likely also overstated), 43% of Brazil’s official emissions reductions reported to the UNFCCC were not additional in this case. Still worse, using the synthetic control method to account for “the effects of contemporaneous drivers of deforestation, including agricultural commodity prices, currency exchange rates, and environmental regulations,” West et al. (2020) find effectively no evidence of additional emissions reductions in about 10 voluntary REDD+ projects from 2008 to 2014 in Brazil (p. 24190).[15]
Similarly, Peru — whose deforestation rate has trended upward since the early 2000s — submitted an FREL extrapolating the trend so that the baseline in 2020 is 20% above 2015 deforestation levels. Such extrapolation may be valid, though it presents an issue when such trends are used to a country’s advantage when they are increasing, and not similarly accounted for when they are declining (Angelsen et al., 2018, p. 46).
According to a recent Washington Post investigation, Malaysia claims in its Biennial Update Report to the UNFCCC that its trees absorb carbon 4x faster than those in similar forests in neighboring Indonesia, allowing it to reduce its stated CO2 emissions by 73% (Mooney et al., 2021). The journalists estimate that the gap in actual versus reported emissions globally ranges from 8.5 to as high as 13.3 GtCO2 a year (the latter constituting 23% of total anthropogenic emissions), with 59% of the gap attributable to land use (including forests).[16] In line with these findings, researchers found that 37% of 120 early REDD+ projects they investigated overlapped with protected areas (Simonet et al., 2015). Given these findings, along with the claim that some of the discrepancy seems intentional and others may be due to inadequate technical capacity, it seems likely that reference emissions levels are poorly measured and err on the side of overreporting reference emissions.
Unfortunately, gaming also appears to have occurred in parts of the world where technical capacity is high. For example, several major corporations (JPMorgan Chase & Co., the Walt Disney Company, and BlackRock) purchased land in the US Northeast to offset the carbon emissions from their operations, facilitated by the Nature Conservancy (which receives a 40% cut of these contracts and claims to have been following American Carbon Registry rules):
The additional revenue from the carbon-offset program helps [the Hawk Mountain Sanctuary] take better care of the land, plant more saplings, and improve the forest’s health, [Hawk Mountain’s director of conservation science, Laurie] Goodrich says. She says her understanding is that these incremental improvements generate the carbon credits. That’s not the case: The project documents show almost all of the credits come from the assumption that the land would have been heavily harvested. Goodrich says Hawk Mountain had no intention to cut down most of its trees; that runs counter to their mission, and the sanctuary already had a management plan in place that protects the trees. “We’d still be managing the land the same way,” without carbon payments, she says. (Elgin, 2020)
A similar issue emerged in the case of California forest carbon offsets, which are eligible for compliance under its cap-and-trade program (Badgley et al., 2022). The authors find evidence of 29.4% (20.1%-37.8%) over-crediting, equivalent to 30 million tonnes of CO2 (MtCO2) valued at $410 million. The validation of such additionality concerns in contexts with seemingly high technical capacity and desired environmental integrity exacerbates concerns about additionality in REDD+ programs, where technical capacity and concern for environmental outcomes may be lower.
Gaming aside, accurately assessing counterfactual emissions can be both practically and methodologically difficult, though experimental evidence and recent REDD+ advancements leave us optimistic
The issue of additionality creates methodological difficulties for non-RCT studies, such as the synthetic control study of Roopsind et al. (2019). Here, the low number of valid synthetic control countries (i.e., the very limited sample size) means that the probability of observing a 35% reduction from 2010 to 2015, as they do, is 60% “by chance alone” (p. 24493). The same probability for the years with the highest treatment effect (2014-2015) is 25%.[17] Additionally, Burivalova et al. (2019) cite several studies (which we have not evaluated) identifying low additionality due to the difficulty or social undesirability of targeting deforestation “offenders.”[18]
Crucially (in our view), Jayachandran et al. (2017) — the sole RCT study — find no evidence of non-additionality. Non-additionality would imply that private forest owners with low deforestation rates at baseline would enroll at higher rates than forest owners with high deforestation rates at baseline; however, they find that there is no association between pre-trial deforestation levels and program enrollment.[19] This evidence — combined with our general takeaway from conversations with experts in the field regarding the move toward better practices, technologies, and institutions for regulating REDD+ — leaves us optimistic about the additionality of REDD+ programs in the future.
Based on the evidence reviewed in this section, and the weight we are inclined to give to high-quality causal evidence from RCTs, our best-guess 80% CI accounting for the various estimates we’ve come across would be that 0%-40% of the conservation claimed under future high-quality[20] jurisdictional REDD+ projects will not be additional (i.e., 60%-100% will be additional).
A potential solution to non-additionality has been suggested by Nomura et al. (2019) — “production of an independent reference level, based on general assumptions, and encouraging countries to justify why their baseline differs from it significantly” (p. 13) — that we agree seems like a reasonable idea to reduce the likelihood of gaming.[21] At the very least, and in the case of countries’ using historical trends to identify baselines, we agree with West et al. (2020) that baselines against which historical trends are assessed should be updated more frequently than every 10 years, and that different approaches to baselining should be assessed to identify the (combination of) method(s) for establishing counterfactual emissions with the highest social and environmental integrity (p. 24192).
We estimate with low confidence that 70%-80% of quality-certified emissions reductions from REDD+ are permanent
The issue of impermanence, i.e., the possibility of reversal during or at the end of a carbon crediting period, has similarly plagued anti-deforestation initiatives. For instance, a majority of the benefits of paying for a forest to remain intact — keeping its stored carbon from entering the atmosphere and potentially also acting as an active carbon sink — may be lost if the forest is cleared once the credit expires, or once payments cease. We assume a high likelihood of reversal in the absence of robust safeguards to ensure permanence after contract expiration, and we believe with low confidence (based on limited empirical evidence) that existing standards that aim to ensure permanence (and to insure against impermanence) for up to 100 years will be 70%-80% effective based on the additional credits banked to address permanence by Verra, ART TREES, and Gold Standard.
Reversal may occur due to natural events such as pest infestation, fire, or frost damage (with possibly temporary or short-term impacts, e.g., if the forest recovers), or drought, stand replacing forest fires, and disease outbreaks (with longer term impacts, e.g., if the forest does not recover or it can no longer store as much carbon). Man-made threats of reversal, such as intentional forest burning or clearcutting, may be influenced by policy instability. For instance, under Jair Bolsonaro’s leadership and outspoken support for agribusiness, Brazil closed down two climate change divisions and cut the budget for Brazil’s top environmental enforcement agency by a quarter. These moves removed barriers for aligned state governments to pursue expansion of soy and cattle farming in deforestation-prone regions (Song, 2019).
Unfortunately, Jayachandran et al. (2017) do not measure the persistence of their treatment effects and instead make a series of assumptions around permanence in their cost-benefit analysis. Roopsind et al. (2019) find that tree cover loss increased by 200% — from 0.069% to 0.140%, equivalent to the level of Guyana’s synthetic counterfactual — in 2016, following the end of the Norway-Guyana REDD+ program. Moreover, tree cover loss exceeded the 0.1% threshold, above which Guyana would have received no payments, for two years following the program, holding implications for the program’s cost-effectiveness:
Based on assumed payments of US $250 million, the cost of the 12.8 million [metric] tons of avoided CO2 emissions is US $19.53 per ton of CO2. If these emission reductions are permanent, then this is the effective cost per ton of CO2. However, if this emission is only avoided for 5 years, then the rental rate at a 5% discount rate is US $4.50 per ton of CO2 per year, and the effective cost of carbon is around US $90 per ton of CO2. (Roopsind et al., 2019, p. 24497)
In line with Roopsind et al. (2019), we would generally assume over a relatively short time horizon (perhaps 0-25 years) that avoided deforestation is completely and quickly reversed in the absence of continued PES payments, and that forest clearing returns to levels closer to pre-contract rates. Thus we strongly recommend continuing results-based payments for the desired duration of emissions reductions and updating the price paid over time to account for updates to opportunity costs (e.g., the opportunity costs to PFOs may decline as countries develop, identify alternative forest uses, or create protected areas).
Song’s (2019) investigation for ProPublica also highlights the risk of reversion to baseline levels of deforestation:
I looked at projects going back two decades and spanning the globe and pulled together findings from academic researchers in far-flung forest villages, studies published in obscure journals, foreign government reports and dense technical documents. I enlisted a satellite imagery analysis firm to see how much of the forest remained in a preservation project that started selling credits in 2013. Four years later, only half the project areas were forested. In case after case, I found that carbon credits hadn’t offset the amount of pollution they were supposed to, or they had brought gains that were quickly reversed or that couldn’t be accurately measured to begin with. Ultimately, the polluters got a guilt-free pass to keep emitting CO2, but the forest preservation that was supposed to balance the ledger either never came or didn’t last.
Recent years have seen significant progress in the development and refinement of carbon standards, and how permanence will be addressed in future REDD+ projects will depend on the carbon standard governing the project (Carvalho and Álvarez Campo, 2022). For instance, the American Carbon Registry (2018) requires the use of an approved risk analysis tool to account for general and project-specific risks, with options to mitigate the risk in the form of a buffer or through an insurance product (pp. 19-21).[22] For credits issued by Architecture for REDD+ Transactions (ART), each project makes an annual contribution of 5%-25% of credits to ART’s combined buffer pool depending on the number of risk mitigation factors applied; participants must then report annual emissions after years one, three, and five of the “crediting period” and if emissions exceed the crediting level, an equivalent number of credits from the buffer pool are retired and the annual buffer increases by 5% for the following five years (ART, 2021, pp. 42-43).
Gold Standard and Verra (the largest issuer of REDD+ and forestry credits) have up to 21- and 100-year permanence requirements, respectively, and set aside a percentage of issued emissions reductions[23] — 20% for Gold Standard and a variable percentage for Verra,[24] depending on the project risk as assessed by its AFOLU risk tool — to address the risk of early reversal(Gold Standard, 2015; Verra, 2019). That is, if carbon is “known, or believed, to be lost,” these excess credits are canceled, negating the need for projects that experience reversal to pay credits back to the issuer (Verra, 2022, p. 6). Our sense from our conversation with Maria Carvalho, former head of public affairs at the South Pole Group, is that the Verra standards are among the most robust.[25]We believe with low confidence (based on limited empirical evidence) that such standards that aim to ensure permanence (and to insure against impermanence) for up to 100 years will be 70%-80% effective based on the buffer pool approaches of ART TREES, Gold Standard, and Verra.
In our interview, Carvalho provided an insightful reminder that anti-deforestation is not unique in confronting issues around permanence: “ascertaining permanence for any carbon removal project is difficult; even [direct air capture] removals need a lot of measurement, reporting, and verification to show permanence.” We agree with Carvalho’s recommendation that further academic research should more rigorously investigate the questions of permanence and reversal. In the meantime, we would recommend continuous payments unless and until the economic benefit of the standing forest exceeds its opportunity cost.[26]
One alternative approach to addressing permanence concerns, known as tonne-year accounting, considers temporary carbon storage to be equivalent to avoiding some amount of CO2 emissions altogether. In particular, the technique equates briefly storing a larger amount of CO2 with permanently storing a smaller amount of CO2 by assuming an accounting time horizon beyond which costs and benefits are ignored (Chay, Badgley, et al., 2022). Temporary carbon storage becomes more valuable the shorter the assumed time horizon of relevant costs and benefits, leading to differences in valuation depending on the selected time horizon.
In part because the choice of accounting time horizon is “intrinsically subjective” (Levasseur et al., 2012, p. 6), tonne-year accounting has stirred controversy. For example, Verra declined to include tonne-year accounting in its Verified Carbon Standard following public consultations (Hestad, 2022). In an email exchange, Dan Stein of Giving Green also indicated skepticism of the technique, directing us to CarbonPlan’s explainer (Chay, Badgley, et al., 2022). In a post summarizing comment letters submitted to Verra during the consultations, CarbonPlan claims that tonne-year accounting ignores planetary temperature outcomes and can be used to legitimate ongoing emissions, and that it also introduces perverse incentives that induce further additionality challenges (Chay, Cullenward, and Badgley, 2022).
On the other hand, Natural Carbon Exchange (NCX) — which offers PES forestry schemes with tonne-year accounting — has alleged that many critics of the technique simply fear disruption to the traditional business model of carbon credits (Meyer, 2022). NCX’s CEO has also expressed skepticism of the industry’s ability to assure permanence in general (Parisa, 2022). We have not determined whether the technique is employed by PES projects other than NCX, nor whether it should be considered viable for addressing permanence concerns.
While leakage has historically been problematic, we do not believe that leakage will remain a cause for concern for future (jurisdictional) REDD+ projects
Another potential problem is leakage, which refers to the “unexpected loss of anticipated carbon benefits due to the displacement of activities in the project area to areas outside the project, resulting in carbon emissions … negat[ing] some or all of the carbon benefits generated by a project” (UN-REDD Programme, 2018). In other words, it describes the risk that payments to protect forests will lead to spillover of deforestation activity outside of the areas designated for protection. Given the findings of Jayachandran et al. (2017) and Simonet et al. (2019) as well as our recommendation to direct funds only toward increasingly dominant[27]jurisdictional REDD+ programs (which we believe will perform particularly well on preventing leakage), we do not believe that leakage will present a major consideration for cost-effectiveness, particularly if surrounding countries have their own jurisdictional REDD+ programs. Assuming this is the case, we would encourage donors to consider contributing to REDD+ projects and/or capacity building opportunities that broaden the regional scale of robust program coverage to leverage leakage reduction impacts in nearby jurisdictions.
The ProPublica investigation identified a report by the Office of the Auditor General of Norway (2018) — the world’s largest REDD+ funder, accounting for about half of all funding — that highlights leakage risks:
Despite a decade’s work and $3 billion, results were “delayed and uncertain,” the science of measuring carbon was only “partially in place” and there was “considerable” risk of what’s called “leakage” — when protecting one patch of land leads to deforestation somewhere else. That problem alone creates “considerable uncertainty over the climatic impact,” the report concluded. (Song, 2019)
In the studies we examined previously, leakage was either non-existent or unobservable. Jayachandran et al. (2017) look at leakage from a number of angles — spillovers within a treated village, into control villages or government forest reserves, and at the margins of PFOs’ land — and do not find evidence of leakage. Simonet et al. (2019) also do not find evidence of within-community leakage.
Roopsind et al. (2019) warn that leakage is a major concern in their context, since Guyana and Suriname — the closest synthetic match given its close proximity, ecological and geological similarity, and economic dependence on gold mining — share a “porous” border as well as close socioeconomic ties, including trade. The authors conclude that detecting leakage in their case would “require more in-depth economic analysis that focuses on transboundary investment flows, labor, and market effects, especially those related to the demand and supply of gold and policies implemented by other countries” (p. 24496). While they find evidence of “coarse increases” in tree cover loss on both Suriname’s interior and its border with Guyana, the concurrent increase in gold prices makes it difficult to isolate the real drivers. Critically, if leakage from Guyana to Suriname did occur owing to REDD+, the results of the synthetic matching approach would be biased toward overestimating the effect of the program.
REDD+ programs include some methods to address PES issues, but more progress is needed
REDD+ measurement, reporting, and verification (MRV) standards are thorough but not yet sufficient to adequately account for forest degradation
The UN REDD+ measurement, reporting, and verification (MRV) process consists of two steps. In the first step, countries submit a FREL[28] delineating annual tonnes of CO2 for a reference period that they select, which then undergoes a third-party technical evaluation.[29] Second, countries submit a comparison of measured results to the FREL in their biennial update reports, and these results undergo another expert technical analysis.
According to the FCPF (2022), measurement combines two types of data: activity data, or information on the magnitude of carbon emissions- or removal-relevant human activity, and emissions factor data, or coefficients that translate activity data into tCO2 per unit of land area. Measurement of five carbon pools — “above-ground biomass, below-ground biomass, deadwood, litter, and soil organic carbon” — takes place using three primary sources of information. First, satellite land monitoring systems capture activity data, i.e., the extent of human-caused deforestation and degradation. Second, forest inventories contain global, national, regional, or local information on relevant carbon stocks, allowing for the conversion of activity data to measure impact via emission factors. Integration models — ranging from basic spreadsheets to custom tools applying complex spatial models — combine data from satellites and on-the-ground observations to measure emissions for a given region, and uncertainty analyses account for systematic and random error.
Reporting requires compiling comprehensive data and information to make the measurement step transparent and available in a standardized format. It must include forest-related data, greenhouse gas emissions and removal estimates, a description of methods for measurement and activities undertaken to fulfill its REDD+ commitments, quality assurance and quality control checks, and uncertainty estimates. Data are stored in a harmonized REDD+ database (FCPF, 2022).
Finally, verification entails a technical assessment of the FREL, and biennial reports are scrutinized via both a technical analysis of activities, methods, assumptions, and emissions impacts and sharing of international views among government agencies, institutions, communities, and NGOs. The process may include, for example, interviews with select government officials and national NGOs, assessment of (media) reports and training materials, and making data available to several institutions and civil society for scrutiny (UN-REDD Programme, 2011). Participating countries also undergo a Country Needs Assessment to identify areas (financial, technical, institutional) where countries could use further MRV assistance (FCPF, 2022).
The main issue with MRV that we came across in our research appears to be the underdetection of forest degradation, which refers to the reduction of forest conditions below natural capacity without reducing tree cover by more than 10% (which would then be classified as deforestation), for instance through selective tree cutting.
Jayachandran et al. (2017) use a commercial satellite (QuickBird) that captures high-resolution data. They claim its use led to higher estimated forest loss in control villages than most other estimates of the Ugandan deforestation rate, because the high resolution allowed them to measure selective tree cutting (i.e., forest degradation). The qualitative findings of Duchelle et al. (2018) also suggest that high-resolution data capture is important for accurate measurement: “Of the four studies … three case reports highlighted that — despite mixed outcomes — carbon effectiveness of REDD+ projects was limited by not adequately addressing drivers of degradation or mitigation dimensions more broadly than simply carbon losses in forests” (p. 137).
Song (2019) highlights the growing importance of measuring degradation for environmental integrity and corroborates the difficulty of measurement in the context of the California Tropical Forest Standard that made forest offsets eligible in the state’s cap-and-trade system beginning in 2019:
Keeping track of trees is essential. For the REDD programs, Brazil has relied on a satellite program that tracks large-scale tree loss, starting at chunks the size of about 10 city blocks. But there’s emerging evidence that landowners are clear-cutting smaller areas to escape detection. It doesn’t account for degradation, the thinning of trees from wildfires and logging; a major study found this cut the Amazon’s carbon content by an average of 55%. Luiz Aragão, who heads the remote sensing division at Brazil’s National Institute for Space Research, said wildfires alone can change the numbers by 30%, and scientists are just beginning to understand how they create lasting damage.
Song (2019) also expressed concerns about tracking and measuring degradation, which can be difficult, particularly because the Tropical Forest Standard does not require reporting at the same level as it does for deforestation:
The [Tropical Forest S]tandard requires programs to exceed protections in existing policies and to show a drastic reduction in deforestation … but it doesn’t make countries report degradation, potentially leaving out a huge chunk of the emissions. Jason Gray, chief of the board’s cap-and-trade program, said degradation is hard to measure, but the standard will incentivize better monitoring so countries can add the data later. “If we wait to have the perfect information,” he said, “it might be too late.”
While we have not come across research that informs our expectations regarding the exact extent to which MRV overlooks emissions (reductions), we are optimistic that — with a sufficiently significant demand signal for certified REDD+ credits — technological improvements in satellite detection and movements toward corroborating satellite data with on-the-ground data will attenuate MRV issues in the coming decade. Nevertheless, we assume that 5% of emissions go undetected, particularly from unmeasured degradation, due to MRV shortcomings.
Increasing REDD+ incentives would likely improve equity and effectiveness, with unknown implications for impact and cost-effectiveness
The effectiveness of PES programs depends on whether local actors are sufficiently incentivized to follow through with conservation actions. It is therefore important to consider whether the effective carbon prices paid through REDD+ programs are high enough to guarantee real changes in outcomes on the ground.
Poverty can be a key driver of forest clearing and degradation, as people seek to monetize the natural resources afforded by the forests in order to pursue higher living standards (Miyamoto, 2020; Bostwick, 2019).[30] Individuals or communities might choose to convert forested areas to cleared land for cattle grazing, as is often the case in the Amazon (Kröger, 2019). They may also choose to plant lucrative crops such as oil palm trees (Austin et al., 2019).
Albani et al. (2012) calculated the opportunity cost of forest conservation at a net present value of $5,000-$17,000 per hectare for palm oil plantations, and even more for high-value mineral resources like gold or petroleum (p. 87).[31] By contrast, they find that the contemporaneous payment for REDD+ credits would be about $2,750 per hectare. Similarly, Busch and Engelmann (2016) found that the average cost of anti-deforestation projects to land users is $9/tCO2 and $21/tCO2 under a $20/tCO2 and $50/tCO2 carbon price (respectively), with these average costs increasing as the options with the lowest marginal cost are exhausted (p. 17).
In all of these cases, the opportunity cost of preserving forests can be quite steep. According to Sanjay Joshi (Joshi, 2019),[32] McKinsey has asserted that REDD+ payments could cover at most 25% of total costs of conservation. Other organizations argue that McKinsey ignores certain costs in their calculations, implying that the real coverage of REDD+ payments might be even lower (e.g., Dyer and Counsell, 2010).
If REDD+ programs are effective in averting deforestation, then one should consider the remaining costs as being borne by local communities,[33] which are much less wealthy on average than the developed-nation clients that purchase credits. That is, one should consider both the total costs of conservation as well as relevant equity concerns.
On the other hand, it is possible that some REDD+ programs prove ineffective due to insufficient incentives for local actors to preserve forests. As it stands, it appears that local interests may be able to supplement the value of REDD+ credits. The case of Mato Grosso, discussed in the below section on jurisdictional REDD+, exemplifies this dynamic.
We would benefit from exposure to new or existing research regarding the impact of incentive size on emissions reductions, and from learning more about how incentive levels are determined. This information would help us to understand the implications of funding REDD+ from both ethical and effectiveness standpoints, as well as to consider whether funds could be allocated to advocate fairer incentives. Stronger incentives have ambiguous implications for cost-effectiveness in terms of dollars per tCO2.All else equal, stronger incentives increase program costs, while, on the other hand, stronger incentives could lead to disproportionately higher effectiveness and therefore lower cost per ton abated. Additionally, stronger incentives would likely improve social benefits along other dimensions, leaving us with significant uncertainty regarding the size and direction of potential changes to the intervention’s cost-effectiveness both per tCO2 and per unit of overall social impact.
Aligning incentives by improving carbon pricing is promising
The low and inconsistently applied price of carbon is a key reason that incentives have been poorly aligned in past projects. A recent report suggests that in order to achieve the goals of the Paris Agreement, a global price of $50-$100/tCO2 would be necessary to align incentives (Forest Trends’ Ecosystem Marketplace, 2021, p. 4). Busch and Engelmann (2016) estimated “that a universally applied carbon price of $20/tCO2 from 2016-2050 would avoid 41 GtCO2 of emissions from tropical deforestation while a carbon price of $50/tCO2 would avoid 77 GtCO2” (p. 26, Table 3).
In 2021, REDD+ credits were selling for about $4-$5/tCO2, depending on whether they transact in voluntary or compliance markets (Trove Research and University College London [UCL], 2021, p. 45). Experts agree that the current prices of forestry credits are currently much too low, undermining incentive compatibility for locals, failing to cover opportunity costs, and reducing the average quality of credits on offer (Warren et al., 2018; Person, 2021).
According to Trove Research and UCL (2021), current carbon offset prices are artificially low due to an excess supply of credits on the market (p. 45). About 1 GtCO2 was on sale in voluntary carbon markets in 2021, with annual supply outpacing annual demand by 7x-8x (Jennifer L, 2022). This excess is a result of issues around the environmental integrity of earlier offsets — both leading to inflated supply of (potentially non-additional) offsets and, relatedly, reduced demand for them.
A private donor may be able to raise the market price of carbon offsets by increasing demand for credits, possibly by making private purchases on voluntary markets. Trove Research and UCL (2021) estimate that clearing the aforementioned excess offsets from the market would increase the price of offsets from $4-$5/tCO2 to $10-$15/tCO2 (p. 45).
In addition to raising the market price of offsets, purchasing excess offsets on the voluntary market with a sustained commitment to continue purchasing over the coming decade would help to send a signal to the market that carbon offset demand is on the rise, spurring new projects to supply higher-cost but higher-quality carbon offsets.[34] Companies that buy cheap offsets currently run the risk of greenwashing accusations, since offsets characterized by environmental integrity would cost much more than the offsets’ current low prices. Philanthropic efforts could plausibly improve the average quality of carbon offsets by offering an effective price floor.
However, we are unsure whether doing so would also signal demand for offsets with questionable environmental integrity. A philanthropist may therefore consider placing conditionality on the purchase of future REDD+ carbon credits based on quality criteria (e.g., a particular certification).
Jurisdictional REDD+ is a promising anti-deforestation intervention
Jurisdictional REDD+ is “an accounting framework that establishes consistent baselines and carbon crediting approaches across forest projects within a jurisdiction (e.g., state or country)” (Giving Green, 2022b), as opposed to standalone REDD+ projects that operate under project-specific contracts and arrangements.
As such, jurisdictional REDD+ increases the scale of coverage of the REDD+ program, minimizing the risk of leakage from one jurisdiction to contiguous participating jurisdictions, and allows for sharing of risks of impermanence across projects within a jurisdiction. Moreover, reference levels over larger areas are less likely to lead to inflated estimates of emissions reductions — in part due to fewer opportunities for project developers to self-select into areas where baselines are favorable — and there may be more localized benefits to human welfare if particular stakeholders (e.g., Indigenous peoples and local communities) are involved in the distribution of benefits. However, the success of jurisdictional REDD+ hinges on several conditions, including, though not limited to, the existence of robust systems to facilitate MRV across scales, credible and sustained demand for credits, and market development to facilitate trading. Philanthropic funding could play several roles in catalyzing early-stage development of the jurisdictional approach, for example, by creating or expressing demand for the resulting forest carbon credits or providing risk-neutral financing opportunities. If the conditions are met, we have high confidence that jurisdictional REDD+ will represent the anti-deforestation approach with the highest impact, and the highest impact per dollar.
By increasing the scale of REDD+ coverage, jurisdictional REDD+ will likely help to overcome concerns of leakage, additionality, and permanence, while extending program benefits to Indigenous peoples and local communities
Jurisdictional REDD+ and project-based REDD+ are separated by a thin and often blurred line. Project-based approaches may be absorbed into jurisdictional approaches through “nesting” to align project-level approaches at any scale with jurisdictional baselines, MRV strategies, emissions reduction estimates, and accounting methods, in order to avoid double counting emissions reductions. Additionally, advocates of jurisdictional REDD+ (of which there appear to be few to no opponents) claim that the jurisdictional approach largely remedies leakage issues since measurement takes place on a larger scale thereby incentivizing enforcement against geographically proximate deforestation. It also attenuates the risk of impermanence associated with carbon credits since these risks can be pooled across projects in a jurisdiction (Emergent, 2021b, p. 10).
Proponents also claim that jurisdictional REDD+ encourages and supports government-led REDD+ programs and provides transparency and robustness of emissions reductions estimates relative to a common baseline, which can facilitate their incorporation into emerging carbon exchange mechanisms. A draft consensus statement by eight organizations describes the benefits of jurisdictional REDD+ as follows:
Jurisdictional-scale crediting has the potential to incentivize governments to take the decisions and perform the actions that only they have the authority to implement. This includes actions such as policy reform; recognition of [Indigenous peoples’] and [local communities’] rights and full and effective participation; and enforcement of the law. All of these are necessary to end tropical deforestation at scale. Scale can be an important determinant of the environmental integrity of carbon credits regardless of sector, with larger-scale programs better positioned to mitigate risks of leakage, non-additionality, and impermanence compared to stand-alone projects. For example, reference levels based on the recent historical deforestation rates of large areas are less likely to overestimate net emissions reductions, suggesting that forest carbon crediting based on performance measured at the scale of large jurisdictions can help ensure high quality credits. Furthermore, the inclusion of Indigenous territories and the full and effective participation of [Indigenous peoples] and [local communities] in jurisdictional programs have the potential to extend benefits to more communities, including for the conservation of carbon stocks. Therefore, we believe that a rapid transition to jurisdictional-scale crediting for forest-based emissions reductions and removals, including fully nested projects, can help to ensure there is a robust pipeline of high-quality tropical forest carbon credits. (Coordinating Committee of Indigenous Organizations of the Amazon Basin et al., 2021, pp. 7-8; see also Seymour, 2019; Emergent, 2021b)
We agree that jurisdictional REDD+ approaches represent the most viable path forward for carbon credits with social and environmental integrity. While jurisdictional REDD+ credits are not yet available in the market, our take — based on conversations with experts and our reading of the literature — is not only that they will become available soon (with high likelihood), but that they will come to dominate the market for REDD+ credits over the coming five years (with moderately high likelihood). Several comprehensive carbon accounting and crediting platforms have already been established and gained acceptance into important voluntary and compliance markets. For instance, Verra’s Jurisdictional and Nested REDD+ accounting and verification framework, first released in 2012, and ART’s The REDD+ Environmental Excellence Standard (TREES) have both been accepted into the Carbon Offsetting and Reduction Scheme for International Aviation (CORSIA) market (Verra, 2020b; ART, 2022).[35]
Moreover, public sector funding, which has primarily targeted REDD+ readiness programs to date, is increasingly giving way to results-based payments. These funding trends, along with increasing literature and dialogue around the benefits of jurisdictional REDD+ and the development of relevant infrastructure and standards, leads us to believe that credits from standalone projects will not reach market acceptance without nesting into their respective jurisdictions in the future.
Finally, coordinated public-private investments in jurisdictional credits are on the horizon and are likely to replace private sector-funded supply of forest credits from individual projects. On Earth Day 2021, the Lowering Emissions by Accelerating Forest Finance (LEAF) Coalition — representing the US, UK, and Norwegian governments along with several multinational companies — committed an initial $1 billion to buy 100 MtCO2 equivalent of jurisdictional REDD+ credits for a minimum $10/tCO2, which will be coordinated by Emergent and use its platform to generate supply credits compliant with TREES (Forest Trends’ Ecosystem Marketplace, 2021, pp. 3-6).
When asked about the biggest opportunities for philanthropic funding in the context of nature-based solutions, Lubowski (co-founder of Emergent) responded that anti-deforestation is unequivocally the most important nature-based solution, and that he avidly supports the jurisdictional approach. He claimed that there is “a fair amount of evidence in favor” of the jurisdictional approach, but that it has generally moved more slowly than desired in many respects, which he attributes at least in part to lack of resources and effort. He recommends mobilizing funds to commit to pay for jurisdictional REDD+ results to activate the market and to help jurisdictions access the resources necessary to achieve those results, with actionable opportunities available through the Climate and Land Use Alliance (CLUA; see also CLUA, 2021).
MRV coordination across scales will prove challenging
The importance of logistical challenges remains to be determined as jurisdictional REDD+ gains ground. First, there are issues of coordinating the carbon stock measurement at larger scales:
From a carbon-accounting perspective, the biggest challenge is getting enough random samples over a long enough period of time to offer carbon-stock estimates that are 95 percent certain, which is what the Intergovernmental Panel on Climate Change (IPCC) recommends. That can be costly, because, despite all the advances in satellite and even drone technology, it still requires sending teams out into the forest with tape-measures. Then someone in the jurisdiction – usually in the forestry department – has to blend those findings with satellite images going back decades to document the jurisdiction’s land-use change over time – how much forest has been converted to field and then to farm, and sometimes back again. Once a jurisdiction has this, it’s actually more straightforward to establish a reference level for an entire jurisdiction than it is for a small patch of land. … That’s because things average out over a large scale, so a jurisdiction can use its prevailing rates of deforestation as its reference level. (Zwick et al., 2015)
Relatedly, MRV must be coordinated to ensure that sub-national systems are aligned with the national system when nested REDD+ programs exist (FCPF, 2022). Additionally, complexities may arise in harmonizing estimated emissions reductions across carbon markets and accounting methods:
Critical barriers linked to diverse, multi-activity and multi-stakeholder environments remain to which solutions are still needed. … Avoiding double counting between different markets and accounting systems (e.g., carbon markets, [nationally determined contributions], corporate supply chain, emerging systems like CORSIA) must be addressed, e.g., by applying corresponding adjustments (aligned with Paris Agreement Article 6) to ensure that a mitigation unit (i.e., a [greenhouse gas] emissions reduction or removal) is only counted once across all market and systems. (Gehrig-Fasel et al., 2021)
Nevertheless, we believe that jurisdictional REDD+ is the best path forward and are optimistic that these issues can be overcome with sufficient momentum and resources.
Early results from the Brazilian states of Acre and Mato Grosso suggest that jurisdictional REDD+ can achieve significant reductions in deforestation and meaningfully and equitably engage local stakeholders
Acre and Mato Grosso, respectively around the size of Tunisia and Venezuela, are Brazilian states containing large swathes of the Amazon rainforest.
Acre and Mato Grosso entered into REDD Early Movers programs in 2011 and 2017 to facilitate a new jurisdictional REDD+ approach in the area (Schwartzman, 2021). The programs are still ongoing, so all evidence is still preliminary.
Acre’s REDD+ scheme — which awarded $5/tCO2 for reductions below its average deforestation rate between 2001-2010 — received $30 million (equivalent to about 1% of the state’s GDP) from the German government for its emissions reductions between 2012 and 2017. While 10%-30% was reinvested to strengthen program administration, 70-90% was distributed directly to participants responsible for implementation on the ground. The incentives were apparently sufficient not only to protect the local forests, but also to provide concrete benefits to local farmers and ranchers, as well as Indigenous Peoples (Schwartzman, 2021, p. 8). Similarly, The Mato Grosso REDD+ scheme, funded primarily by the German and British governments, allocated just $54 million (equivalent to about 0.2% of the state’s GDP) to protect a large swathe of forest (Schwartzman, 2021, p. 12; Statista, 2022). While we have not found definitive results in terms of avoided carbon emissions, the program appears to have been sufficient to support the recognition, political participation, and capacity building of Indigenous Peoples in a state that had previously largely ignored them or viewed them as impediments to growth (Schwartzman, 2021, p. 13).
Acre’s jurisdictional REDD+ approach has met or exceeded its goals across all components (Schwartzman, 2021, p. 8, Figure 1; see also Global Forest Watch, 2018). The rate of deforestation fell by 85% during the program period (p. 8).[36]
The published literature states that Mato Grosso’s REDD+ program coincided with a more modest (20%) reduction in deforestation from 2020 to 2021 (Schwartzman, 2021, p. 12). While this reduction may indeed be attributable to its jurisdictional approach, we are more skeptical of attributing success in Mato Grosso to the jurisdictional REDD+ approach based on this information given that 2020 and 2021 were associated with significant COVID-induced changes in behavior and economic downturn that likely influenced deforestation trends.[37] Nevertheless, there are reasons to believe the jurisdictional approach supported a reduction in deforestation, for instance, due to improvements in local institutional and enforcement capacity. Due to the jurisdictional approach, the state could make decisions on resource allocation and program enforcement: 40% of resources were allocated to “institutional strengthening of the state’s system of incentives for environmental services” (Schwartzman, 2021, p. 12).[38] According to Lubowski, the state also ramped up police enforcement activities[39], even when the country as a whole rolled back enforcement. Over the period from 2005 to 2012, Brazil also ramped up enforcement and barred people from publicly-funded business loans if they were found to be in violation of the program.
According to Lubowski, Mato Grosso serves as an impressive success story for early jurisdictional REDD+. Despite the relatively small amount of payments from REDD+ funders, this program may actually have been profitable for the state, according to Lubowski. Enforcers were able to collect substantial amounts in fines from violators, and also reduced fund outflows in the form of business loans to illegal operations.
The Mato Grosso REDD+ program has provided some early lessons for future jurisdictional REDD+ planning and implementation. For instance, the flexible and responsive participatory governance structure of its subprogram on indigenous territories — which gave significant influence to Indigenous representatives and facilitated strong dialogue across stakeholders — serves as a model for ensuring program buy-in and equity (Brodsky et al., 2022, p. 14-15). On the other hand, the programs in Acre and Mato Grosso pointed to further need for patience, contextual understanding, cultural sensitivity, capacity building, and design of financial mechanisms to enable “Indigenous People’s autonomy over time” (Brodsky et al., 2022, p. 21; Schwartzman, 2021, p. 10; see also Guerra and Moutinho, 2020). Lubowski also noted that there were “not enough carrots, mostly sticks,” involved in the enforcement incentives, and that future jurisdictional schemes could improve on its model in this and other ways.
Nevertheless, given the apparent success of these early jurisdictional REDD+ programs in encouraging reduced deforestation (in Acre) and fostering local capacity building and empowerment (in Mato Grosso) — along with the broad agreement from experts that jurisdictional approaches are the best way forward — we encourage donors to consider means by which their resources can bolster and support this approach.
Conditions for jurisdictional REDD+ success
1. Credible sustained demand is necessary to encourage supply of certified credits
From the corporate finance perspective, BlackRock CEO Larry Fink’s 2020 call to action via his insistence that CEOs equate climate risk with investment risk represents a step in the right direction (Fink, 2020). Also, net-zero emissions (and related) commitments from companies and large corporations will instill confidence that demand for certified credits is on the rise and will persist into the future. For example, Microsoft has vowed to become carbon-negative by the end of this decade and to negate by 2050 all of the company’s historical emissions since its founding in 1975 (Smith, 2020).
Voluntary carbon markets suggest growing demand for forest protection carbon credits, having represented ~5%-10% of voluntary carbon credits in 2010 and having grown to ~30% of such credits in 2020 (Emergent, 2021b, p. 8), reaching $400 million total during 2017-2019 (Forest Trends’ Ecosystem Marketplace, 2021, p. 1, Table 1). CORSIA — the voluntary agreement to reduce emissions in the international aviation sector — and other international markets being negotiated under Article 6 of the Paris Agreement also represent a potentially sizable source of demand with transaction values of more than $10 billion per year within this decade (Forest Trends’ Ecosystem Marketplace, 2021).
Innovative actors such as the Emergent Forest Finance Acceleratorcan help to stimulate demand by removing transaction costs and financing frictions. Emergent — established in 2019 by EDF in partnership with the Norwegian government — guarantees payments based on forest results by purchasing “put options” that act as a price floor, with the option to ultimately sell for a higher price to private actors (Emergent, 2022). Such mechanisms provide certainty of demand for forest nations, as well as a unified platform for buyers’ ease of purchase of verified high-quality carbon credits that may remove barriers to demand.
2. Political leaders need incentives to follow through
In her post on the World Resources Institute (WRI) website, Seymour (2020) points out that government action is required to set up appropriate economic and legal incentive structures to combat deforestation:
Halting and reversing deforestation and forest degradation on a large scale usually requires actions that only governments can perform. Where forest loss is due to illegal activity, only governments can enforce the law. Where deforestation results from unclear land tenure, only governments can recognize rights to resources. Where forest conversion or degradation is due to licensing of concessions on state-owned land, only governments can suspend or better regulate such licenses. Where deforestation is happening on private land, governments can regulate land use and provide incentives and disincentives through fiscal policies such as access to credit and tax relief.
She argues, however, that the governments lack political incentives to enforce deforestation-related regulations and policies, and that this is a major driver of recent upward trends in forest loss (Weisse and Goldman, 2019). She also argues that project-scale interventions lack crucial legal enforcement and regulatory capabilities, such as assignment of land rights, so that project-related gains are often not sustained or scaled. Her view is that REDD+ finance is just one incentive (“within a set of stacked incentives, including preferential commodity sourcing, reputational benefits”) for political leaders to prioritize sustainable land use. Both Seymour (2020) and Griscom et al. (2017) point to positive outcomes in Brazil in the 2000s that presumably derived from its “strong regulatory framework, accurate and transparent federal monitoring, and supply chain interventions” (Griscom et al., 2017, p. 11648).
The credibility of incentive payout is also crucial. Past emissions reductions in Brazil that, if their claims are accurate, should have led to $24 billion to $36 billion in REDD+ payments have only led to some $2 billion given the limited budgets of funders (e.g., the UN and Norway), which one would imagine could lead to the erosion of trust and waning motivation to devote scarce resources and attention to tackling the problem of domestic deforestation. Thus, credible and sufficient incentives may go a long way in persuading governments to implement and enforce policies and regulations that preserve forests.
3. Market architecture, infrastructure, and financing can facilitate trading
Based on qualitative academic research, private sector demand can be further stimulated through increased certainty around market structure and design of REDD+, suggesting a role for enhanced communication and common standards to build trust and confidence on both the supply and demand side of the market (Laing et al., 2016).
Perhaps most importantly, as stated by Standard Chartered CEO Bill Winters, “agreement is required on standards and certification under one commonly accepted international standards body” (WEF and McKinsey & Company, 2021, p. 3). An international standards body would not only facilitate dialogue among major market actors but also help to rebuild trust in the integrity of forest-related offsets to the benefit of suppliers, who could market the various features of the carbon credits they offer. The closest we found to such a body is the Integrity Council on the Voluntary Carbon Market (ICVCM; successor to the Taskforce on Scaling Voluntary Carbon Markets; TSVCM) — a private sector-led initiative to meet the Paris Agreement goals comprising over 250 relevant institutional actors representing carbon buyers and sellers — and the International Carbon Reduction & Offset Alliance (ICROA), which advocates high-integrity, -quality, and -impact corporate climate action and provides services through its accreditation program.
According to Carvalho and Álvarez Campo (2022), that endorsement by ICROA is just one of three ways carbon credits may be “judged as having market acceptance,” with the other two being CORSIA eligibility and (perhaps to a lesser extent) carbon standards whose credits are accepted under the carbon markets of various jurisdictions (e.g., the EU Emissions Trading System or California’s cap-and-trade program). The TSVCM (2021) suggested that a set of core carbon principles ensure the integrity of carbon credits as well as other features of carbon contracts that may account for, e.g., co-benefits in line with the UN’s Sustainable Development Goals (Slide 16). Given progress in this space, broad agreement on which standards meet a globally agreed set of criteria seems likely to us in the next one to three years.
Moreover, increasing the reliability, availability, and transparency of pricing, risk, and performance data through exchanges — or a centralized carbon exchange — that offer spot and futures contracts would pave the way for structured finance, increase the confidence of buyers, and facilitate market entry. Moreover, finance intermediaries and innovation are needed to, for instance, address gaps in cash flow (i.e., between the time a contract is signed and value generation from emissions reductions), de-risk early stage investments, and enable high-risk, high-impact projects. There may be a role here for venture philanthropy (WEF and McKinsey & Company, 2021). Emergent’s (2021a) flexible contracting model provides one such example.
4. Establishment of a clear regulatory framework can allow countries to use forest-related carbon credits to help meet their Paris Agreement goals
Clear and coherent regulatory frameworks will help to align the market for forest-related carbon credits with international climate goals under the Paris Agreement to ensure that global average temperature rise does not exceed 2°C. For instance, emissions reductions from jurisdictional approaches to REDD+ count toward a country’s nationally determined contribution, and “nesting” — i.e., embedding individual REDD+ projects into jurisdictional programs — can bring project-based REDD+ into alignment with the Paris framework and remove the risk of double counting. For example, Peru’s pilot scheme strikes emissions reductions from non-jurisdictional REDD+ projects that were sold as credits internationally from its own emissions reduction inventory (WEF and McKinsey & Company, 2021, p. 28, Box 10).[40] Additionally, inclusion of forest credits in compliance markets would greatly increase the scale of demand; for example, Colombia’s carbon tax compliance can be met through purchase of voluntary carbon market credits (Verra, 2020a).
The International Emissions Trading Association (IETA) posits that costs to 2030 of meeting nationally determined contributions (NDCs) — non-binding pledges that enshrine countries’ emissions reductions targets (UNFCCC, 2014) — could be halved to $250 billion annually, or abatement enhanced by 5 GtCO2 holding costs constant, under an international carbon market (Carbon Pricing Leadership Coalition and IETA, 2019, p. 1). We did not investigate the likelihood that such a market is established under Article 6 of the Paris Agreement. In 2021, 32 countries committed to adopt the San José Principles for High Ambition and Integrity in International Carbon Markets that they agree should guide such an international carbon market, despite the lack of a consensus thus far, which may pave a path toward future progress on this front (Dirección de Cambio Climático, 2021).
We estimate the cost-effectiveness of REDD+ to fall in the range of $6-$62/tCO2 abated (80% confidence), excluding co-benefits
Our favored estimation of cost per ton for emissions reductions from deforestation comes from a report by the World Economic Forum and McKinsey & Company, which appears to err on the conservative side (i.e., higher $/tCO2) relative to other estimates we came across in the literature. We make crude adjustments to their estimates to account for issues discussed in the section on payments for ecosystem services — primarily additionality and permanence — leading us to formulate a best guess of cost-effectiveness in the range of $6-62/tCO2 with 80% confidence. While we do our best to account for the possibility of overstating cost-effectiveness by adjusting for these model omissions, two reasons we may be understating cost-effectiveness is that McKinsey’s model uses a fairly high discount rate and it does not account for seemingly sizable co-benefits. We did not have time to assess the extent to which incorporating related changes may impact our estimate.
A World Economic Forum (WEF) and McKinsey & Company consultation estimates that a majority of forest conservation can be achieved for $10-$50/tCO2
WEF and McKinsey & Company’s (2021) consultation report undertakes a fairly rigorous cost-effectiveness analysis (see notes on their methodology in the Appendix). Based on literature reviews and expert interviews, they create an aggregate natural climate solutions (NCS) carbon credit cost curve that derives information from more detailed cost curves for each country deemed high-potential (i.e., representing 70% of their conservative estimate of potential, so that 2.2 GtCO2 is not costed). They find that NCS carbon credit costs generally lie in the $10-$40/tCO2 range depending on geography and type of NCS, which is “significantly lower than technology-based removal” (p. 14), but that forestry is one of the most expensive forms of NCS, at approximately $30/tCO2:
What drives high costs for avoided deforestation is land efficiency. As a rule of thumb, protecting 100ha in an area where there is a 1% annual deforestation rate will yield credits for avoiding the emissions from the deforestation of 1ha per year. In practice, land costs can be funded by other parties such as national governments or NGOs. In these circumstances, avoided deforestation is lower cost than reforestation due to lower maintenance costs. Our cost estimates were calculated based on typical deforestation rates per country. While avoided deforestation may incur higher costs in places, it is worth noting that it also carries the potential to bring about more substantial co-benefits than other pathways. (WEF and McKinsey & Company, 2021, p. 14)
WEF and McKinsey & Company’s (2021) analysis indicates significant regional variation in project cost and abatement potential (p. 14, Figure 4b). For instance, high-feasibility projects to avoid deforestation and peatland impact in the Democratic Republic of the Congo, the Republic of the Congo, Bolivia, and Venezuela jointly have the potential to abate about 0.2 GtCO2 annually at a cost of $5/tCO2 or less, while such a project in Brazil alone could accomplish similar (perhaps slightly higher) emissions reductions albeit for about $20/tCO2. From eyeballing the figure, it appears that a vast majority of medium- to high-feasibility carbon reductions from anti-deforestation initiatives have a cost-effectiveness of $10-$50/tCO2.[41]From a global social planner’s perspective of maximizing social welfare cost-effectively, one should first finance the lowest-cost projects (i.e., starting with cover crops in India, which are cost-saving on net) and work one’s way up to the most expensive projects (i.e., medium-feasibility avoided deforestation and peatland impact projects in Malaysia).
We are impressed with WEF and McKinsey & Company’s (2021) methodology.[42] It seems worth noting that they use quite a high discount rate (10%) to calculate net present values of future emissions abatement in their model. We tend to believe that a 10% discount rate is too high, since much of the literature on discount rates in climate economics debates whether setting discount rates to match market interest rates (which are generally well below 10%) is unethical, where some argue that discount rates should instead be much lower, placing closer to equal weight on future value generation (see, e.g., Groom, 2014). On the other hand, upon a quick scan of the experimental development economics literature, it seems that high discount rates are empirically quite common in developing countries (even up to 34%; Duquette et al. 2011, p. 451; Cardenas and Carpenter, 2008, p. 325). It seems likely to us that the marginal abatement cost (MAC) curve[43] would be fairly sensitive to updates in the discount rate, though we are not sure to what extent. Nonetheless, we speculate that lowering the discount rate would meaningfully increase benefits and therefore cost-effectiveness outputs in their model.
Importantly, not all projects WEF and McKinsey & Company (2021) consider are REDD+ projects, but instead they consider multiple types of anti-deforestation projects targeted at tropical countries. The report does not indicate any correlation between whether a project falls under the REDD+ framework and its cost-effectiveness.
Importantly, the McKinsey model does not explicitly account for the two main issues of concern according to our review of the literature: additionality and permanence (we are less concerned about leakage based on our literature review). We crudely adjust for these omissions in our rough model.
Finally, WEF and McKinsey & Company’s (2021)model only measures cost-effectiveness in terms of CO2 benefits, not the co-benefits of anti-deforestation initiatives. However, the report does provide a qualitative assessment of co-benefits, and a separate report, Valuing Nature Conservation (McKinsey & Company, 2020), which we did not review in detail, quantitatively evaluates co-benefits. Our cost-effectiveness assessment therefore also does not include co-benefits. We have not undertaken a rigorous assessment of co-benefits, but we assume their inclusion would significantly improve cost-effectiveness.
WEF and McKinsey’s estimates appear to be conservative relative to others in the literature
The Center for Global Development predicts higher emissions abatement from forest conservation for a given carbon price than do WEF and McKinsey
Modeling from a book published by the Center for Global Development (CGD) suggests that reducing emissions from tropical deforestation by 50% would reduce the costs of limiting warming to 2°C by 28% (Seymour and Busch, 2016). The book states that cutting emissions in half could additionally reduce warming by up to 0.82°C and bring forward the point in time when emissions begin to decline by up to five years (p. 125).
The CGD model of responses to carbon pricing indicates that over half of the lowest-cost opportunities for emissions reductions in developing countries (excluding China) come from forest conservation (Seymour and Busch, 2016, pp. 6-7). This finding is similar to that of Griscom et al. (2017), who find that half of low-cost global emissions reductions come from forest-related pathways and that a majority of NCS emissions reduction potential exists in the developing world.[44] Additionally, the CGD model suggests that a $20 ($50) per tCO2 carbon price can avert 41 (77) GtCO2 to 2050 through payments for forest conservation[45] (Busch and Engelmann, 2015). The CGD model does not provide perfectly comparable marginal abatement cost estimates to WEF and McKinsey & Company’s (2021). However, its figure is somewhat more optimistic than WEF and McKinsey & Company’s (2021), which suggests that a $20 ($50) per tCO2 carbon price would lead to about 43 (65) GtCO2 abatement for all NCS.
Griscom et al. (2017) also predict higher forest emissions abatement for a given carbon price than do WEF and McKinsey
In a widely cited 2017 academic study, 25 scientists from various relevant disciplines — including biology, geography, agriculture, ecology, and economics — explore the potential of 20 NCS for greenhouse gas mitigation (Griscom et al., 2017). They build upon the established agriculture, forestry, and land-use greenhouse gas inventory of the Intergovernmental Panel on Climate Change (IPCC), the highly trusted UN body tasked with assessing the science of climate change. IPCC Working Group III had assessed eight options in its inventory, which the study authors further disaggregate while also building in constraints on food supply, nutrition, and biodiversity.
Griscom et al. (2017) find that the maximum NCS mitigation potential is 23.8 GtCO2/year (with a 95% CI of 20.3-37.4 GtCO2/year), with 11 GtCO2/year — more than the emissions of Europe and the US combined (Andrew and Peters, 2021; as seen in Ritchie et al., 2020) — representing cost-effective abatement at a carbon price of $100/tCO2. In other words, at this carbon price, it would be cheaper to mitigate those 11 GtCO2 than for the emitter to pay the carbon price. Two-thirds of these cost-effective[46] emissions come from forest-related pathways, some of which are already accessible as relatively cost-effective carbon credits through REDD+ and other forestry projects. The authors find that a third of the cost-effective NCS reductions can be achieved for less than $10/tCO2, including a large fraction from avoided deforestation conversion, as indicated by the dark gray bars in Figure 3.
Figure 3: 2030 climate mitigation potential of 20 natural climate solutions. From “Natural climate solutions,” by B. W. Griscom, J. Adams, P. W. Ellis, R. A. Houghton, G. Lomax, D. A. Miteva, W. H. Schlesinger, D. Shock, J. V. Siikamäki, P. Smith, P. Woodbury, C. Zganjar, A. Blackman, J. Campari, R. T. Conant, C. Delgado, P. Elias, T. Gopalakrishna, M. R. Hamsik, … J. Fargione, 2017, Proceedings of the National Academy of Sciences, 114(44), p. 11646 (https://doi.org/10.1073/pnas.1710465114). Copyright 2017 by the authors.
WEF and McKinsey & Company’s (2021) NCS MAC curve suggests about 2.7 (6.7) GtCO2/year would be abated at a carbon price of $10 ($100) per tCO2, compared to Griscom et al.’s (2017) more optimistic 4.1 (11.3) GtCO2/year (p. 11647). Unfortunately Griscom et al. (2017) do not provide estimates of abatement potential for other potential carbon prices, nor for anti-deforestation interventions specifically.
Griscom et al. (2017) claim that NCS can contribute 37% of cost-effective CO2 mitigation necessary through 2030 to remain on a track to have a 66% probability of limiting warming to 2°C. This proportion declines to 20% through 2050 with the saturation of NCS and the increasing proportion of mitigation coming from reduced fossil fuel use. Hence, they argue, the importance of NCS is particularly salient in the near term, as NCS solutions are immediately available, a point to which we are sympathetic despite our belief that the paper overstates the scale of benefits achievable for a given carbon price.
Reforestation, while more expensive than avoided forest conversion, has the highest mitigation potential, though Griscom et al. (2017) assume all forest grazing land (42% of reforestation opportunities) is reforested, which is unrealistic. Avoided conversion — described as having relatively low uncertainty[47] — has the next highest potential and the highest low-cost potential of the NCS, though they warn that “implementation costs may be secondary to public policy challenges in frontier landscapes lacking clear land tenure” (p. 11648), as argued by Seymour (2020) in the previous section on conditions for jurisdictional REDD+ success.
The authors put these savings into the context of contemporaneous ambitions under the Paris Agreement. At the time of the study, globally aggregated NDCs overshot the carbon budget compatible with warming below 2°C to 2030 by 11-13 GtCO2 per year; NCS only accounted for 20% of climate mitigation (about 2 GtCO2/year) to 2030.[48]
Note that the estimates presented in the paper also do not consider co-benefits of NCS, but instead only incorporate data on activities and greenhouse gas emissions changes where such data could be globally extrapolated, and consider a fairly low ambition (66% chance of below-2°C warming) scenario. Hence, the benefits they report also appear to us to be quite likely underestimated in this respect, though their findings are optimistic relative to the other sources considered in this section. Given constraints on our time and expertise, we did not closely evaluate the study’s methodology, but its publication in PNAS, high citation count, and the sheer number and variety of established coauthors led us to put sufficient trust in its findings to present its results for comparison here.
We coarsely adjust WEF and McKinsey’s numbers to account for omitted risks in their model and estimate a conservative cost-effectiveness range of $8-$88/tCO2 and a more realistic range of $6-$62/tCO2 (80% confidence)
WEF and McKinsey & Company’s (2021) MAC assessment appears to be rigorous, well-considered, and generally in line with (albeit more conservative than) other findings from the literature. Most of the NCS they include in their MAC assessment lie in the $5-$40/tCO2 range, though the majority of abatement potential from avoided deforestation specifically appears to lie in the $10-$50/tCO2 range (“approximately $30”; WEF and McKinsey & Company, 2021, p. 14).
However, WEF and McKinsey & Company (2021) do not appear to account for additionality and permanence concerns in their model. We therefore incorporate our best guess of the impacts of doing so, using WEF and McKinsey & Company’s (2021) $10-$50/tCO2 range as a baseline — as well as an additional $5/tCO2 baseline consistent with the high end of the market rate we identified and the amount paid by the Green Climate Fund in the REDD+ pilot phases — and making adjustments in this rough model that we modified from a version sent to us by John Halstead (personal communication, January 22, 2022) in making his CEA updates post-2018.[49]
We consider this estimate “conservative” given that WEF and McKinsey & Company’s (2021) estimate seems to us the most conservative we have come across from our read of their methodology, and we have revised their estimates upward with conservative (i.e., somewhat skeptical or pessimistic) adjustments, which leads to an updated range of $8-$88/tCO2.
Using inputs that we believe to be more realistic given the move toward jurisdictional REDD+, recent advancements in technology to improve MRV, and the like, we identify a rough 80% CI of about $6-$62/tCO2, i.e., slightly less cost-effective than WEF and McKinsey & Company’s (2021) estimates. We place more weight on this estimate given that our best-guess estimates of the impacts of issues related to additionality, permanence, leakage, and MRV is based on research of past PES and REDD+ programs, and we are more optimistic about future programs given recent progress. We emphasize that co-benefits — on which anti-deforestation and other forestry-related projects tend to score very highly — are not accounted for in these CEAs, such that cost-effectiveness from the perspective of total impact (including non-CO2 benefits) is almost certainly underestimated.
As such, wethink that forest-related carbon credits represent an impactful and cost-effective climate change mitigation opportunity with significant benefits deriving particularly from funding delivered in the near term, given the irreversible cost of delay.
Crucially, without a comprehensive understanding of cost-effectiveness across climate interventions, it is impossible for us to say whether funding REDD+ is the most cost-effective climate intervention. Additionally, without a means by which to compare the impact of climate interventions with non-climate interventions in, say, global health or poverty reduction, it is very difficult to incorporate the opportunity cost of funds toward REDD+. We hope to see progress along both of these dimensions in future EA research.
Our best guess is that there is about $100 billion to $200 billion of room for more funding for emissions reductions from jurisdictional REDD+
Our best guess is that there is currently room for between $100 billion and $200 billion in annual direct funding for REDD+ (low confidence, given dependence on one source).[50] Of these funding needs, we are only aware of public pledges totaling $19.2 billion over the coming decade (UNEP, 2021) and corporate pledges totaling $1.5 billion (LEAF Coalition, 2022), averaging to about $2 billion per year and leaving a gap amounting to the high tens or low hundreds of billions of dollars in annual unmet need for direct REDD+ credits in the next 10-15 years to remain consistent with a 2°C scenario. It appears that funds directed toward REDD+ and the UNFCCC are increasingly used for conservation payments rather than for “readiness” and other overhead costs, so we would expect future funding to be more directly linked to forest protection than they have been in the past.
If one concluded that REDD+ were effective and credible, socially optimal funding would clear the market for carbon credits all the way up to the point where their price equaled the social cost of carbon (SCC).[51] Given the climbing estimates of the SCC, and past difficulties in delivering REDD+ payments, we should expect that there is substantial room to grow before this area is no longer neglected. Indeed, to clear the market, funding would need to grow by at least one order of magnitude over the next decade. (See also Trove Research and UCL, 2021, for a recent report outlining the shape of the voluntary credits market, which contains useful context for much of this section.)
From the perspective of meeting Paris Agreement goals and commitments, Keohane and Seymour (2021) emphasize countries’ need for significant REDD+ transactions to cost-effectively meet their NDCs and, even more difficult, the 2°C scenario:[52]
Public international flows for forests and commitments for performance-based REDD+ finance averaged only about $1 billion per year between 2010 and 2017 (Climate Focus 2017). Estimates of the total cost of achieving deep (50-75%) cuts in global deforestation emissions run into the high tens of billions of dollars annually (Busch et al. 2019; Kindermann et al. 2006). A more policy-relevant figure may be the international financial flows required to support significant reductions in deforestation, as distinct from efforts within tropical forest countries. New research indicates that cost-effective implementation of current NDCs would entail about 1 billion tonnes of international REDD+ transactions per year (over and above what countries would do domestically) at prices of $10-$20 through 2035. A 2°C-consistent scenario would, in theory, entail double the volume at $50-$100 prices (Piris-Cabezas et al. 2019; Piris-Cabezas et al. 2021).
As another benchmark for comparison, existing financial flows for tropical forest protection continue to be dwarfed by perverse public subsidies and private investment in activities that can drive deforestation. The $1 billion in annual international public flows cited above compares to an annual average of more than $34 billion in domestic subsidies to commodities that drive deforestation in Brazil and Indonesia alone. Further, average annual international flows of “grey” (not environmentally-sensitive) finance to the land sector over the same period totaled almost $100 billion (Climate Focus 2017). (Keohane and Seymour, 2021, p. 5, emphasis ours)
At COP26 in 2021, more than 100 world leaders committed to end and reverse deforestation this decade, with public and private funds to support the pledge reaching $19.2 billion (Rannard and Gillett, 2021). In a sort of best-case scenario where we assume the market and non-market funding captured by Forest Trends’ Ecosystem Marketplace (2021) misses 20% of funding due to measurement error, that these market and non-market sources of funding triple from the 2017-2019 period of measurement to 2022, and that the COP26 pledge mobilizes $19.2 billion annually instead of just once,[53] we would still not reach the “high tens of billions of dollars annually” that Keohane and Seymour suggest is the relevant aggregate annual funding target from the literature; in fact, we wouldn’t even reach $20 billion annually under these (extremely generous) assumptions.
Carvalho, formerly of the South Pole Group, informed us that 2.2% ($14 billion) of global climate finance is directed to land use projects,[54] and urged that “we need to step up finance to address a lever that could be one of the most cost-effective solutions to meeting Paris goals” (see also Climate Policy Initiative, 2021). Given the tiny share of funding going to forestry projects, it seems quite plausible that forestry solutions are neglected even within the climate space.
Lubowski, of Emergent, told us that the largest source of demand for forest protection carbon credits comes from the voluntary market. However, credits from voluntary carbon markets equated to only 1/250 (0.4%) of annual emissions from tropical and subtropical deforestation in 2020 (Emergent, 2021, p. 8).[55]
That said, financing and commitments appear to be ramping up, with 61% of forest finance tracked from 2009 to 2019 having been transacted or disbursed from 2017 to 2019 (Forest Trends’ Ecosystem Marketplace, 2021, p. 1), and about 40% ($159 million) of voluntary financing during the latter period coming in 2019, the most recent year with available data (Emergent, 2021). Emergent (2021) claims that “this level of investment still falls significantly short of the scale of finance required” to keep warming below 1.5°C (p. 8). Such a ramp-up in funding is promising: Forest Trends’ Ecosystem Marketplace (2021) notes that the “gap between the finance needed versus what is currently flowing remains massive, but it is beginning to narrow” (p. 4).
Much of the (primarily non-market) funding for REDD+ has thus far been allocated to “readiness” — i.e., planning and capacity building to pave the way for more effective results-based payment contracts (see the section on jurisdictional REDD+) — and has not directly had an impact on forest loss (Forest Trends’ Ecosystem Marketplace, 2021, p. 39, Table 6). Lately, according to Forest Trends’ Ecosystem Marketplace (2021), “donor emphasis on REDD+ Readiness programs … is beginning to shift to results-based payments” (p. 6).
Thus, while tackling emissions from deforestation and degradation may not be neglected as a topic of discussion, funding is neglected relative to the size of the problem and there is considerable room for more funding, seemingly to the tune of tens or low hundreds of billions of dollars annually.
What we would do with more time
Further assessment of high-impact donation opportunities
While we have not spent significant time evaluating specific organizations in this space, we have some inclinations on how we would do so. This overview is by no means exhaustive of potential opportunities for high-impact funding.
In our conversation with Lubowski, he mentioned several well-considered and immediately actionable funding opportunities on the CLUA website, so we would recommend taking those as a starting point (CLUA, 2021).
Lubowski also recommended committing funds for results-based jurisdictional REDD+ payments and supporting the recipient countries in setting up their programs. One reason we agree that this could be a promising opportunity is that the jurisdictional REDD+ infrastructure is still fairly new, and philanthropists are well-placed to provide financing in a risk-neutral manner that will help to build market function and competence, paving the way for future financing from risk-averse parties. We are not sure which organizations or actions to recommend in this undertaking, but we would recommend starting by speaking with Emergent.
Similarly, WEF and McKinsey & Company (2021) explicitly mention a potential role for venture philanthropists to fill the need for bridging temporal gaps in the financing of REDD+ projects, for instance between project conception and actual credit generation (p. 26). When asked where they would give money if they were in a position to make a large donation, multiple experts mentioned support for jurisdictional REDD+, including conservation trusts, public-private partnerships, jurisdictions that will implement REDD+ programs, and commitments to results-based payments. Supporting jurisdictional REDD+ projects is also one of CLUA’s (2022) four “forest protection” funding recommendations.
For large donors interested in identifying high-impact projects at a given point in time, and who are willing to pay a consultancy fee, we recommend liaising directly with McKinsey’s Nature Analytics team.
One interesting route that WEF and McKinsey & Company (2021) have highlighted is the role of financial intermediation (p. 27). There may be a role for venture philanthropy in addressing cash flow gaps and cushioning early-stage investment risks.
We also sympathize with Carvalho’s inclination toward supporting those who research the chief concerns of the REDD+ model (e.g., additionality, permanence, leakage, and MRV), and who identify innovative solutions to address those concerns, so that the lack of rigorously researched solutions does not further stall the effective implementation of forest PES schemes. Carvalho suggested that support for such research could catalyze the development of a more robust global market for forest credits to more urgently address ongoing forest loss. For instance, abstracting from feasibility momentarily, an RCT with a simple design could go a long way toward resolving uncertainties around impermanence — for example, a study may suggest it is beneficial to remove PES payments after a contracting period for a control subset of projects (globally or within a jurisdiction) in line with the status quo, while maintaining those payments for a treated subset to compare forest loss outcomes.
Moreover, given the seemingly critical issue of poor degradation measurement, we would be curious to understand the extent to which funding high-resolution satellite data capture or access could help to resolve such consequential measurement error. We are aware of a few organizations working in this space, including Pachama and Space Intelligence.
Finally, we would research opportunities to leverage funding across poverty alleviation, biodiversity, sustainable agriculture, gender equity (e.g., the World Bank’s EnABLE program; World Bank, 2021), and forest loss prevention initiatives. For instance, Ferraro and Simorangkir (2020) find that a large-scale anti-poverty program in Indonesia that provides conditional cash transfers to households for meeting certain health- and education-related criteria led to a reduction in deforestation. Thus, in some contexts,[56] targeting poverty alleviation programs for forest (fringe) dwellers seems likely to provide a sizable additional benefit in terms of reduced deforestation. Given the significant funding that is directed toward poverty alleviation and biodiversity conservation, it seems that a donor could have significant impact in forging connections and fostering awareness of shared benefits so that projects optimizing across all of these outcomes are prioritized.
We came across some other organizations during our research that may potentially be promising (e.g., Conservation International), but we did not have time to research these in any depth.
Further research into other interventions
Our primary focus has been on payments for ecosystem services in part due to the focus of EA organizations on the Coalition for Rainforest Nations in recent years, mainly due to its apparent status as the most viable and advanced coordinated forest loss prevention solution (Halstead, 2018). Further work could dig more deeply into the merits of alternative and potentially complementary approaches, such as targeting improved supply chains or shifting forest product demand.
Further research into climate impacts of forests
We would additionally like to spend more time engaging with the academic debate regarding tropical forests’ net climate impacts (e.g., see Popkin, 2019), and perhaps interviewing subject-matter experts to gain a deeper understanding. We would also like to get a sense of the distribution of primary uses for tree products to get a better sense of aggregate climate impacts.
Additional ways we would spend more time
Conduct extensive research to identify the best giving opportunities in the broader NCS space (in particular peatlands, as these were mentioned in conversation on a few occasions as a potentially highly important and neglected area, as well as mangroves; Fernanda Adame et al., 2017)
Reach out to more experts to resolve some of our remaining uncertainties. Some experts with whom we might initially aim to engage include Frances Seymour (WRI), Seema Jayachandran and Pam Jagger (as recommended by Justin Labeille from Giving Green), an MRV practitioner at Space Intelligence (or other REDD+ MRV specialist), and an expert in anti-deforestation carbon accounting — preferably one who has worked on setting up or piloting accounting systems for jurisdictional REDD+ — regarding the challenges to jurisdictional REDD+ that we and others have identified, as well as challenges and conventions in MRV. Among others, we would discuss the following questions and uncertainties:
What is the extent to which conditions for success will be met? (We are less confident that jurisdictional REDD+ is a cost-effective climate change mitigation approach if efforts are ultimately not undertaken to meet the outlined conditions, or if jurisdictional approaches do not take hold.)
To what extent will jurisdictional REDD+ reduce the gap between committed and realized emissions reductions?
How much can we trust the progress that has been made to safeguard against additionality, leakage, impermanence, and MRV within the REDD+ framework?
How exactly are PES incentive sizes determined? (The answer will affect both cost-effectiveness and impact, through incentive compatibility, and may also affect our views on whether the approach is equitable.)
Will REDD+ be included as a means toward meeting countries’ NDCs under the Paris Agreement, thereby affecting neglectedness and cost-effectiveness?[57]
How does the “M” in “MRV” (i.e., measurement) distinguish between natural and human-induced deforestation and degradation?
Compare the results for cost-effectiveness between various forestry-related interventions, as well as with other climate mitigation opportunities
Interview and read the research of Justin Baker, associate professor at North Carolina State University, on active forest management, which he is quoted as claiming to be “often neglected” and “more cost-efficient” than preserving forests (Moore, 2021)
Conduct a detailed CEA, instead of making simple adjustments on Halstead’s (personal communication, January 22, 2022) model — ideally including co-benefits.
More closely vet the basic methodology underlying Halstead’s model — to which we only made minor adjustments (and mostly just to inputs) — and review Mendelsohn and Sohngen (2019), which he recommended
Conduct further research and modeling to answer the questions:
If we extrapolate anti-deforestation forest funding trends to 2030 and assume that all of it goes toward the most cost-effective anti-deforestation opportunities, how much would abating 1 tCO2 cost (i.e., where do we end up on the MAC curve)?
Under the same trend extrapolation, how far into the future would all forest-related emissions with an abatement cost below $100/tCO2 be avoided?
Acknowledgments
This post is a project of Rethink Priorities–a think tank dedicated to informing decisions made by high-impact organizations and funders across various cause areas. Greer Gosnell and Ruby Dickson were the lead researchers and main authors of the client-facing version of this report. James Hu and Greer Gosnell edited the client-facing version of the report to transform it into a public-facing report. Jason Schukraft, Tom Hird, and Melanie Basnak supervised different parts of the client-facing report, and Melanie Basnak reviewed and supervised the transition from a client-facing to a public-facing report. Thanks to Kim Cuddington, Jenny Kudymowa, Willem Sleegers, and Bruce Tsai for helpful comments on drafts. Thanks to Adam Papineau for copyediting and to Rachel Norman for assistance with publishing the report online. Further thanks to Melissa Bedinger (University of Edinburgh); Maria Carvalho (previously at South Pole Group, now at NatWest); Vasco Amaral Grilo, Sanjay Joshi, and Matt Sharp (SoGive); John Halstead (Forethought Foundation); Justin Labeille and Dan Stein (Giving Green); and Ruben Lukowski (Emergent) for taking the time to speak with us.
If you are interested in Rethink Priorities' work, please visit our research database and subscribe to our newsletter.
Alix-Garcia, J. M., McIntosh, C., Sims, K. R. E., & Welch, J. R. (2013). The Ecological Footprint of Poverty Alleviation: Evidence from Mexico's Oportunidades Program. The Review of Economics and Statistics, 95(2), 417–435. https://doi.org/10.1162/REST_a_00349
Alix-Garcia, J. M., Sims, K. R. E., Orozco-Olvera, V. H., Costica, L. E., Fernández Medina, J. D., & Romo Monroy, S. (2018). Payments for environmental services supported social capital while increasing land management. Proceedings of the National Academy of Sciences, 115(27), 7016–7021.https://doi.org/10.1073/pnas.1720873115
Andrew, R. M., & Peters, G. P. (2021). The Global Carbon Project’s fossil CO2 emissions dataset [Data set]. Zenodo.https://doi.org/10.5281/zenodo.5569235
Angelsen, A., Hermansen, E. A. T., Rajão, R., & van der Hoff, R. (2018). Results-based payment: Who should be paid, and for what? In A. Angelsen, C. Martius, V. De Sy, A. E. Duchelle, A. M. Larson, & T. T. Pham (Eds.), Transforming REDD+: Lessons and new directions (pp. 49–50). Center for International Forestry Research.https://doi.org/10.17528/cifor/007045
Asquith, N. M., Vargas, M. T., & Wunder, S. (2008). Selling two environmental services: In-kind payments for bird habitat and watershed protection in Los Negros, Bolivia. Ecological Economics, 65(4), 675–684.https://doi.org/10.1016/j.ecolecon.2007.12.014
Austin, K. G., Schwantes, A., Gu, Y., & Kasibhatla, P. S. (2019). What causes deforestation in Indonesia? Environmental Research Letters, 14(2), 024007.https://doi.org/10.1088/1748-9326/aaf6db
Badgley, G., Freeman, J., Hamman, J. J., Haya, B., Trugman, A. T., Anderegg, W. R. L., & Cullenward, D. (2022). Systematic over-crediting in California’s forest carbon offsets program. Global Change Biology, 28(4), 1433–1445.https://doi.org/10.1111/gcb.15943
Börner, J., Schulz, D., Wunder, S., & Pfaff, A. (2020). The effectiveness of forest conservation policies and programs. Annual Review of Resource Economics, 12(1), 45–64.https://doi.org/10.1146/annurev-resource-110119-025703
Brouwer, R., Pinto, R., Dugstad, A., & Navrud, S. (2022). The economic value of the Brazilian Amazon rainforest ecosystem services: A meta-analysis of the Brazilian literature. PLOS ONE, 17(5), e0268425.https://doi.org/10.1371/journal.pone.0268425
Burivalova, Z., Allnutt, T. F., Rademacher, D., Schlemm, A., Wilcove, D. S., & Butler, R. A. (2019). What works in tropical forest conservation, and what does not: Effectiveness of four strategies in terms of environmental, social, and economic outcomes. Conservation Science and Practice, 1(6), e28.https://doi.org/10.1111/csp2.28
Busch, J., & Engelmann, J. (2015). The future of forests: Emissions from tropical deforestation with and without a carbon price, 2016-2050 (Center for Global Development Working Paper No. 411).https://doi.org/10.2139/ssrn.2671559
Cardenas, J. C., & Carpenter, J. (2008). Behavioural Development Economics: Lessons from Field Labs in the Developing World. The Journal of Development Studies, 44(3), 311–338.https://doi.org/10.1080/00220380701848327
Carvalho, M., & Álvarez Campo, C. (2022). NCS carbon standard gap analysis.Manuscript in preparation.
Duchelle, A. E., Simonet, G., Sunderlin, W. D., & Wunder, S. (2018). What is REDD+ achieving on the ground? Current Opinion in Environmental Sustainability, 32, 134–140.https://doi.org/10.1016/j.cosust.2018.07.001
Duquette, E., Higgins, N., & Horowitz, J. (2012). Farmer Discount Rates: Experimental Evidence. American Journal of Agricultural Economics, 94(2), 451–456.https://doi.org/10.1093/ajae/aar067
Fernanda Adame, M., Brown, C. J., Bejarano, M., Herrera-Silveira, J. A., Ezcurra, P., Kauffman, J. B., & Birdsey, R. (2018). The undervalued contribution of mangrove protection in Mexico to carbon emission targets. Conservation Letters, 11(4), e12445.https://doi.org/10.1111/conl.12445
Griscom, B. W., Adams, J., Ellis, P. W., Houghton, R. A., Lomax, G., Miteva, D. A., Schlesinger, W. H., Shoch, D., Siikamäki, J. V., Smith, P., Woodbury, P., Zganjar, C., Blackman, A., Campari, J., Conant, R. T., Delgado, C., Elias, P., Gopalakrishna, T., Hamsik, M. R., … Fargione, J. (2017). Natural climate solutions. Proceedings of the National Academy of Sciences, 114(44), 11645–11650.https://doi.org/10.1073/pnas.1710465114
Groom, B. (2014). Discounting. In A. Markandya, I. Galarraga, & E. Sains de Murieta (Eds.), Routledge handbook of the economics of climate change adaptation (pp. 138–168). Routledge.https://doi.org/10.4324/9780203095201
Guerra, R. & Moutinho, P. (2020). Challenges of Sharing REDD+ Benefits in the Amazon Region. Forests, 11(9), 1012.https://doi.org/10.3390/f11091012
Honey-Rosés, J., Baylis, K., & Ramírez, M. I. (2011). A spatially explicit estimate of avoided forest loss. Conservation Biology, 25(5), 1032–1043.https://doi.org/10.1111/j.1523-1739.2011.01729.x
Jack, B. K. (2013). Private information and the allocation of land use subsidies in Malawi. American Economic Journal: Applied Economics, 5(3), 113–135.https://doi.org/10.1257/app.5.3.113
Jack, B. K., & Jayachandran, S. (2019). Self-selection into payments for ecosystem services programs. Proceedings of the National Academy of Sciences, 116(12), 5326–5333.https://doi.org/10.1073/pnas.1802868115
Jayachandran, S., de Laat, J., Lambin, E. F., Stanton, C. Y., Audy, R., & Thomas, N. E. (2017). Cash for carbon: A randomized trial of payments for ecosystem services to reduce deforestation. Science, 357(6348), 267–273.https://doi.org/10.1126/science.aan0568
Kröger, M. (2020). Deforestation, cattle capitalism and neodevelopmentalism in the Chico Mendes Extractive Reserve, Brazil. The Journal of Peasant Studies, 47(3), 464–482.https://doi.org/10.1080/03066150.2019.1604510
Laing, T., Taschini, L., & Palmer, C. (2016). Understanding the demand for REDD+ credits. Environmental Conservation, 43(4), 389–396.https://doi.org/10.1017/S0376892916000187
Levasseur, A., Brandão, M., Lesage, P., Margni, M., Pennington, D., Clift, R., & Samson, R. (2012). Valuing temporary carbon storage. Nature Climate Change, 2(1), 6–8.https://doi.org/10.1038/nclimate1335
Mendelsohn, R., & Sohngen, B. (2019). The net carbon emissions from historic land use and land use change. Journal of Forest Economics, 34(3–4), 263–283.https://doi.org/10.1561/112.00000505
Nomura, K., Mitchard, E. T., Bowers, S. J., & Patenaude, G. (2019). Missed carbon emissions from forests: Comparing countries’ estimates submitted to UNFCCC to biophysical estimates. Environmental Research Letters, 14(2), 024015.https://doi.org/10.1088/1748-9326/aafc6b
Park, C. (2007). Integrated conservation and development programme (ICDP). In A Dictionary of Environment and Conservation (1st ed.). Oxford University Press.https://doi.org/10.1093/acref/9780198609957.001.0001
Robalino, J., & Pfaff, A. (2013). Ecopayments and deforestation in Costa Rica: A nationwide analysis of PSA’s initial years. Land Economics, 89(3), 432–448.https://doi.org/10.3368/le.89.3.432
Roopsind, A., Sohngen, B., & Brandt, J. (2019). Evidence that a national REDD+ program reduces tree cover loss and carbon emissions in a high forest cover, low deforestation country. Proceedings of the National Academy of Sciences, 116(49), 24492–24499.https://doi.org/10.1073/pnas.1904027116
Shi, Z., Allison, S. D., He, Y., Levine, P. A., Hoyt, A. M., Beem-Miller, J., Zhu, Q., Wieder, W. R., Trumbore, S., & Randerson, J. T. (2020). The age distribution of global soil carbon inferred from radiocarbon measurements. Nature Geoscience, 13(8), Article 8.https://doi.org/10.1038/s41561-020-0596-z
Simonet, G., Subervie, J., Ezzine-de-Blas, D., Cromberg, M., & Duchelle, A. E. (2019). Effectiveness of a REDD+ Project in Reducing Deforestation in the Brazilian Amazon. American Journal of Agricultural Economics, 101(1), 211–229.https://doi.org/10.1093/ajae/aay028
Smith, R., Guevara, O., Wenzel, L., Dudley, N., Petrone-Mendoza, V., Cadena, M., & Rhodes, A. (2019). Ensuring co-benefits for biodiversity, climate change and sustainable development. In W. Leal Filho, J. Barbir, & R. Preziosi (Eds.), Handbook of Climate Change and Biodiversity (pp. 151–166). Springer International Publishing.https://doi.org/10.1007/978-3-319-98681-4_9
Warren-Thomas, E. M., Edwards, D. P., Bebber, D. P., Chhang, P., Diment, A. N., Evans, T. D., Lambrick, F. H., Maxwell, J. F., Nut, M., O’Kelly, H. J., Theilade, I., & Dolman, P. M. (2018). Protecting tropical forests from the rapid expansion of rubber using carbon payments. Nature Communications, 9(1), Article 1.https://doi.org/10.1038/s41467-018-03287-9
West, T. A. P., Börner, J., Sills, E. O., & Kontoleon, A. (2020). Overstated carbon emission reductions from voluntary REDD+ projects in the Brazilian Amazon. Proceedings of the National Academy of Sciences, 117(39), 24188–24194.https://doi.org/10.1073/pnas.2004334117
Appendix: WEF and McKinsey’s marginal abatement cost curve methodology
To determine abatement potential (the horizontal axis), WEF and McKinsey & Company (2021) considered 5x5 square kilometer pixels of land, assessing the maximum potential for carbon sequestration across different types of land. They accounted for “agricultural rent” (i.e., economic value that can be realized from agricultural land) and chose low-rent ($10/ha or less) and medium-rent ($10-$45/ha) pixels for NCS interventions, representing high- and medium-feasibility projects, respectively. They validated this methodology by demonstrating that about 90% of global carbon credit projects are located in the low- and medium-rent pixels. Total potential for NCS is 10.2 GtCO2/year, and “practical” potential (excluding low-feasibility land) is 6.7 GtCO2/year (McKinsey & Company, 2021, p. 2).
To determine the cost of abatement per tonne of CO2 (vertical axis), the team used a net present value approach, summing negative and positive cash flows (informed by 80-100 expert interviews) of the lifetime of potential projects over a 30-year time horizon. They used a 10% discount rate on agricultural revenues based on expert guidance, which is the rate development banks generally use for evaluating developing country investments (McKinsey & Company, 2021, p. 2). Costs included land costs (to acquire or rent the area of land to implement NCS, plus other costs like land taxes), initial project costs (e.g., legal, administration, site preparation), recurring project costs (e.g., labor, maintenance, security, overhead, and community payment), and carbon credit monetization costs (e.g., validation, verification, issuance; excludes marketing).
The team used Busch et al.’s (2019) land-cover change model to identify areas at risk of deforestation by 2050, which would lead to emissions on the order of just under 260 GtCO2 (for reference, total anthropogenic annual emissions are about 40 GtCO2, so this amount corresponds to about 6.5 years of current annual anthropogenic emissions). Deforestation of mangrove forests and deserts were not included.
They then conducted a straightforward geospatial analysis at a regional scale and aggregated this analysis up to the national and global scales. Their full process, including expert interviews, took about two months to complete. They did not conduct a formal sensitivity analysis.
The evolution of REDD+ (formerly just REDD) has introduced criteria that embody a “do no harm” ethos that additionally encourages pursuit of co-benefits (Smith et al., 2019, p. 160).
All three problems — additionality, permanence, and leakage — can be extremely impactful on the effectiveness of a given PES scheme, and can vary in importance depending on the structure of the project. An interested reader could refer to our rough model to understand the sensitivity of REDD+ cost-effectiveness to these various concerns. The model was modified from a spreadsheet shared with us by John Halstead (personal communication, January 22, 2022).
“We did not find it useful to develop a quantitative model for cost-effectiveness because we are highly uncertain regarding assumptions and estimates for parameters that we deem central to Frontier’s AMC model. In particular, given that we are providing this recommendation in the specific context of a business looking to make a catalytic investment toward carbon removal, we believe that Frontier is highly likely to be cost-effective as it provides the prospect of amplifying a contribution to carbon removal through both its acceleration and deployment potential; we find this to be a notable value-add considering that both timing and scale are critical for the deployment of carbon removal technologies” (Giving Green, 2022c).
Founders Pledge claimed in 2018 that the cost-effectiveness of advocacy work by the Clean Air Task Force is in the range of $0.03 and $5.50, with a best guess of $0.29 (Halstead, 2018, p. 101; Founders Pledge, 2018), and we are generally aware of a similar belief within Giving Green in the past few years (e.g., Giving Green, 2021, p. 8). We have not spent any time scrutinizing these CEAs, but we have attempted our own CEAs of advocacy work and are familiar with the associated extreme uncertainty.
The former effect (i.e., 0%-55% reduction) is known as the “intent-to-treat” (ITT) effect and refers to the difference between outcomes observed for all households assigned to receive the treatment (i.e., the treatment group) and those observed for households assigned to the control group; that is, the treatment group in this comparison includes households that were invited to enroll in the PES program but did not, in fact, enroll in the program. The latter effect (i.e., up to 90% reduction) is known as the “treatment effect on the treated” (TOT) and refers to the impact of the treatment solely among those who are both assigned to treatment and receive the treatment (in this case, households who were invited to and enrolled in the PES program); the TOT can be determined by dividing the ITT estimate by the percentage of the treatment-eligible subjects (i.e., those invited to enroll) that actually enrolled in the PES program.
Tropical forests generally have both higher biodiversity and carbon sequestration potential than temperate and boreal forests (e.g., in North America, Europe, and Asia), in large part due to their high growth rates and living biomass density (World Economic Forum and McKinsey & Company, 2021, p. 16). However, northern forests typically contain deep soil beds, meaning a high risk of soil carbon release upon clearing (Shi et al., 2020).
According to an email exchange with Maria Carvalho, former head of public affairs at the South Pole Group, “the [Intergovernmental Panel on Climate Change] (2018) and (2019 on Land) are incredibly clear on the reinforcing nature between climate change, land use change, and achievement of UN SDGs. Not addressing deforestation will lead to accelerated climate change, loss of biodiversity, reduced ecological resilience, changing micro-climates, and increased desertification.” We did not have time to review these sources ourselves, but acknowledge that the IPCC is generally a well-reputed and highly trusted source.
In the study sample, the average reported area of forest owned is two hectares, allowing enrollees to earn about $56 (5% of mean and 16% of median income) annually from compliance with the PES scheme. Additionally, 85% reported having cut down trees over the last three years. Participants received additional payments for planting tree seedlings.
These estimates are quite uncertain given high uncertainty regarding the social cost of carbon (SCC; the authors use $39/tCO2 in line with US EPA guidelines from 2012). Note that even with an updated higher SCC of $100/tCO2, even the higher-cost estimates still show the projects are at least moderately cost-effective, as well as merely effective. In its importance, tractability, and neglectedness assessment of forestry interventions, Giving Green (2022a) suggests that a best-case cost-effectiveness of $2.60/tCO2 is poor relative to their recommended charities, all of which focus on policy advocacy. However, we would posit that (1) the SCC used by Jayachandran et al. (2017) is very likely too low, and (2) that Giving Green’s CEAs for policy advocacy are highly uncertain, in large part by nature of the modeling problem (i.e., advocacy organizations’ influence over policy).
In Simonet et al. (2019), 52 households participated after being offered the program, while 54 households did not. The study also tracks 75 households who were not offered the opportunity to participate.
Alix-Garcia et al. (2018) observe effects at the community level, ultimately creating a sample including 862 communities, with 493 participating communities and 369 non-participating communities.
ICDP refers to an approach toward biodiversity conservation that also emphasizes local community involvement and rural economic development (Park, 2007).
That is, Brazil used an extended window of 20 years, rather than 10 years, to calculate the FREL average. This decision was within the regulations but it clearly was made to increase Brazil’s possible offset claims.
Note that the REDD+ projects assessed in the paper are now quite dated and may have been particularly burdened — as the authors discuss — by uncertainty around the availability of future funds, early mover disadvantages (e.g., limited prior learning or accumulated expertise regarding on-the-ground implementation), and particularly salient early issues with the credibility of carbon offsets. West et al. (2020) explicitly state that “results do not imply that voluntary REDD+ projects cannot achieve their objectives if designed and implemented effectively” (p. 24191).
The authors claim to use a methodologically superior matching approach, though we have not assessed their methodology and think that we are currently only moderately qualified to assess it; we take their peer-reviewed publication in PNAS as a signal that the methodology is sound. Also, the authors claim that the program led to important intangible benefits such as institutional and technical capacity that “resulted in both regulatory and technological additionality that improved overall forest governance” (p. 24496).
Jack and Jayachandran (2019) theoretically model selection into PES programs and apply their model to Jayachandran et al.’s (2017) study in Uganda and an afforestation/reforestation project in Malawi (Jack, 2013). They highlight that complete non-additionality (i.e., enrollment by the one-third of PFOs that contributed least to deforestation prior to the intervention in their study) would have led to zero impact on deforestation, and additionally highlight the importance of considering the effect of enrollment costs (e.g., costs of obtaining and digesting program information, application effort and time, credit constraints that may inhibit conservation investments, and trust in the implementing organization) on selection into these programs.
By high-quality, we refer to emissions reductions from jurisdictional REDD+ projects with certification from such agencies as Verra, Gold Standard, and ART TREES, which we expect to become more plentiful in the coming years. We discuss jurisdictional REDD+ and the various certifications later in the report.
Another recommendation by West et al. (2020) is to use synthetic controls to assess the counterfactual rather than using historical trends. However, given the move toward jurisdictional REDD+ and the goal to maximize regional coverage to mitigate leakage, non-REDD+ jurisdictions that can act as synthetic controls may be limited, as discussed above in relation to Roopsind et al. (2019). We would be curious to explore West et al.’s (2020) suggestion to use “coupled human–natural system models” to assess performance against alternative baseline scenarios (p. 24192). Future research in partnership with REDD+ could utilize a number of different approaches from the outset, all applied to multiple REDD+ programs, to understand the performance as well as the benefits and drawbacks of various (and potentially complementary) baseline-setting approaches.
Given the experience of the US Northeast project discussed above, it is reasonable to question the rigor and enforcement of such standards. We have not looked further into whether such requirements are actually in force.
For instance, for each project, Verra deposits a number of nontradable credits commensurate with its risk assessment calculation into a separate “pooled buffer account” that “will always maintain an adequate surplus to cover unanticipated losses from individual project failures and the net GHG benefits across the entire pool of AFOLU projects will be greater than the total number of [credits] issued” (Verra, 2022, pp. 5-6).
Carvalho has subsequently mentioned that, while Verra is the most robust for project-based REDD+, both Verra and ART TREES are considered the most robust standards for jurisdictional REDD+ programs.
For example, one might expect that the value of standing forests to forest nations’ citizens may increase as the countries develop. Moreover, repeated five- or 10-year contracts (or even longer contracts) may encourage identification of alternative economic uses for the forests — such as ecotourism and recreation — that create economic incentives to conserve forest land. A recent meta-analysis suggests that the value of standing forests to local populations is about $410/ha/year with high uncertainty (Brouwer et al., 2022, p. 1).
“In recent years all major international policy forums have chosen to accept emissions reductions from deforestation at jurisdictional – state or national – levels, but not stand-alone project levels. The UNFCCC Paris Agreement article 5 (REDD+), the International Civil Aviation Organization’s Carbon Offsetting and Reduction System for International Aviation (CORSIA), and the California Tropical Forest Standard (TFS) allow carbon crediting for state or national level emissions reductions from deforestation, but not for stand-alone projects. … This has extremely important consequences for the environmental and social quality of emissions reductions” (Schwartzman, 2022, p. 6).
Developing countries may receive financial and technological support in creating their FRELs. For instance, the FCPF is a public-private partnership that supports developing countries to conduct satellite-based land-use change surveys, create forest inventories, quantify greenhouse gas emissions and removal, and perform uncertainty analyses (FCPF, 2022).
Concerns about “gaming the system” are tied to this step, since countries can choose the reference period that acts as a baseline against which to assess progress, and may also exploit other methodological degrees of freedom.
As discussed in the section on PES, PES programs could exacerbate wealth and income inequality, because local landowners tend to be relatively wealthy and the introduction of anti-deforestation programs induces them to no longer allow poorer neighbors to benefit from deforestation. One possible remedy could be direct cash transfers and other anti-poverty programs that reduce the incentive to clear forests in the first place (Alix-Garcia et al., 2018).
“These figures are based on a price of $1,100 per metric ton for crude palm oil (CPO), a fresh-fruit-bunch (FFB) average lifetime yield of 21 to 24 metric tons per hectare, and a 20 percent CPO/FFB yield” (Albani et al., 2012, p. 95).
A careful reader may note that an increase in demand for credits may also spur a flood of supply, potentially driving prices back down. Price dynamics indicate that demand-support measures such as the one recommended here may work best with a policy of sustained long-term credit purchasing.
CORSIA is a voluntary agreement to reduce emissions in the international aviation sector coordinated by the UN International Civil Aviation Organization (Timperley, 2019).
Other results — including the number of forest extractivist families, small farmers, and livestock ranchers who benefited — showed impressive success as well.
Additionally, formal “measurable emissions reductions and avoided deforestation results are not yet quantified,” so we encourage additional caution in attributing any observable reduction in deforestation to the program at this early stage (The Nature Conservancy, 2022, p. 19).
The other 60% were divided among three local subprograms addressing traditional and family agriculture, Indigenous territories, and mid-sized agricultural producers (Schwartzman, 2021, p. 12).
In our interview, Lubowski clarified that certain deforestation activities were already illegal in Mato Grosso prior to the REDD+ program, but insufficient resources had been allocated to enforcement.
McKinsey & Company’s (2021) methodological appendix for its 2021 report with WEF mentions the abatement potential for avoided deforestation at $10, $45, and $100/tCO2 is 1.0, 3.4, and 5.3 GtCO2 annually, respectively, which “includes deforestation of peat swamp forests” but “excludes deforestation from mangrove forests and deserts” (p. 6).
A MAC curve plots the cost per tCO2 abated (y-axis) against the CO2 abatement potential (x-axis), starting with the lowest-cost options and progressing to higher-cost options. See WEF and McKinsey & Company (2021, p. 14, Figure 4b) for an example.
Busch and Engelmann (2015) find that 89% of low-cost emissions reduction potential lies in the 47 tropical countries that had signaled their intention to participate in REDD+ in 2016. We have not looked into which of these countries have subsequently followed through to enroll in REDD+ schemes.
Seymour and Busch’s (2016) model discusses the issues of additionality, permanence, and leakage, but does not appear to explicitly include such concerns in its top-line calculation of cost-effectiveness.
In assessing cost-effectiveness, Griscom et al. (2017) consider the SCC to be at or above $100/tCO2, i.e., a carbon price of $100/tCO2 is considered cost-effective. A SCC of $100 seems quite reasonable to us, given the current SCC used by the US EPA is $51/tCO2 and is expected by an academic expert we trust to at least double this year (Auffhamer, M., 2022).
Griscom et al. (2017) attribute the relatively low uncertainty of avoided forest conversion to increased global forest monitoring research stemming from global interest in REDD+. Reduced uncertainty should be considered a spillover benefit of REDD+, though we do not know the opportunity cost of those investments in technology and human capital.
Leaders from 145 countries containing almost 91% of forests have since endorsed the Glasgow Leaders’ Declaration on Forests and Land Use (2021) at COP26 in October 2021. The Declaration states that endorsers “commit to working collectively to halt and reverse forest loss and land degradation by 2030 while delivering sustainable development and promoting an inclusive rural transformation,” though it does not specify a way to reach this goal. In a report published by the World Wildlife Fund UK, Bakhtary (2021) provides NDC rating grades for each country on its coverage of NDCs following COP26, and Nature4Climate (2017) has created the Natural Climate Solutions World Atlas to give visibility into countries’ climate mitigation potential, cost-effectiveness, and commitment.
We did not check the underlying assumptions regarding how changes to these numbers affect the resulting cost-effectiveness, and would prioritize doing so given more time. Additionally, we would spend more time thinking about the extent to which we would take an “additive” versus a “multiplicative” approach (i.e., whether the impacts arising from any issue area affect the cost-effectiveness irrespective of improvements to other issues). For now, we include a version of both in our range estimates.
This best guess is based on the research from Keohane and Seymour (2021) that suggests that cost-effective climate change mitigation in line with the 2°C target would require about 2 GtCO2 of annual international REDD+ transactions at $50-$100/tCO2 (p. 5).
Our report does not explicitly consider any climate interventions other than REDD+. As such, we cannot say whether REDD+ is neglected relative to other climate interventions. We only note that at current costs, REDD+ does appear to be able to abate emissions cost-effectively, meaning that it would cost less than the SCC — particularly if the SCC is set at $100/tCO2 or higher.
Note that the Paris Agreement’s objective is maintaining a global average surface temperature “well below 2°C above pre-industrial levels and pursuing efforts to limit the temperature increase to 1.5°C above pre-industrial levels” (Climate Action Tracker, 2019). Staying within an emissions threshold consistent with 1.5°C warming would require more ambition.
A UN Environment Programme (2021) announcement appears to indicate that the $19.2 billion pledge covers the entire period from 2021 through 2030, and is not annual.
The land use category includes forest-related projects as well as sustainable agriculture and fisheries, so 2.2% overstates the commitment to anti-deforestation initiatives.
From 2017 to 2019, the voluntary carbon market transacted 105 MtCO2 equivalent (or 0.105 GtCO2 equivalent total, equivalent to about 0.035 GtCO2 equivalent/year) worth of carbon credits, whereas gross average annual emissions from tropical and subtropical deforestation is about 6 GtCO2 equivalent (Harris et al., 2021, p. 236, Table 1); in other words, we can say confidently that 0.5% of annual emissions from deforestation are offset each year in voluntary markets.
Context is often very important to the outcome of a program or policy. For instance, Ferraro and Simorangkir state that, “One well-designed study [Alix-Garcia et al. (2013)] reported that CCTs in Mexico increased deforestation and argued that this impact arose after the transfers increased the consumption of land-intensive products. Our study finds that different mechanisms appear to dominate in an Indonesian context and these mechanisms could potentially dominate in many parts of Asia due to the importance of rice as a staple crop and growing market access in rural areas.” (p. 1).
According to Forest Trends’ Ecosystem Marketplace (2021), “the potential of forests within NDCs to meet Paris Agreement targets remains largely untapped … analysis shows that integrating climate cooperation through carbon markets into Article 6 and including REDD+ could result in almost doubling emissions reductions for the same total cost as a non-cooperative scenario for NDCs. As of June 2021, draft Article 6 text indicates inclusion of REDD+ is certainly on the table” (p. 4).


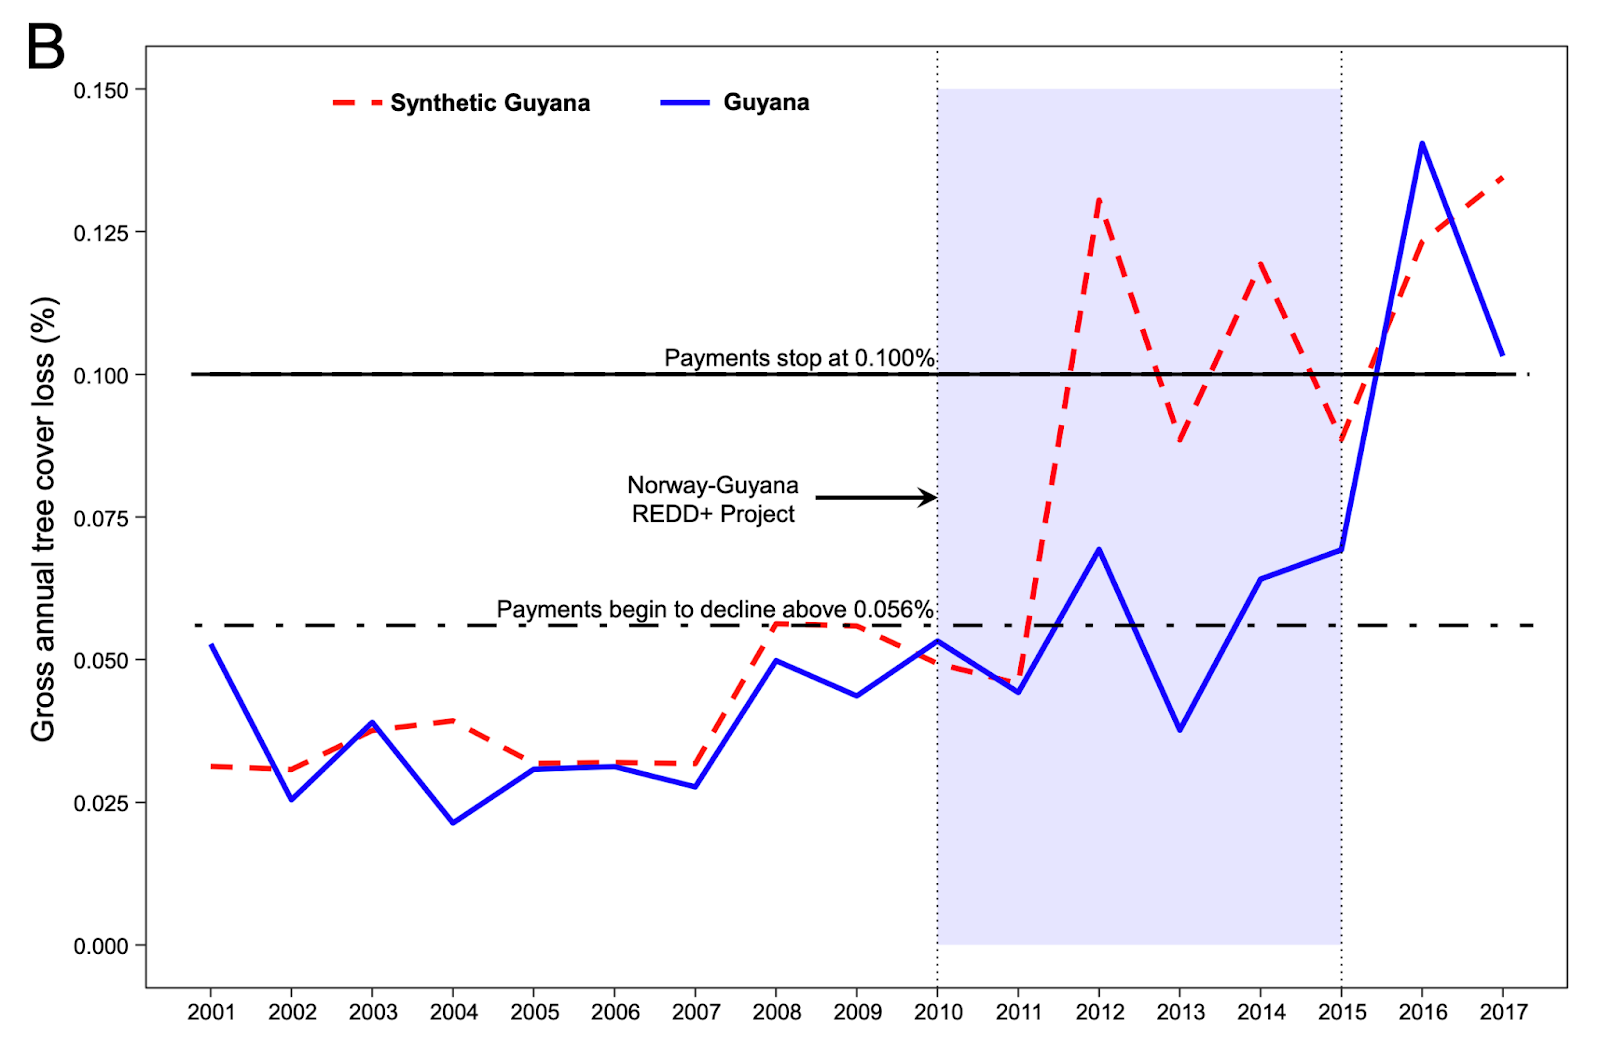
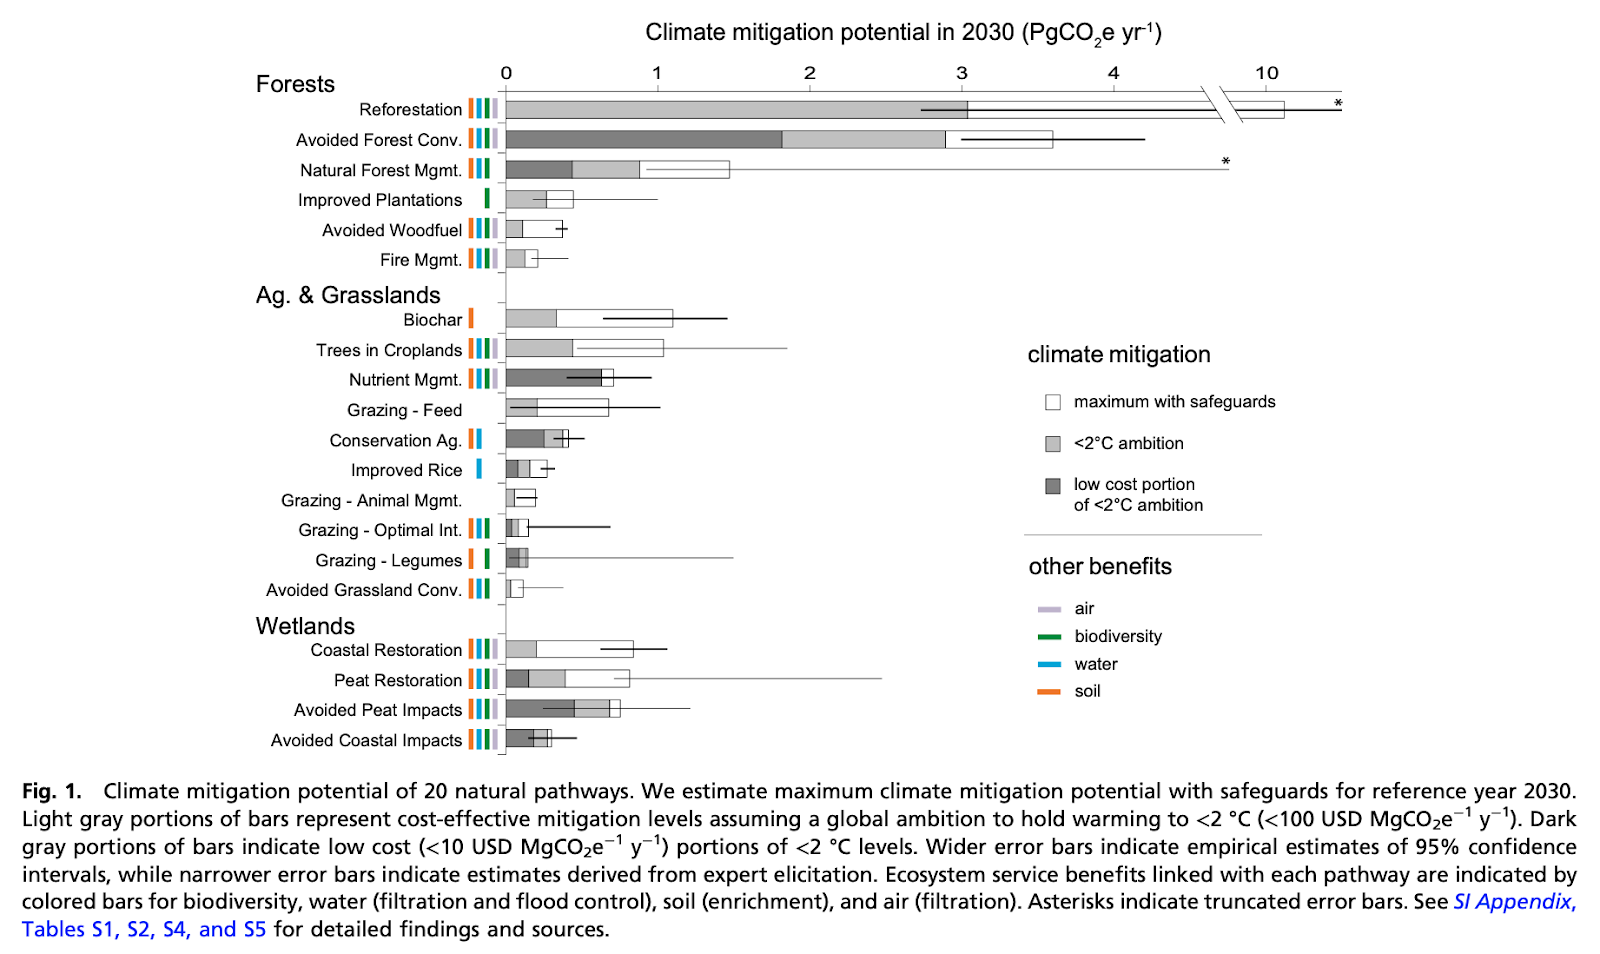

(Written on a plane to Christmas holidays, so apologies for lack of links, and further engagement being delayed to 2023). Thanks for writing this! I am looking forward to more work on this and to find the best thing in this space, but I am extremely skeptical of the claim that we do not know anything about how anti-deforestation compares to other things we can fund in climate.
As my team and I have spent thousands of hours at this point working on what gives rise to relative cost effectiveness in climate (which is what this claim is about) and I also conducted a 50h+ investigation on CfRN and REDD+ in 2020 when reevaluting (we were unable to publish this for organizational reasons, FWIW our estimates where in the upper end of the range cited here and I'd be happy to share in DM), I wanted to explain why (not sorted by importance, but by explanatory logic moving from more outside to more inside view):
1. First, in some trivial sense, it is of course true that we do not know with 100% certainty. But the claim that we know nothing about the relative cost effectiveness of anti-deforestation feels akin to the following statements: (a) "We do not know for certain that giving to the Center for Health Security (CHS) or donating PPE to your local hospital is more effective to reducing biorisk" , (b) "We do not know for certain that giving to the Good Food Institute is better to reduce animal suffering than giving to your cat shelter next door". These statements are trivially true, but I assume almost everyone reading this would feel quite confident in CHS > PPE for local hospitals and GFI > local cat shelter and would not be distraught by the lack of RCT evidence or unified identical methodology across evaluators. My tldr point is we should feel the same about this case, because -- like in those cases -- we know a lot about the structure of the problem including philanthropic biases, but also about the effectiveness of different strategies.
2. The reason for that, to me, seems a Bayesian mindset of "what should we believe given the evidence?" rather than what are we 100% certain of, a state we will never reach in an intervention space covering decades, uncertain futures, and global human and natural systems.
3. So what is the evidence against ignorance on cost-effectiveness? At its most outside-view-y the fact that three evaluators that have looked at this independently (FP, SoGive, Giving Green) and none of them has anti-deforestation as their top recommendation is evidence against this. The fact that FP stopped recommending CfRN is additional evidence of this kind, as is SoGive's work that led EA away from early recs in this space and the recent work by Vasco et al on tree planting cost-effectiveness.
4. This evidence is stronger when one takes into account significant donor pressures to find anti-deforestation good. I am sure we could all advise a lot more money if we had rainforest charities in our top recs, the opportunity cost of not recommending in this space is high in terms of advised money. (This is also the main reason I am writing this reply now despite heading out for holidays, I think such a claim of ignorance is quite negative for effective giving in climate because a lot of donors want to believe this as much as Mulder wants to believe in aliens).
5. Going one step less meta, Vasco et al's recent piece has an appendix that discusses considerations on what a reasonable prior on this might be. I am certainly biased in that they rely on our report to form that prior, but I think it gives a good brief overview of the key considerations why one should approach cost-effectiveness of forest-related interventions with skepticism compared to alternatives.
6. The most important reason against to me seems the utter non-neglectednees of anti-deforestation (even Republicans like planting trees!). I literally get emails from people I have not talked to in years who know I work in climate that ask me how to save the rainforest. Less anecdotally, natural solutions is one of the largest pots in climate philanthropy and the Bezos Earth Fund and several other for the other largest climate philanthropists have strongly increased giving in this space, so it is not only one of the largest spaces, it is also one of the fastest growing ones. What is more, philanthropy focused on conservation, also including interventions like this, is several X larger than climate philanthropy (last I checked at least 2-3). This should make one very sceptical to be able to find (under reasonable search cost, including opportunity cost) high quality room for funding that would not otherwise be quickly filled unless one has a systematic theory of why all large donors overlook this. (Maybe such an opportunity exists with small organizations that large donors consider peanuts, but for country level REDD+ this special consideration does not apply). Almost any charity will almost always offer room for funding and a good story so analysis of philanthropy data and donor behavior patterns is crucial to analyze in a space with as much money influx as climate when considering counterfactually adjusted cost-effectiveness which is what we are after.
7. More broadly, there has been a multi-decade global effort to find tractable cost effective interventions around avoiding deforestation. Given the salience of conservation before climate, I assume they preceed climate, but since I am more familiar with climate I will focus on this. Essentially ever since the birth of international climate policy in the early 1990s the international community has tried to solve the problem of rewarding poor countries for taking cheap abatement options, often in the context of forests and with REDD(+) since the early 2000s. Everyone wants this to work, whole governments (Norway in particular) spend enormous resources to make this work. Yet, as of mid-2020, when I last looked at the literature in depth, I think it was pretty clear this by and large did not work in a way that achieves additional and permanent anti-deforestation. It's of course possible something fundamentally changed since then but I haven't heard of it despite following climate news pretty closely.
8. I think we have good reasons to expect this to remain intractable because the two biggest problems in the space are irresolvable. Permanence can never be guaranteed until we figure out how to construe contracts that bind future governments of sovereign countries. Additionality of avoided deforestation can never be guaranteed until we can run and compare multiple worlds. These are not techical or governance issues that can be solved with better satellites or slightly improved international frameworks, these are deep reasons to be skeptical on the tractability of avoided deforestation vs more tractable strategies.
9. More subtly but quite importantly, the effectiveness of investing in anti-deforestation is negatively correlated with its value, anti-deforestation is least effective in the futures where it would matter most. This is the opposite of what we want, we would want at least robustness (independence of effectiveness and value) and ideally, for lack of a better term, hedginess (positive correlation between effectiveness and value; I discuss this much more in my SERI talk on the structure or climate risk and its implications for high-impact climate philanthropy).
Much of the uncertainty on cost-effectiveness of anti-deforestation is driven by uncertainty about permanence and additionality, which is arguably related to international and national political conditions. Anti-deforestation via REDD+ will be most cost-effective in futures where international cooperation is good and we get a functioning and, crucially, lasting global anti-deforestation market. These are worlds where the social cost of carbon, the value of additional abatement, is likely quite low because these conditions correspond with good climate progress overall. Conversely, in worlds where additional abatement is particularly valuable, with poor international coordination and low climate policy and lots of energy-intensive growth, REDD+ is unlikely to work. This sounds like an absurdly technical point, but given the shape of climate damage it is actually quite important and it makes reduced emissions in expectation the wrong metric for evaluating climate impact as long as we know something about how different interventions correlate with warming trajectories (and thus marginal value of abatement).
Crucially, energy innovation as the generally considered most cost-effective intervention (at least naively, when not adjusting for recent crowding), does not have this weakness. Somewhat roughly, solar will still be relatively cheap when climate policy breaks down, the world forms blocs, and there's lots of energy-intensive growth in emerging economies, but REDD+ will likely fail.
10. I could go on but this comment is already too long. To summarize, it seems to me we have all kinds of relevant evidence that should make us quite skeptical of the claim that anti-deforestation is likely to be particularly cost-effective, in particular in relative terms. It looks bad on the outside view, on neglectedness, it looks bad on tractability and on many more inside-view considerations. Moreover we do have more evidence than the post grants on the relative cost-effectiveness of other interventions. Since I first made the argument for innovation advocacy for neglected technologies in EA in 2016/2017 this was vetted by Let's Fund, Founders Pledge (before I joined), SoGive, and Giving Green. The fact that this theory of change / intervention strategy has stood the test of time across evaluators does carry information. While I am not sure it's still the best thing to do on the margin (given how philanthropic additionality is changing, I think it's possible that interventions to avoid carbon lock-in might beat it), it seems very unlikely for all the reasons discussed above that we should be in a state of ignorance when we compare it to REDD+.
I am still curious to see what you find and I think that when one is willing to incur a comparatively very large search cost there might be good things that can be found. But I don't think we are in a state of ignorance until then with regards to what we should expect on its relative cost-effectiveness, especially compared to interventions that have been investigated and found cost-effective by several evaluators.
Thanks for your very thoughtful comments, Johannes.
Please note that we do not have the bandwidth to respond in detail here to each of the 10 points you lay out in your comment (nor to all Forum comments on our reports), but we will do our best to respond to those we find most critical to the conversation and would love to find a time to further discuss these and your remaining points over separate correspondence.
With regard to the Bayesian mindset to which you allude (“what should we believe, given the evidence?), we agree with this approach. Of course, the evidence in the space of climate economics and policy is vast, so we hope we can agree that this approach is a significant undertaking that would benefit from coordination and collaboration across relevant orgs in EA. Given the vastness and complexity of various climate-relevant literatures, we believe that there is a real risk of jumping to conclusions too hastily, hence our interest in introducing some form of time-efficient peer review process among the major EA climate research organizations.
Our aim in this project was to summarize and discuss the best evidence we could find on the (cost-)effectiveness of REDD+ over about 8 weeks of two full-time researchers’ time, and to draw reasonable conclusions about the interventions’ potential impact and CE. We do not claim that this research is fully comprehensive and we caveat that it was undertaken early in 2022 (e.g., before the recent presidential election in Brazil or the 30x30 agreement, the implications of which we have not researched in any depth).
That said, we do hope that the EA community can use the research as a starting point for coming to a consensus on the CE of REDD+ as a climate intervention. We aim to be quite clear about our main uncertainties in the report and provide some suggestions for how researchers could usefully spend more time. After finding little in the way of comparable estimates in the EA climate literature, we concluded that it would be quite difficult to confidently claim that REDD+ was a relatively cost-effective intervention relative to other climate interventions, and even more difficult when broadening the comparison to global health and development interventions.
It is very possible that there is more consensus (using a comparably rigorous research approach, with comparable outcome measures) than we are aware of regarding the cost-effectiveness and potential impact of the myriad climate interventions that could plausibly “pass” an ITN shallow review, and that this EA consensus would be compatible with broader climate expert consensus. However, many of the EA-recommended climate charities we came across were related to climate advocacy, where cost-effectiveness estimates are understandably difficult to pin down given extreme sensitivity to modeler assumptions and relatively short-term political contexts, making direct comparison or ranking quite difficult.
We hope to discuss how to improve intervention comparability with you and others in the EA climate space in the near future! If there is indeed such consensus and comparability, perhaps we could collaborate to compile this information for ease of comparison, and we will update our report accordingly.
On the subject of neglectedness, the Bezos Earth Fund is indeed focused on natural climate solutions, though they have committed (i) “only” $10B over 10 years (where we anticipate RFMF an order of magnitude larger — and annually — over the next ten years for REDD+), and (ii) not specifically to the REDD+ framework, to our knowledge.
Regarding your point about historic REDD+ not having achieved additionality and permanence, we refer you to the report, where we largely agree with this perspective and hence recommend a focus on jurisdictional REDD+ programs that are gaining significant momentum, as well as continuous results-based payments for the entire duration of the desired avoided emissions. We also touch on reasons we expect additionality and permanence concerns to diminish going forward.
Finally, we have recently begun to consider whether it may make sense to recommend various options for different “types” of potential donors in the climate space (also for risk diversification). As you suggest, it is possible that a whole lot of potential philanthropic dollars are not being allocated (or are being allocated to other causes) due to donors’ preferences for near-term / more certain vs. long-term / more risky solutions, or for carbon savings alone vs. perhaps lower carbon savings with significant (human, gender, biodiversity, other) co-benefits, etc. Unless those potential philanthropic funds otherwise get allocated toward other high-impact charities (i.e. not “the cat shelter next door”, which seems plausible for individuals desiring near-term, tangible impact), neglecting to provide donation recommendations that align with donor preferences represents a missed opportunity for impact.
We have written some additional (and generally more specific) responses to some of your points, which we look forward to discussing with you in separate correspondence. Thanks again, and looking forward to continuing the conversation!