Adding to the causal evidence, there's a 2019 paper that uses wind direction as an instrumental variable for PM2.5. They find that IV > OLS, implying that observational studies are biased downwards:
Comparing the OLS estimates to the IV estimates in Tables 2 and 3 provides strong evidence that observational studies of the relationship between air pollution and health outcomes suffer from significant bias: virtually all our OLS estimates are smaller than the corresponding IV estimates. If the only source of bias were classical measurement error, which causes attenuation, we would not expect to see significantly negative OLS estimates. Thus, other biases, such as changes in economic activity that are correlated with both hospitalization patterns and pollution, appear to be a concern even when working with high-frequency data.
They also compare their results to the epidemiology literature:
To facilitate comparison to two studies from the epidemiological literature with settings similar to ours, we have also estimated the effect of PM 2.5 on one-day mortality and hospitalizations [...] Using data from 27 large US cities from 1997 to 2002, Franklin, Zeka, and Schwartz (2007) reports that a 10 μg/m3 increase in daily PM 2.5 exposure increases all-cause mortality for those aged 75 and above by 1.66 percent. Our one-day IV estimate for 75+ year-olds [...] is an increase of 2.97 percent [...]
On the hospitalization side, Dominici et al. (2006) uses Medicare claims data from US urban counties from 1999 to 2002 and finds an increase in elderly hospitalization rates associated with a 10 μg/m3 increase in daily PM 2.5 exposure ranging from 0.44 percent (for ischemic heart disease hospitalizations) to 1.28 percent (for heart failure hospitalizations). We estimate that a 10 μg/m3 increase in daily PM 2.5 increases one-day all-cause hospitalizations by 2.22 percent [...], which is 70 percent larger than the heart failure estimate and over five times larger than the ischemic heart disease estimate. Overall, these comparisons suggest that observational studies may systematically underestimate the health effects of acute pollution exposure.
Air Pollution: Founders Pledge Cause Report — EA Forum
I used AI to fix transcription errors, rerrarange the ideas, and suggest tweaks to the title and some sentences.
Three of the most exciting projects to come out of EA in recent years are, in a vague sense, CEA spinouts:
* Kairos is directly a spinout of CEA and now handles most support for university AI safety groups. Basically everyone I've found who knows them is really excited about what they do
* NEST is an opinionated ideas-fi...
TLDR; To help the effective animal advocacy movement cost-effectively absorb greater amounts of funding in the near future, we are seeking expressions of interest from people who could found a new organization focused on:
* Highly neglected animals: insects, wild animals, shrimp, fish, etc, or
* AI and animals: AI alignment and governance for animal welfare, strategic actions considering transformative AI, AI for wild animals, etc.
* ...
Air pollution appears highly important, neglected and tractable. This post gives a high-level overview of air pollution as a cause area, and outlines strategies to tackle it effectively. We (Founders Pledge) are currently evaluating the cost-effectiveness of specific organisations tackling air pollution, compared to GiveDirectly.
Air pollution is the fifth largest risk factor for mortality globally, causing the deaths of nearly 7 million people every year. It is an issue worldwide, with 99% of the world’s population living in areas above WHO air quality guidelines. It is especially acute in low and middle income countries, where over 90% of deaths occur. In addition to the immediate mortality cost, air pollution potentially worsens cognition and mental health, with an economic cost of 3% lost global GDP.
Air pollution remains highly neglected, with $64 million spent in 2021 by foundations to tackle the issue directly - less than 0.1% of total foundation funding. Only $9.58 is given by foundations for every air pollution death - nearly 8x less than HIV/AIDs. This disparity is more extreme in low and middle income countries, where only 3.6% - or $2.36 million - is spent across Africa, Latin America and Asia (outside India and China) by private foundations. Air pollution funding therefore remains highly distorted relative to where the problem is worst.
Air pollution is a highly complex topic, with thousands of potential interventions to pursue in different cities, tackling different sources, all through different approaches. To prioritise within this complexity, we identify various impact multipliers. This approach can multiply the impact of an air pollution dollar by several orders of magnitude.
We recommend that individuals and foundations funding air pollution interventions should:
Prioritise policy, especially at the stage most appropriate for a country’s development.
In practice, this means funding air quality monitoring and source-specific policy advocacy in South East Asia and Sub-Saharan Africa - neglected regions where emissions are set to grow.
Acknowledgements
Thanks to the following for their feedback and expertise on this project:
Johannes Ackva - Founders Pledge
Mélanie Basnak - Charity Entrepreneurship
Santosh Harish - Open Philanthropy
Sam Hilton - Charity Entrepreneurship
Rachael Kupka - Global Alliance for Health and Pollution
Matt Lerner - Founders Pledge
Sumi Mehta - Vital Strategies
Isabella Suarez - Centre for Research on Energy and Clean Air
Shazia Rafi - Air Quality Asia
Introduction
The Global Burden of Disease estimated that 6.7 million deaths were attributable to air pollution in 2019,[1] making it the fourth largest global risk factor for mortality.[2] 93% of these deaths occurred in low- and middle- income countries.[3] In 2019, 99% of the world’s population was living in places where WHO air quality guidelines were not met.[4]
Pollutants
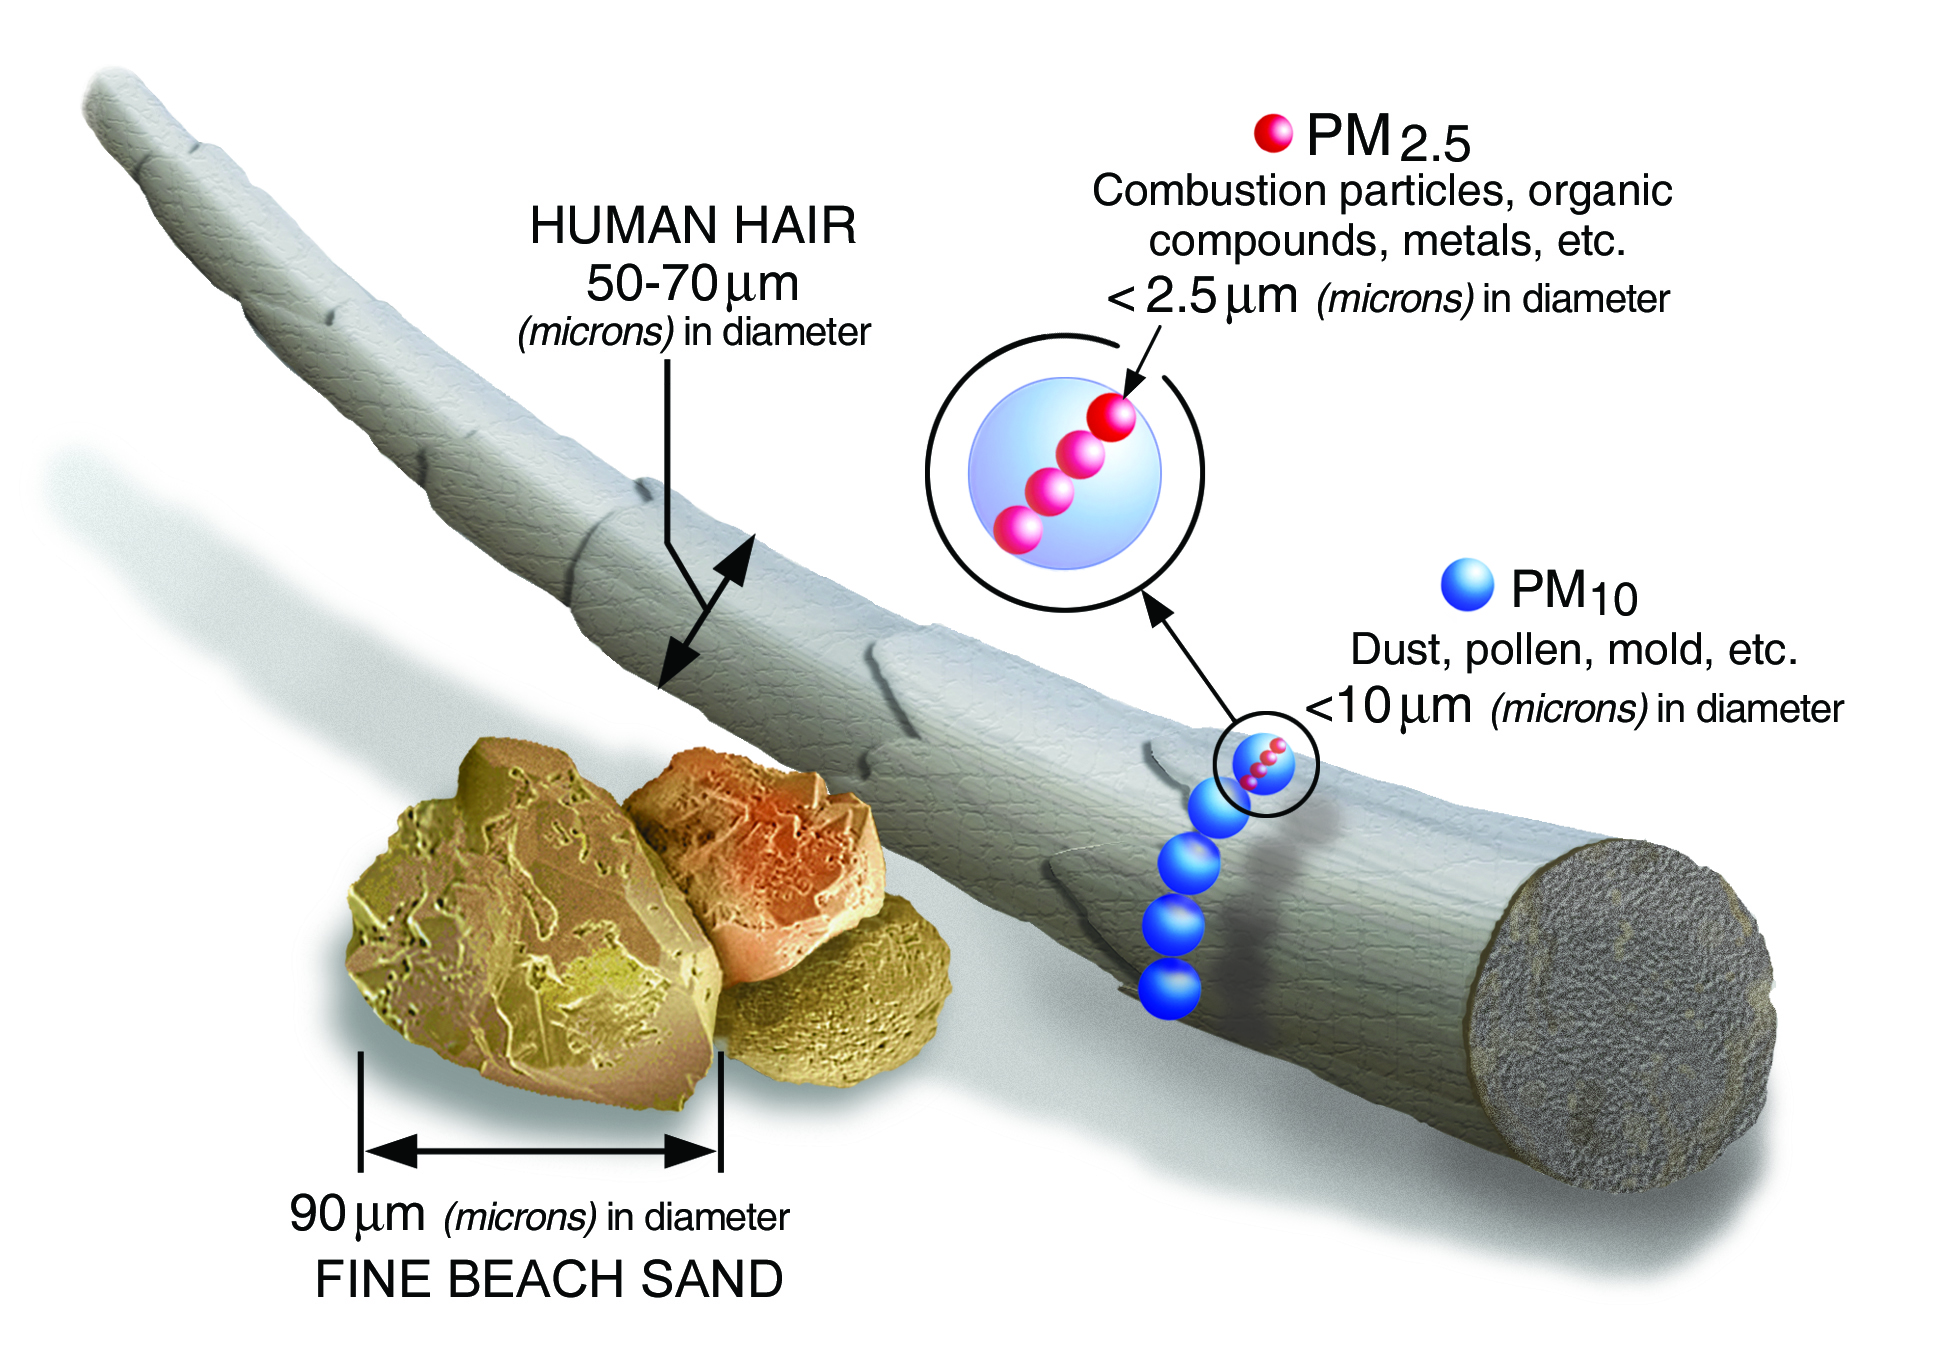
Air pollution consists of many potential pollutants: particulate matter (PM10, PM2.5, PM0.1), Ozone (O3), Nitrous Oxides (NOx), Sulphur dioxides (SOx), Carbon monoxide (CO) and more. This report focuses on PM2.5 - fine particles with a diameter less than 2.5 micrometres.[5]
This is because:
PM2.5 is responsible for most air pollution deaths.[6]
PM2.5 concentration is commonly measured as PM2.5 micrograms per cubic metre (or PM2.5µg/m3).
Sources
Air pollution is commonly divided into indoor (household) and outdoor (ambient) pollution.
Whilst indoor air pollution is mostly caused by burning solid fuels inside the household,[8] outdoor air pollution originates from a wide variety of sources, including:
Residential (e.g. Burning of solid fuels for cooking)
Biomass burning (e.g. clearing of rainforests)
Energy/Power generation (e.g. Coal-fired power plants)
Agriculture (e.g. Ammonia-based fertilisers)
Natural sources (e.g. desert-originating dust)
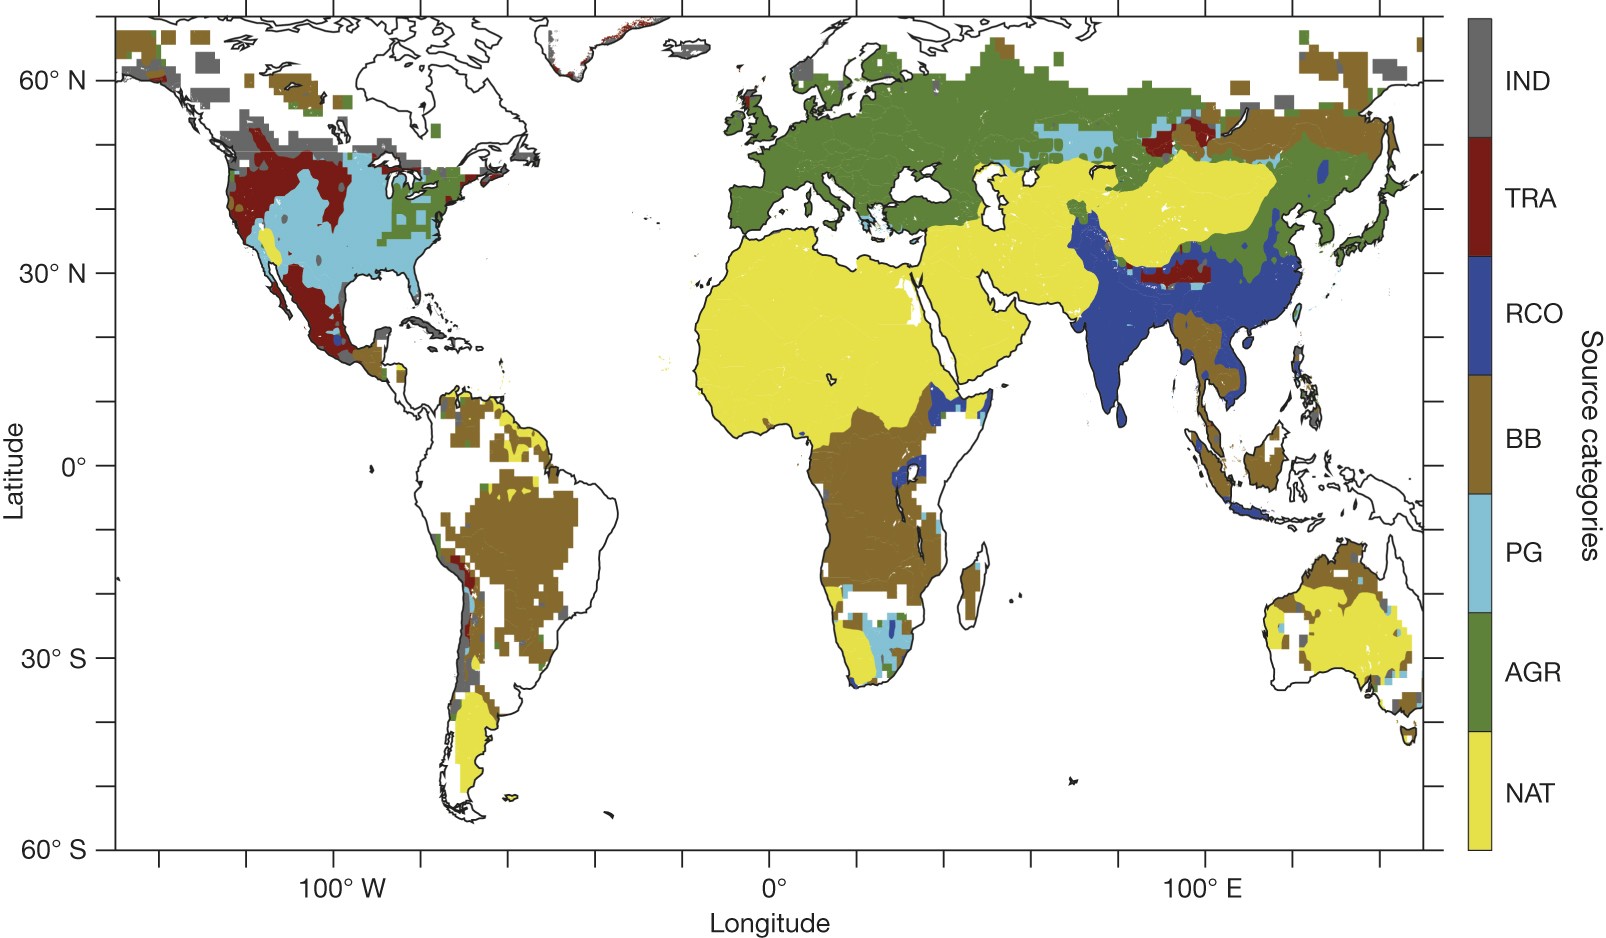
The figure below illustrates the largest source of ambient air pollution-related deaths around the world.[9]
Within each country, there are multiple sources of outdoor air pollution. Each of those sources can be tackled by multiple interventions. Those interventions can be carried out by multiple organisations. To untangle this complex landscape, this report will:
Analyse the impact of air pollution - on health, economic outcomes and climate change (more)
Explore the funding situation within air pollution (more)
Discuss various “impact multipliers” as a framework to evaluate air pollution interventions (more)
Section 1: Size of the problem
Health burden
Mortality
Air pollution is associated with many illnesses, such as respiratory disease[10] (especially chronic obstructive pulmonary disease (COPD)),[11] cardiovascular diseases[12] (especially ischaemic heart disease (IHD)),[13] cancers (especially lung cancer),[14] and stroke.[15]
Exact estimates on all-cause deaths from air pollution vary:[16]
The IMHE’s 2019 GBD Study estimates annual air pollution deaths to be 6.7 million, which breaks down into 4.5 million from PM2.5 & ground level ozone, and 2.3 million deaths from indoor pollution.[17]
The WHO comes to a similar figure of 7 million for 2016 (3.8 million from indoor, 4.2 million from outdoor), combining anthropogenic and natural sources.[18]
Lelieveld et al. (2019) put total deaths at 8.8 million in 2015. They estimate that 5.5 million deaths originate from anthropogenic sources, of which 3.6 million are from the burning of fossil fuels.[19]
To meaningfully use these estimates for a cost-effectiveness analysis, we first need to establish:
How much a given reduction in air pollution is associated with a fall in mortality (i.e. the exposure-response function),[20] and
Whether this association between air pollution and mortality is causal
Based on analysis described in the appendix, we feel comfortable stating that the association between air pollution and mortality is causal, with the exposure-response curve approximated (for our purposes) to a log-linear fit. This implies it is beneficial to reduce PM2.5 at all levels, with only weakly diminishing returns with rising PM2.5.
Neurological impact
Cognition
A 2021 review[21] on the role of PM2.5 exposure in cognitive impairment finds a negative association between air pollution and cognitive ability. In absence of non-observational studies, the reviewers apply the Bradford Hill criteria,[22] and conclude that air pollution is causally associated with cognitive decline.
However, a lack of experimental or quasi-experimental studies leave us unclear about the impact of air pollution on cognition. Additionally, we want to avoid double counting the cognitive costs as both health and economic costs. Therefore, we exclude cognitive costs from the health burden. Instead, we incorporate benefits into the economic impact instead, where there is stronger causal evidence.
Mental Health
Air pollution may also worsen mental health, due to neuroinflammation.[23] We found conflicting evidence about the effect of air pollution on depression.[24] There is less support for a causal relationship here, with a high likelihood of confounding variables. Due to this lack of evidence, and concerns about double counting, we do not include the mental health costs as part of the health burden of air pollution.
Economic impact
Air pollution also has negative flow-through effects on GDP. Worker absenteeism from sickness can mean labour output declines. This absenteeism, along with lower cognitive ability (as mentioned above) can decrease productivity, negatively impacting education and earnings.[25] Air pollution is estimated to cost 3% of GDP in India,[26] 5% in the United States,[27] and 3.3% of global GDP.[28]
Estimating a single GDP figure comes with significant methodological challenges. The economic impact described here excludes both (a) healthcare costs of treating diseases caused by air pollution, and (b) economic gains accruing to polluting industries.[29] Whilst numerous studies have been conducted on the microeconomic effects of air pollution,[30] very limited evidence exists at the macroeconomic level. The evidence that is available comes only from Europe or China. Four quasi-experimental estimates suggest the following:
A 10% reduction in PM2.5 in Europe increased GDP by 0.8%,[31] implying that a 1% reduction in PM2.5 increases GDP by 0.08%.
A 10 unit increase in PM2.5 decreases worker output in Chinese manufacturing by 1%, at a sample mean of 101 μg/m3.[32] This implies that a 1% reduction in PM2.5 increases worker output by 0.1%. If we assume that worker output makes up 50% of GDP,[33] then a 1% reduction in PM2.5 increases GDP by 0.05%.
A 1 unit reduction in PM2.5 increased productivity in China by 0.82%. From this we can extrapolate that a 1% reduction in PM2.5 increases GDP by 0.032%.[34] A different study by the same authors on the same data estimates that a 1% reduction in PM2.5 increases GDP by 0.039%.[35]
A 1% increase in PM2.5 in China decreases GDP per capita growth by 0.058%. (Assuming a fixed population), this implies that a 1% reduction in PM2.5 increases GDP by 0.06%.[36]Averaging these estimates gives an estimate that a 1% decrease in PM2.5 causes an increase in GDP of 0.06%. However, significant caution should be taken before taking this estimate literally.[37] Nevertheless, it seems plausible that the GDP impact is anywhere between 0.01%-0.1%, with many of the best studies we found giving estimates within this range.
For comparison, lead exposure (in total) is estimated to cost 2-4% of GDP in low- and middle-income countries.[38] We can estimate that reducing lead exposure by 1% would therefore increase GDP by 0.02-0.04%.[39] This puts the two problems roughly within the same order of magnitude.
Climate impact
Air pollution and climate change are often discussed in tandem. However, this does not necessarily mean that high pollution indicates high greenhouse gas emissions, or vice versa.
CO2- PM2.5 Correlation
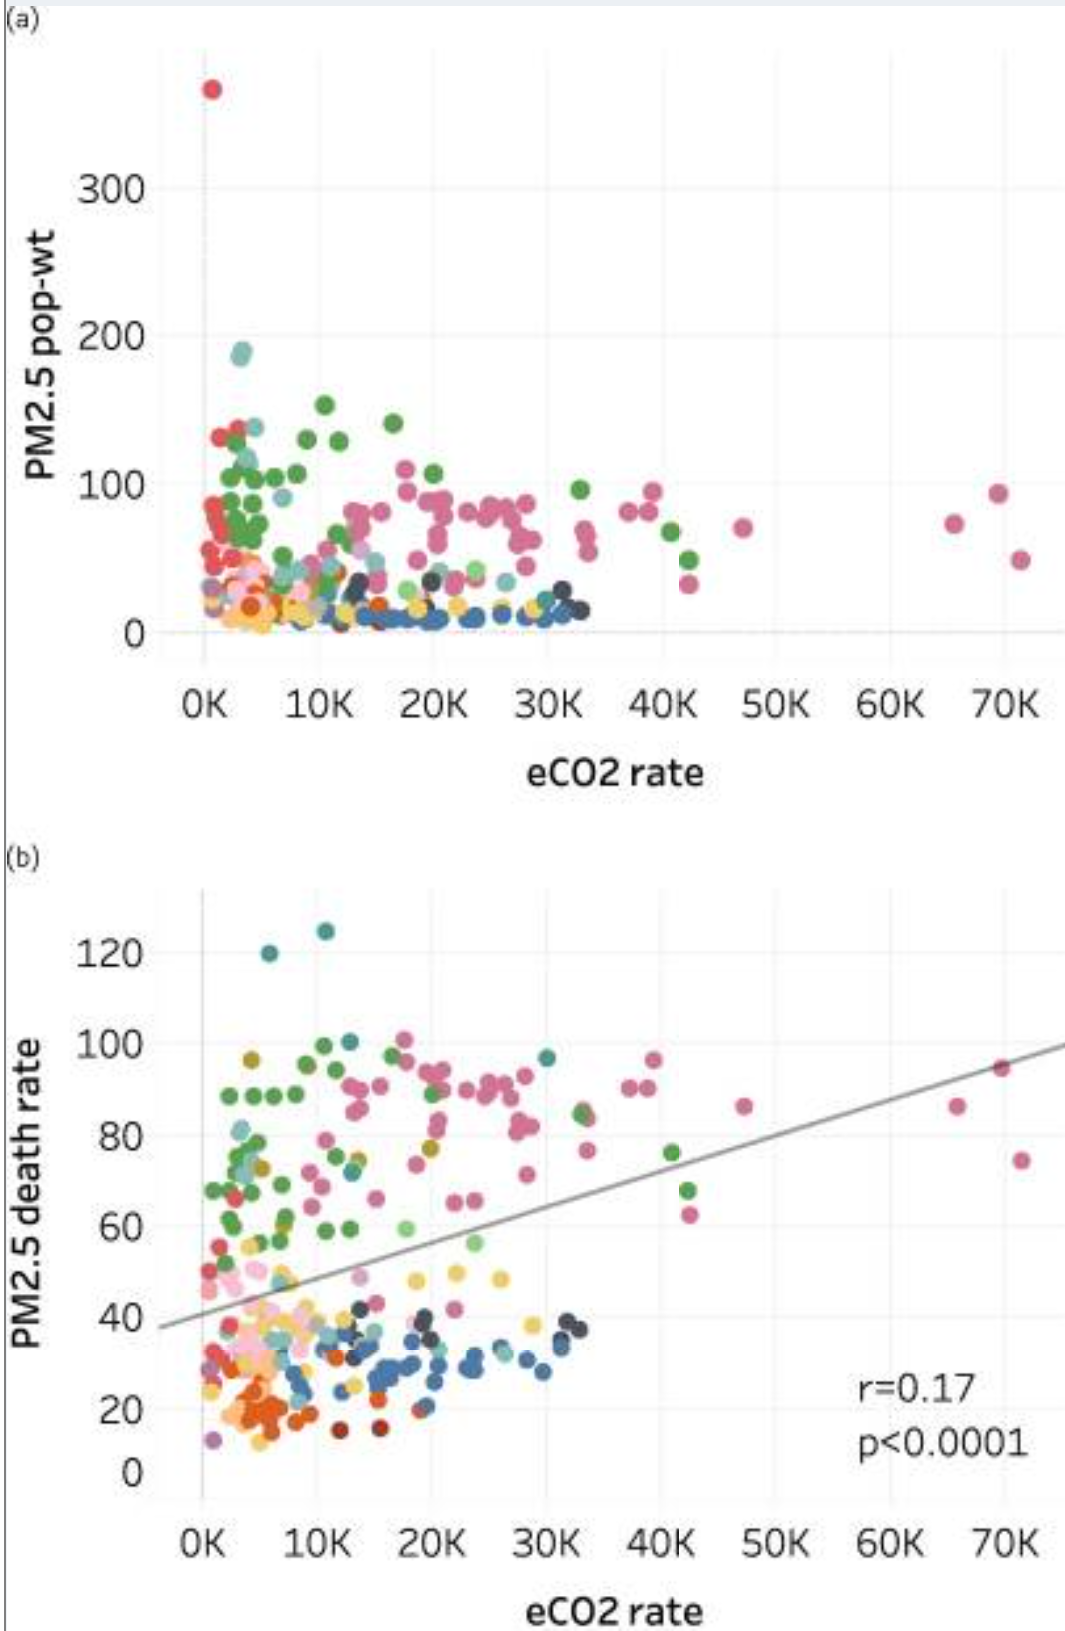
The figure below, from a study analysing the relationship between PM2.5 and CO2, shows no correlation between PM2.5 concentration and CO2 emissions rate, and only a weak correlation between PM2.5 deaths and CO2 emissions:[40]
City-specific estimates of PM2.5-attributable premature deaths per capita in 2016 versus other city indicators.
(a) Population-weighted annual average PM2.5 concentration (µg/m3) vs. annual CO2 emissions rate (t C per 100,000 people);
(b) PM2.5 death rate (deaths per 100,000 people) vs. annual CO2 emissions rate. Colors indicate world regions. Linear regression lines are shown where correlations are significant, r is the correlation coefficient, and p is the correlation significance level.
The authors suggest that the limited correlation between CO2 and PM2.5 can partially be explained by geographic factors:
Many Asian cities are among the highest for PM2.5 mortality rate, but only 10 Asian cities emit more CO2 per 100,000 people than the largest high-income emitters.
Contrastingly, high-income North American cities have low PM2.5 mortality rates but mid- to-high CO2 emissions rates. European and African cities range from low to very high for PM2.5 mortality rates but African cities are relatively low and European cities in the mid-range for CO2 emissions rates.
They propose that this divergence is due to:
Governments in high-income countries (HICs) introducing end-of-pipe emissions controls, which address air quality but not carbon
HICs retiring heavily air-polluting power production (e.g. coal), whilst retaining greenhouse gas emitting power (e.g. gas) with lower PM2.5 output
HICs offshoring highly-polluting industries from HICs to LMICs, where environmental regulations are weaker.
The key takeaway here is that not all PM2.5-decreasing interventions will also decrease CO2 (or vice versa). Therefore, we cannot assume an equal co-benefits rate between CO2 and PM2.5.
Feedback loops between air pollution and the climate make the impact of reducing PM2.5 additionally challenging to estimate. Counterintuitively, fossil-fuel-related air pollution currently prevents about 0.51 C of additional warming from greenhouse gases.[41] The figure below shows that temperatures would increase with the removalof A) all fossil-fuel related particulate air pollution, and B) all anthropogenic emissions.
Temperature changes at the surface from removing particulate air pollution. (A) Due to fossil-fuel-related and (B) due to all anthropogenic emissions.
This is because particulate matter shields the Earth’s surface from additional warming. Warming particles (for example, black carbon) absorb the sun’s heat, whilst cooling particles (for instance, sulphates) reflect the sun’s heat.[42] Removing all air pollution would also increase evaporation in certain regions due to aerosol particles no longer shielding the ocean.[43]
At the same time, greater precipitation can cause natural PM2.5 to fall, which would bring about benefits for different regions. Some quasi-experimental evidence already indicates that higher precipitation could reduce infant mortality in Sub-Saharan Africa, due to less dust storms PM2.5 from the Sahara Desert.[44] On the other hand, higher global temperatures increase the frequency of wildfires,[45] which in turn increases PM2.5 induced mortality from natural sources.[46]
Thus, reducing air pollution has a complex, ambiguous effect on the climate, whilst climate change has differential effects on mortality from air pollution, depending on the region. Therefore, we analyse air pollution based on its health and economic impact alone, whilst evaluating expected climate damages separately.[47]
Section 2: Air Pollution Funding
Funding within Global Health
In 2021, $63.8 million was spent on tackling air pollution by foundations.[48] Whilst this is an increase compared to previous years, this is far less than other global health issues, such as HIV/AIDs ($650 million)[49] or Covid-19 ($28.7 billion).[50] Air pollution receives just $9.57 per death,[51] or $0.30 per DALY.[52] This compares to $75 per death from HIV/AIDs,[53] meaning that air pollution is 7.8x more neglected relative to the burden of disease. Only 0.5% of official development funding, and less than 0.1% of total foundation grantmaking goes directly to tackling air pollution.[54]
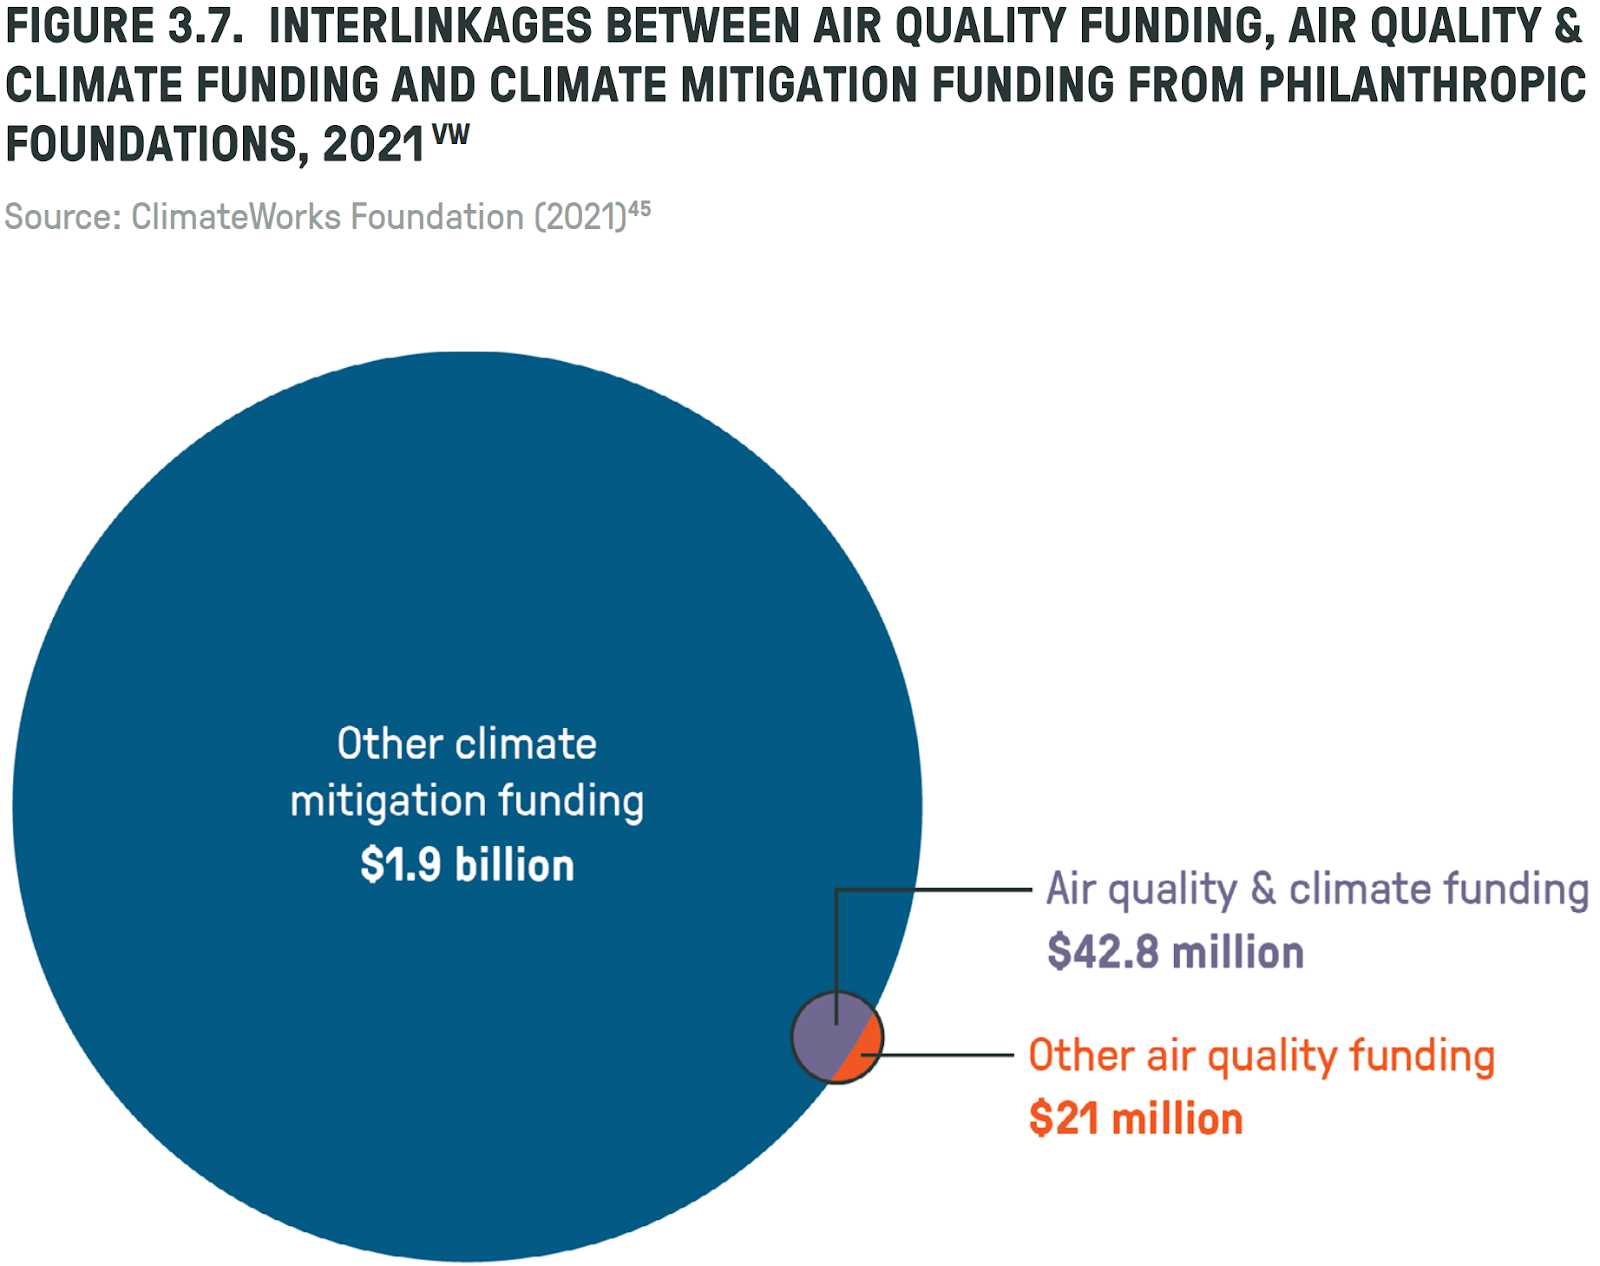
Funding within Climate
The $63.8 million spent by foundations on air quality is dramatically dwarfed by the near $2 billion spent on climate mitigation, suggesting that air pollution is significantly neglected relative to climate philanthropy.[55]
Regional funding disparities
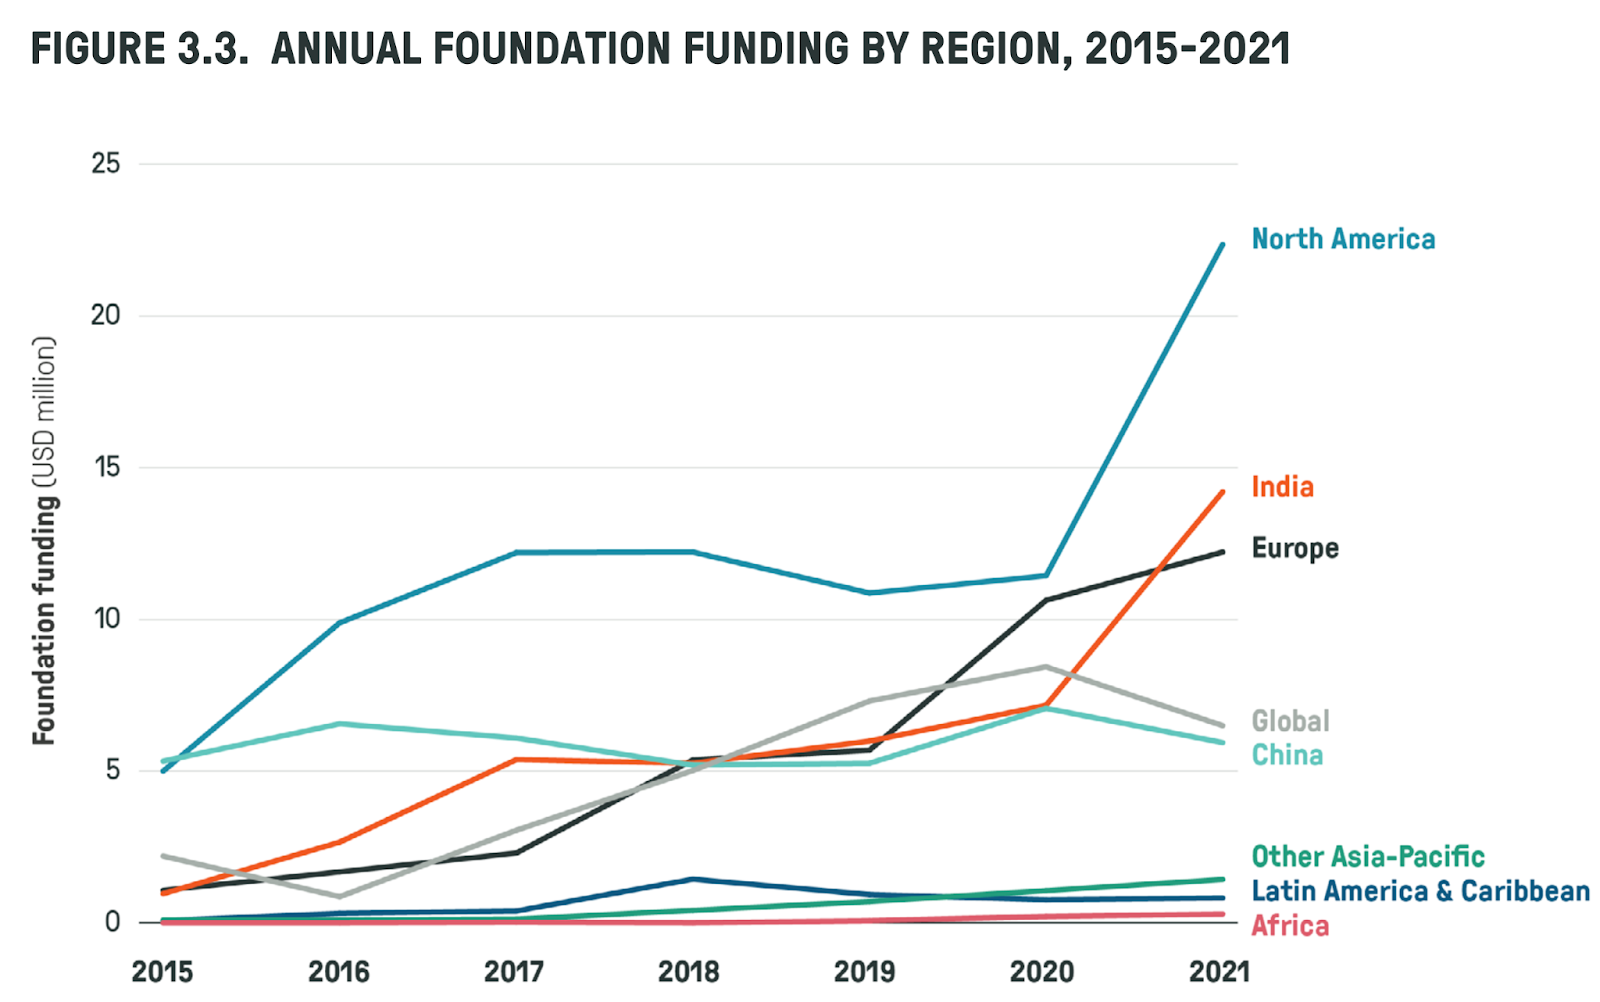
Within air pollution philanthropy, funding is distorted towards higher income countries today, rather than where the problem is set to be its worst in future. For example, North America receives the largest share of funding from private foundations (as shown below),[56] even though the average PM2.5 concentration in North America is below WHO limits.[57]
China has some of the worst air quality in the world, but there are signs that the situation is improving.[58] South Asia has some of the highest levels of air pollution. Consequently, foundation funding to India has increased.
Outside these areas, the funding situation is much worse: Africa, Latin America and Asia (excluding China and India) receive only 3.7% of foundation funding - equivalent to only $2.36 million/year.[59] At the same time, there are an estimated 2.6 million deaths per year from air pollution in this region. This implies less than $1 donated per air pollution death.
For comparison, approximately $14 million was donated to India by air pollution foundations in 2021 - or $8.40 donated for every death.[60]
This implies that Africa, Latin America and Asia (excluding India & China) are 9.3x more neglected (relative to the burden of disease) than India.[64]
Section 3: Impact Multipliers in Air Pollution
Across numerous domains, the very best interventions are not just 2x or 3x better than average solutions, but 10x or 100x better.[65] This gives us a long-tailed prior [66] distribution over the cost-effectiveness of air pollution interventions. With more variables to consider, the length of the tail on this distribution will increase,[67] meaning the differences between the median and best solutions will be greater.
The impact of a given air pollution intervention can vary depending on:
Location targeted- There are around 200 countries, many of which experience air pollution levels above WHO guidelines. Within each country, there are multiple cities one could focus on.
Source targeted - Air pollution originates from transport, industry, households, energy production, biomass burning, waste management and natural dust, to name only the main sources.
Approach taken - Air pollution can be tackled via multiple approaches, such as directly funding solutions, advocating for new policies, advocating for the enforcement of existing regulations, better air quality monitoring, R&D, adaptation, or more.
Pollutant targeted - Pollution comes in multiple forms, such as PM10, PM2.5, PM0.1, NOx, SOx, O3 and CO.
Although this report focuses on PM2.5 (for reasons described above), these other pollutants can further complicate the picture.
Strength of the organisation implementing an intervention - There are multiple organisations who could implement the intervention, each of which vary by experience and ability.
We can draw some preliminary conclusions:
There are a very large number (>1000s) of potential air pollution funding opportunities.[68]
As in other domains, some of these interventions will likely be many times more effective than others.
To find the very best interventions, we need to focus in the most impactful locations, on the most impactful sources, using the most impactful approaches. Correct prioritisation can be a multiplier on our impact. These impact multipliers can be thought of in parallel to our work on strategic climate change mitigation.[69]
Below I outline 10 impact multipliers that apply within air pollution:
The reasoning or intuition for including this factor as a multiplier.
Evidence or data on this multiplier, from which a distribution can be drawn.
What this multiplier implies for intervention prioritisation.
Note that:
Each multiplier is only a heuristic, not a hard-and-fast rule.
Some multipliers are overlapping / not independent - therefore we cannot simply use the product of two multipliers to get the total multiplier effect.
The implication of some multipliers can conflict. For example, interventions in Africa are more neglected, but also less tractable.
Multipliers vary in how well grounded they are in evidence. Some are based upon clearly observable data, whilst others rely more heavily on subjective judgement.
There are many ways to frame air pollution interventions, of which this is only one.
Location multipliers
Mortality
Reasoning/intuition: If we observe that Country A has twice the air pollution mortality rate as Country B, it makes sense to prioritise Country A (all else equal).
Data/evidence: The WHO[70] and IMHE[71] both provide mortality rates from air pollution, which can be used to generate a distribution over mortality rates.
Implication: Focus on countries with the highest mortality rates (e.g. South Asia).
Population density
Reasoning/intuition: For our purposes, improved air quality is not a goal in itself - rather, it is instrumental to reducing the harm that air pollution causes people. The relevant unit of analysis is therefore people, not geography.
Data/evidence to use: Population size/ population density.[72]
Implication: Prioritise cities & urban areas over rural areas.
Population growth
Reasoning/intuition: We should focus on areas where populations are growing fastest, as (holding current population fixed) these areas will contain more people (and hence reducing pollution in these cities will cause greater harm reduction over time).
Implication: Focus on Africa & South East Asia, where urban populations are increasing.
PM2.5 growth
Reasoning/intuition: All else equal, it’s better to focus on regions where air pollution is worsening, rather than improving. This is especially true due to the Environmental Kuznets Curve (EKC)[74]- the hypothesis that outdoor air pollution has historically risen and then fallen with increasing income per capita:
In early stages of development, countries rely on dirtier industry and energy sources to drive growth.
Once incomes have risen, states transition towards more sustainable energy sources and less polluting economic sectors.
London offers an example of the EKC for outdoor air pollution - emissions rose as the city industrialised, then fell as energy sources transitioned and regulations were introduced.[75]
This contrasts with indoor air pollution, where development has uniformly led to falling mortality.[76]
These trends imply that indoor air quality will improve with economic growth.
Implication: The EKC suggests focusing on where the problem is growing - South East Asia and Middle East, and in low income countries, e.g. Africa. Another implication is that one may do better by focusing on outdoor rather than indoor air pollution, since the former is increasing whilst the latter is in decline.[78]
Political tractability by region
Reasoning/intuition: It is better if an intervention has a 50% chance of success rather than a 20% chance.[79] In general terms, we would expect interventions (in particular, policy interventions) to be more effective where civil society has more influence over policy. This is necessary since the main policy lever for funders operates through civil society organisations and through legal challenges
Evidence/Data: An average of proxy indicators for the influence of NGOs over government policy (For example, the democracy index,[80] ease of doing business index,[81] corruption perception index,[82] rule of law index).[83]
Implication: European and North American countries score highly on this metric. Within LMICs, this pushes away from SSA and MENA, and towards some Southeast Asian countries.
Regional neglectedness
Reasoning/intuition: Under the assumption of diminishing marginal returns, we should expect money to go further in less well-funded places. A $1m increase in air pollution philanthropy would raise foundation funding by only 4.4% in North America,[84] but would increase funds by 42% in Africa, Latin America or Asia (excluding China & India).[85] Thus a shift from North America to these more neglected regions could 10x impact (all else equal).
Evidence/data: Data from Clean Air Fund Funding report.[86]
Implication: Focus funding on most neglected regions (Sub-Saharan Africa, MENA, Latin America and SEA).
Source Multipliers
Source affectability
Intuition/reasoning: To provide the greatest benefits, philanthropists should focus on the largest sources of pollution wherever possible. If transport makes up 50% of air pollution and households make up only 5%, then it is 10x more impactful to eliminate pollution from transport than residential sources, all else equal.[87] By “affectable PM2.5,” I refer to the product of (PM2.5 concentration) * (% of PM2.5 emissions from [source]).
Evidence/Data: We can calculate affectable PM2.5 by multiplying data on:
PM2.5 Concentration[88] * % of PM2.5 concentration from [source].[89]
Source neglectedness
Intuition/Reasoning: Under the assumption of diminishing marginal returns, one should fund the most neglected sources of air pollution (all else equal).
Data/Evidence: It is difficult to find a clear breakdown of air pollution funding by source. However, the Clean Air Fund Report notes that:[90]
Foundations with a climate, environment or energy (CEE) focus provided 88% of total air quality funding in 2021…Only 11% of funding was from foundations with an air quality focus area
This suggests that most air pollution funding is currently targeted at energy and other climate-related sources.
Implication: Because climate-related air pollution sources are already highly crowded, we should not aim to fund both CO2 and PM2.5 reductions - since many of the PM2.5 gains from climate are likely already covered by climate funding. In fact, it would be surprising[91] if the best way to reduce future climate damage were also the best way to reduce air pollution damage today, given the differences between the areas described above. Instead, we should focus on interventions with high PM2.5 reductions, andlow CO2 reductions, since these are likely most neglected. For example, regulations on sulphur fuel will have little effect on the climate, but may significantly reduce PM2.5 concentrations.[92]
Approach Multipliers
Policy
Reasoning/intuition: There are likely more benefits to influencing air quality policy than to funding direct interventions (for example, installing air purifiers). This is mainly due to necessity - many of the most effective air pollution interventions require changing or enforcing environmental regulations (rather than more direct, non-policy interventions).[93]
One objection is that policy change work is unlikely to succeed, whereas we can be confident that (e.g. installing air purifiers) will improve air quality with high certainty. However, we assume a position of risk neutrality.[94]As such, policy approaches remain promising if one wishes to maximise expected impact.
Evidence/data: To estimate the relative value of spending on direct interventions, compared to leveraging government spending, one could consider the ratio of foundation funding ($63.8 million) with government funding ($1.5 billion).[95] However, this alone does not factor in how influenceable government funds are. A more complex model would include this and look at country- and source- level funding breakdowns.
Implication: Interventions should aim to change policy. This does not mean that we should just focus on policy advocacy - policy change can occur through better air quality monitoring, more research/development, or adaptation.
Policy readiness
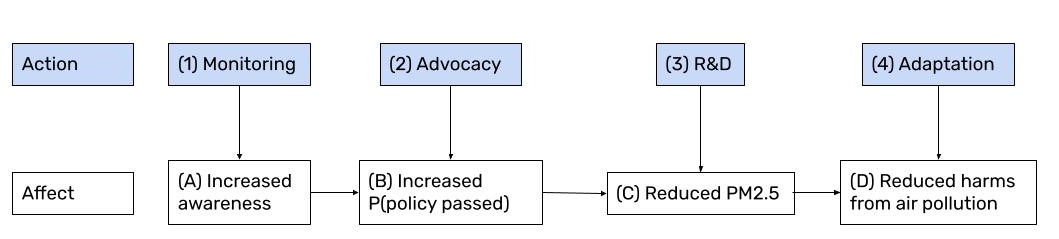
Reasoning/intuition: Consider a basic model of policy change, where we can fund four different interventions, each of which reduces harm from air pollution via action at a particular stage:
Air Quality Monitoring (e.g. low cost sensors),[96] which should (A) raise public awareness, increasing (B) the likelihood of policy change, (C) reducing PM2.5 released, (D) reducing harms from air pollution.
Policy Advocacy, (e.g. lobbying for scrubbers on coal power plants),[97] increasing (B) the likelihood of policy change, (C) reducing PM2.5, (D) reducing air pollution harms.
Research & Development (e.g. clean energy innovation),[98] (C) reducing PM2.5 released, (D) reducing air pollution harm.
Adaptation (e.g. air purifiers),[99] reducing exposure, which (D) reduces harm from air pollution. In this model, we need to decide which stage in the policy process it is most appropriate to act in:
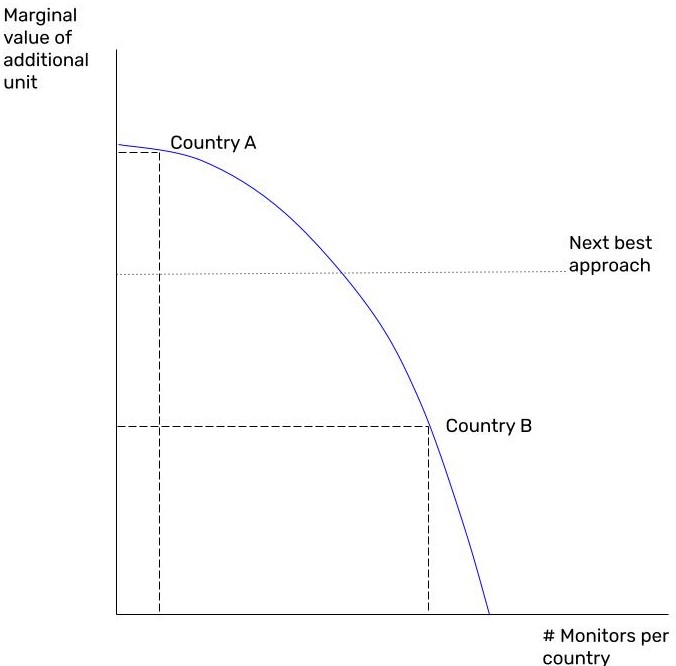
For example, if no air pollution monitoring is occurring in Country A, then there is high information value to setting up the country’s first air quality sensor network. Thus, we would focus on monitoring in Country A.
Now suppose Country B has a high-resolution sensor network already set up. In this case, there is less marginal value to monitoring, due to diminishing returns to monitoring.
Instead, it may be better to pursue another approach (advocacy, R&D or adaptation) in Country B.
This example illustrates that the approach we take to policy change should vary from country to country.
Evidence/Data: There is no cleanly-defined measure of “policy readiness” for each country, and hence this multiplier relies more heavily on subjective judgement. However, we can observe some general trends, such as on monitoring:
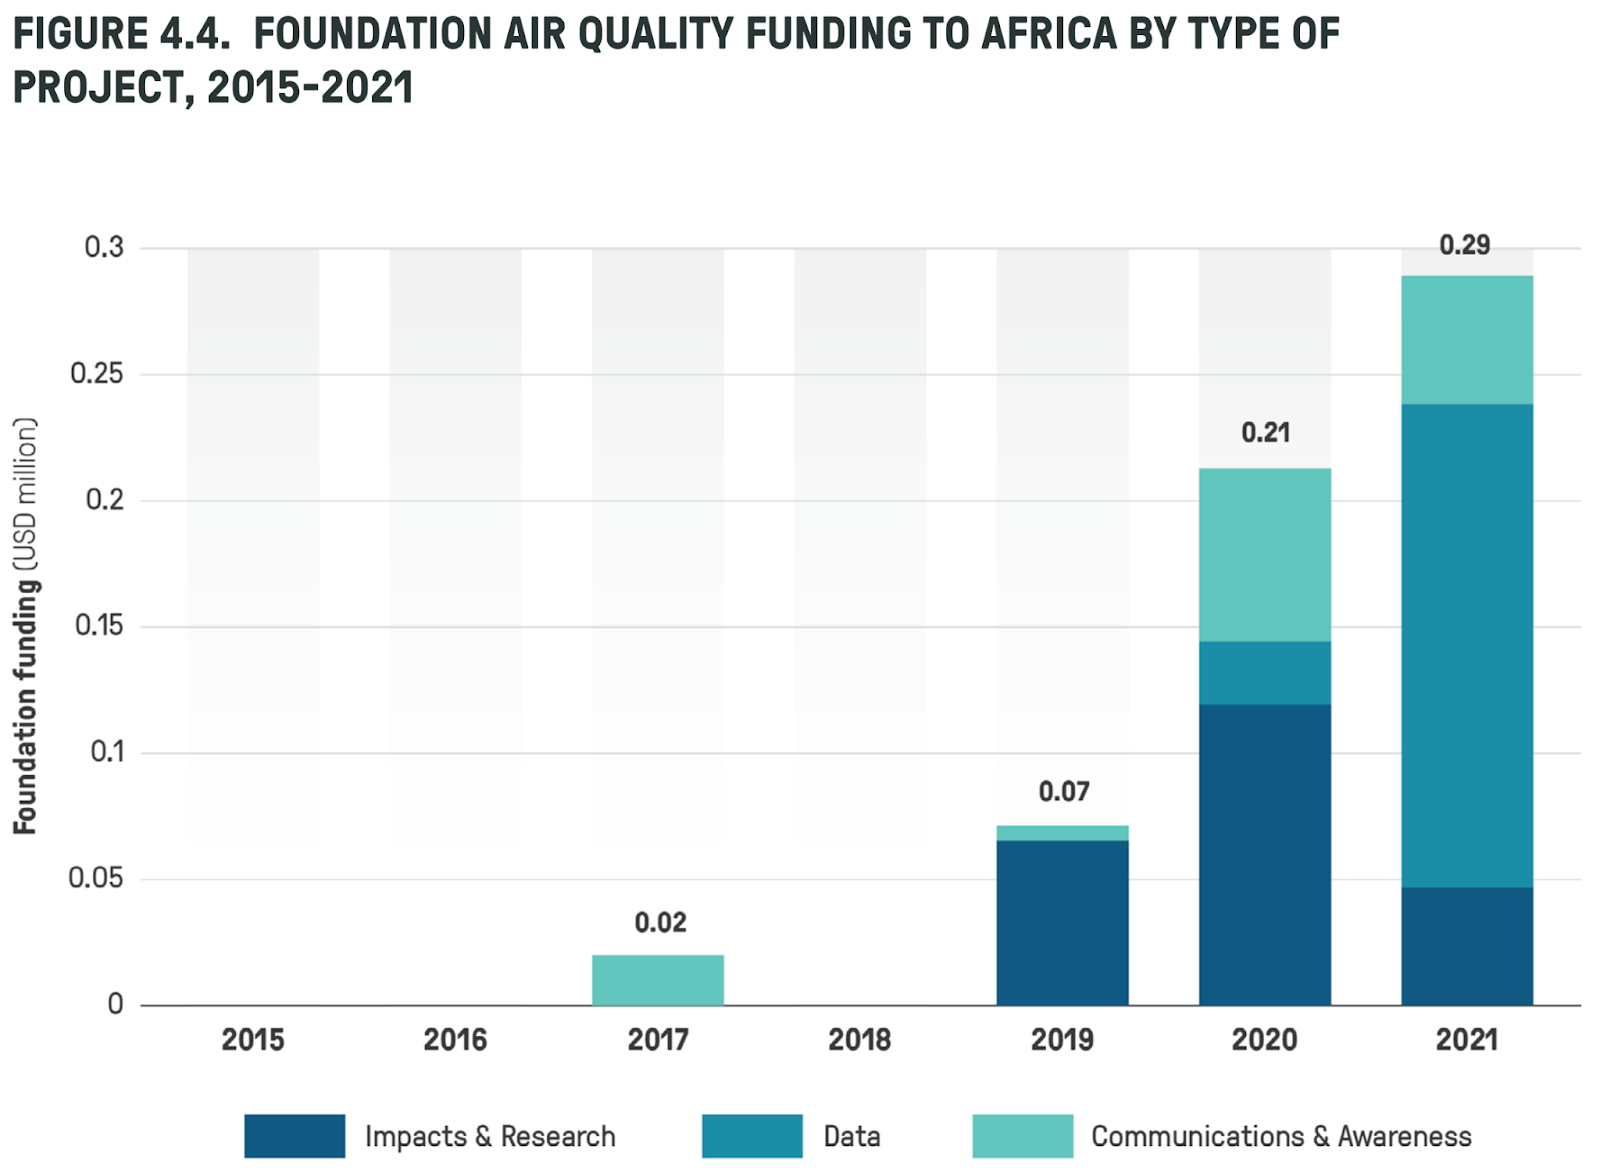
“Between 2015 and 2020, spending on data in Africa was approximately $40,000, compared to $4.2 million in Europe and $3.6 million in India”.[100]
Air pollution funding in Africa has only picked up very recently (and remains very low), suggesting that most African countries are less ready for advocacy, with attention instead on data monitoring, research and raising awareness,[101] rather than advocacy.[102]
Implications: As a general rule of thumb, later-stage theories of change should be pursued in countries with higher economic development. That is:
For less economically developed countries, where emissions have not yet peaked, it's better to focus on monitoring how large the problem is - since in these countries, monitoring networks are often not well established. Sub-Saharan Africa is an example of such a region.
Policy advocacy is often best in countries where the problem is peaking. In these countries, we are aware of the scale of the problem (due to monitoring), but we need action from governments. South Asia is an example of this.
In high-income countries with declining air pollution, it is more viable to invest in R&D to achieve further air quality gains (with externalities for lower income countries). This is likely worthwhile in Europe and the US.
Takeaways
These multipliers are sometimes confusing and contradictory. It seems like focusing on Africa is better due to its population and emissions growth, yet policy advocacy is less feasible. Despite this complexity, we can observe five key takeaways:
This suggests a focus on Sub-Saharan Africa, and where there is relatively less climate funding
This means prioritising areas where civil society influence is strong, and opposition is weak
Prioritise policy, especially at the stage most appropriate for a country’s development.
This suggests targeting government regulations, via better monitoring and advocacy
Conclusion
In summary, air pollution remains a neglected issue, relative to its importance. South East Asia, Middle East, Sub-Saharan Africa and South America are particularly neglected regions - yet these areas are set to see their emissions grow.
Donors and foundations looking to maximise impact should focus their attention on policy change within these regions, via better air quality monitoring and advocacy.
About Founders Pledge
Founders Pledge is a community of over 1,700 tech entrepreneurs finding and funding solutions to the world’s most pressing problems. Through cutting-edge research, world-class advice, and end-to-end giving infrastructure, we empower members to maximize their philanthropic impact by pledging a meaningful portion of their proceeds to charitable causes. Since 2015, our members have pledged over $7 billion and donated more than $700 million globally. As a nonprofit, we are grateful to be community-supported. Together, we are committed to doing immense good. founderspledge.com
Appendix: Health burden of PM2.5
There are two challenges to estimating the health impact of PM2.5:
The shape of the association between PM2.5 and mortality.
Drawing causal inference from this association.
We conclude that the exposure-response curve described by Vodonos et al[103] most accurately describes the shape of the PM2.5-mortality association, and that this association is causal.
1. Exposure-response function shape
The exposure-response function plots levels of exposure to PM2.5 against different levels of relative risk (RR) to contracting a disease.[104] Relative risk levels can be converted into population attributable fractions (PAFs), which can attribute deaths and DALYs from various diseases to air pollution.[105] Estimating the exposure-response function is difficult, particularly for high levels of PM2.5, where less studies have been conducted. It is unlikely that such a function is linear, since this would lead to implausibly high relative risk levels (RR >>2) at high levels of PM2.5.[106]
To fill the gaps in data at high ambient PM2.5 concentrations, Burnett et al use an integrated exposure model (IER), which combines various PM2.5 estimates from ambient pollution, indoor pollution, smoking, and other sources, to give a fuller range of estimates.[107]
Using the corresponding relative risk levels, they construct population attributable fractions (and hence death and DALY estimates) for all countries. This underpins the data used by the WHO. The IER is considered a superior fit to seven other functions, as explained in the paper.
However, more recent studies in high PM2.5 countries have been conducted. Subsequently, Vodonos et al published a meta-analysis using over 135 estimates of the PM2.5-mortality relationship, from over 50 studies.[108] They provide both a parametric and non-parametric (penalised spline) model. For simplicity, the parametric model was used.[109]
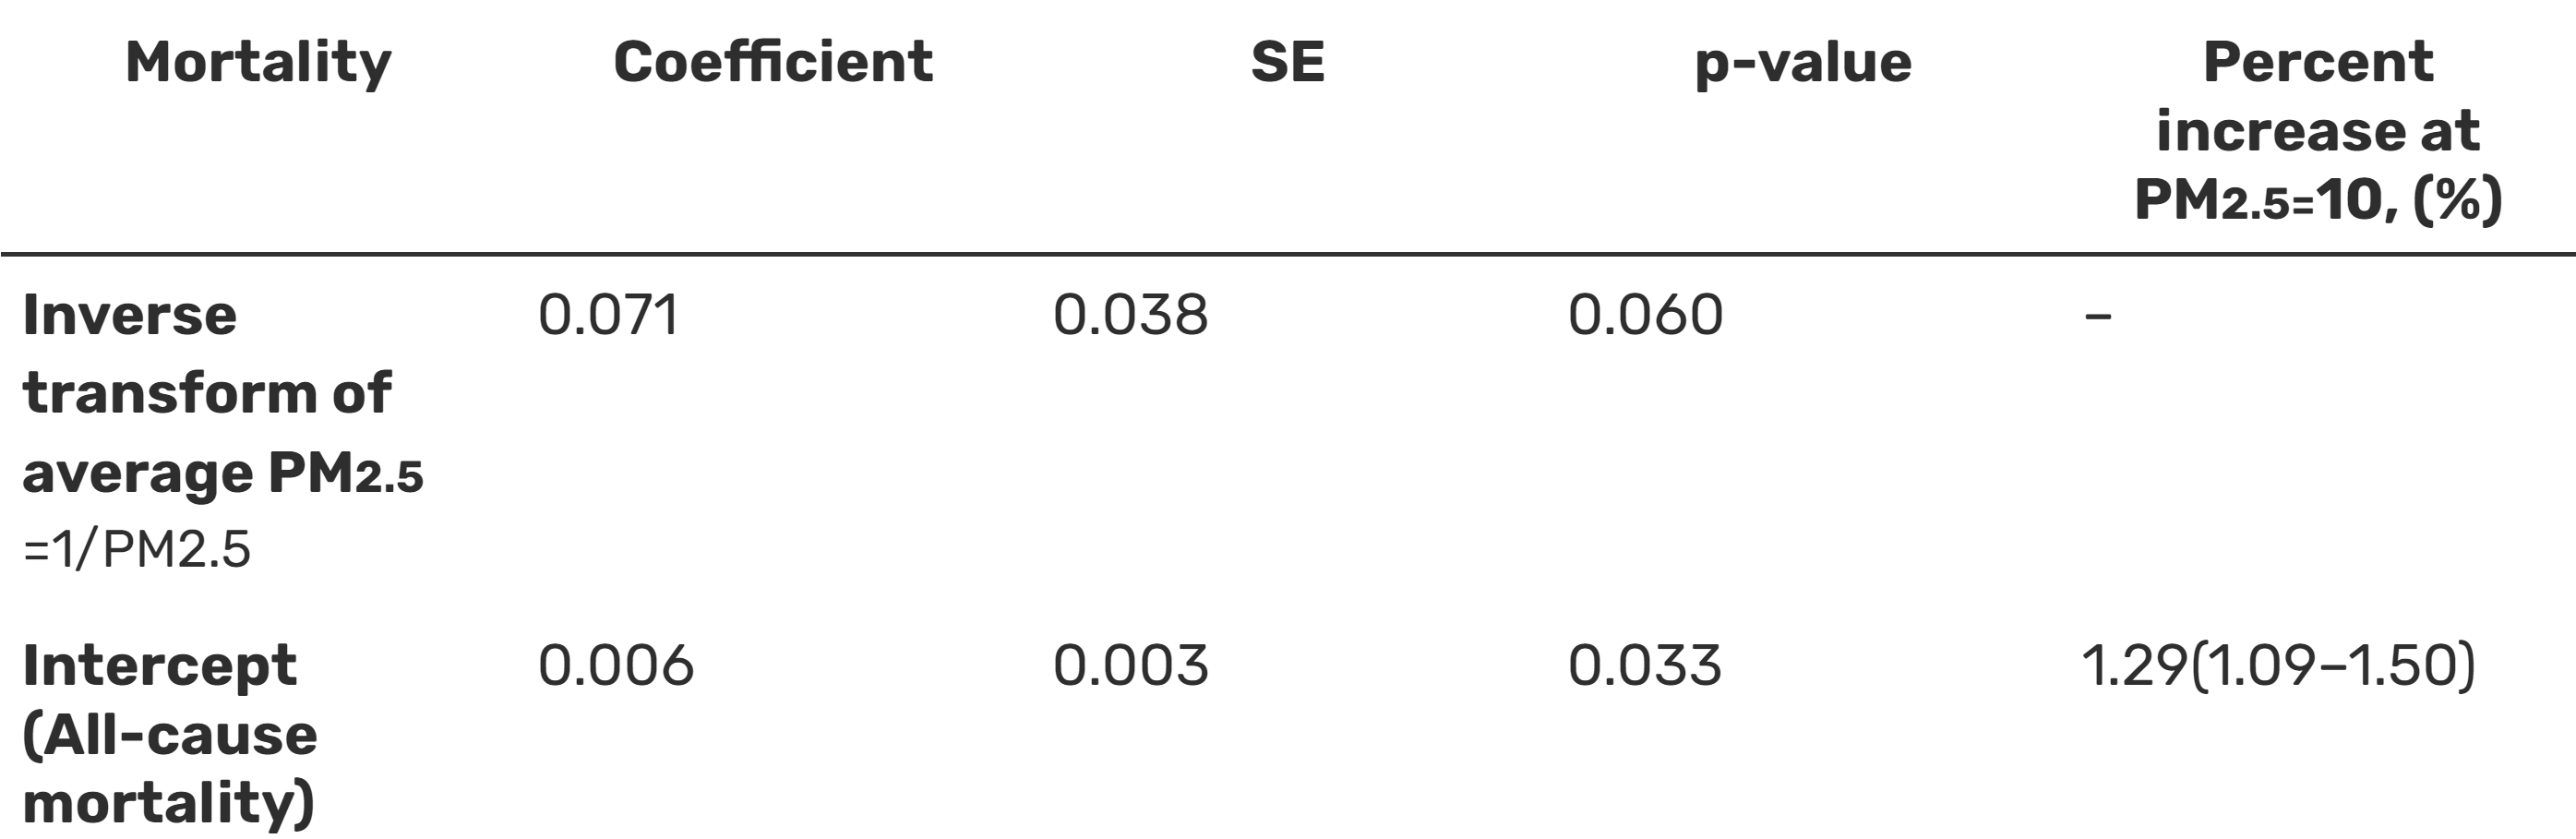
Table 5 shows Vodons et al's meta-regression from the parametric model:
From this we can generate the following function:
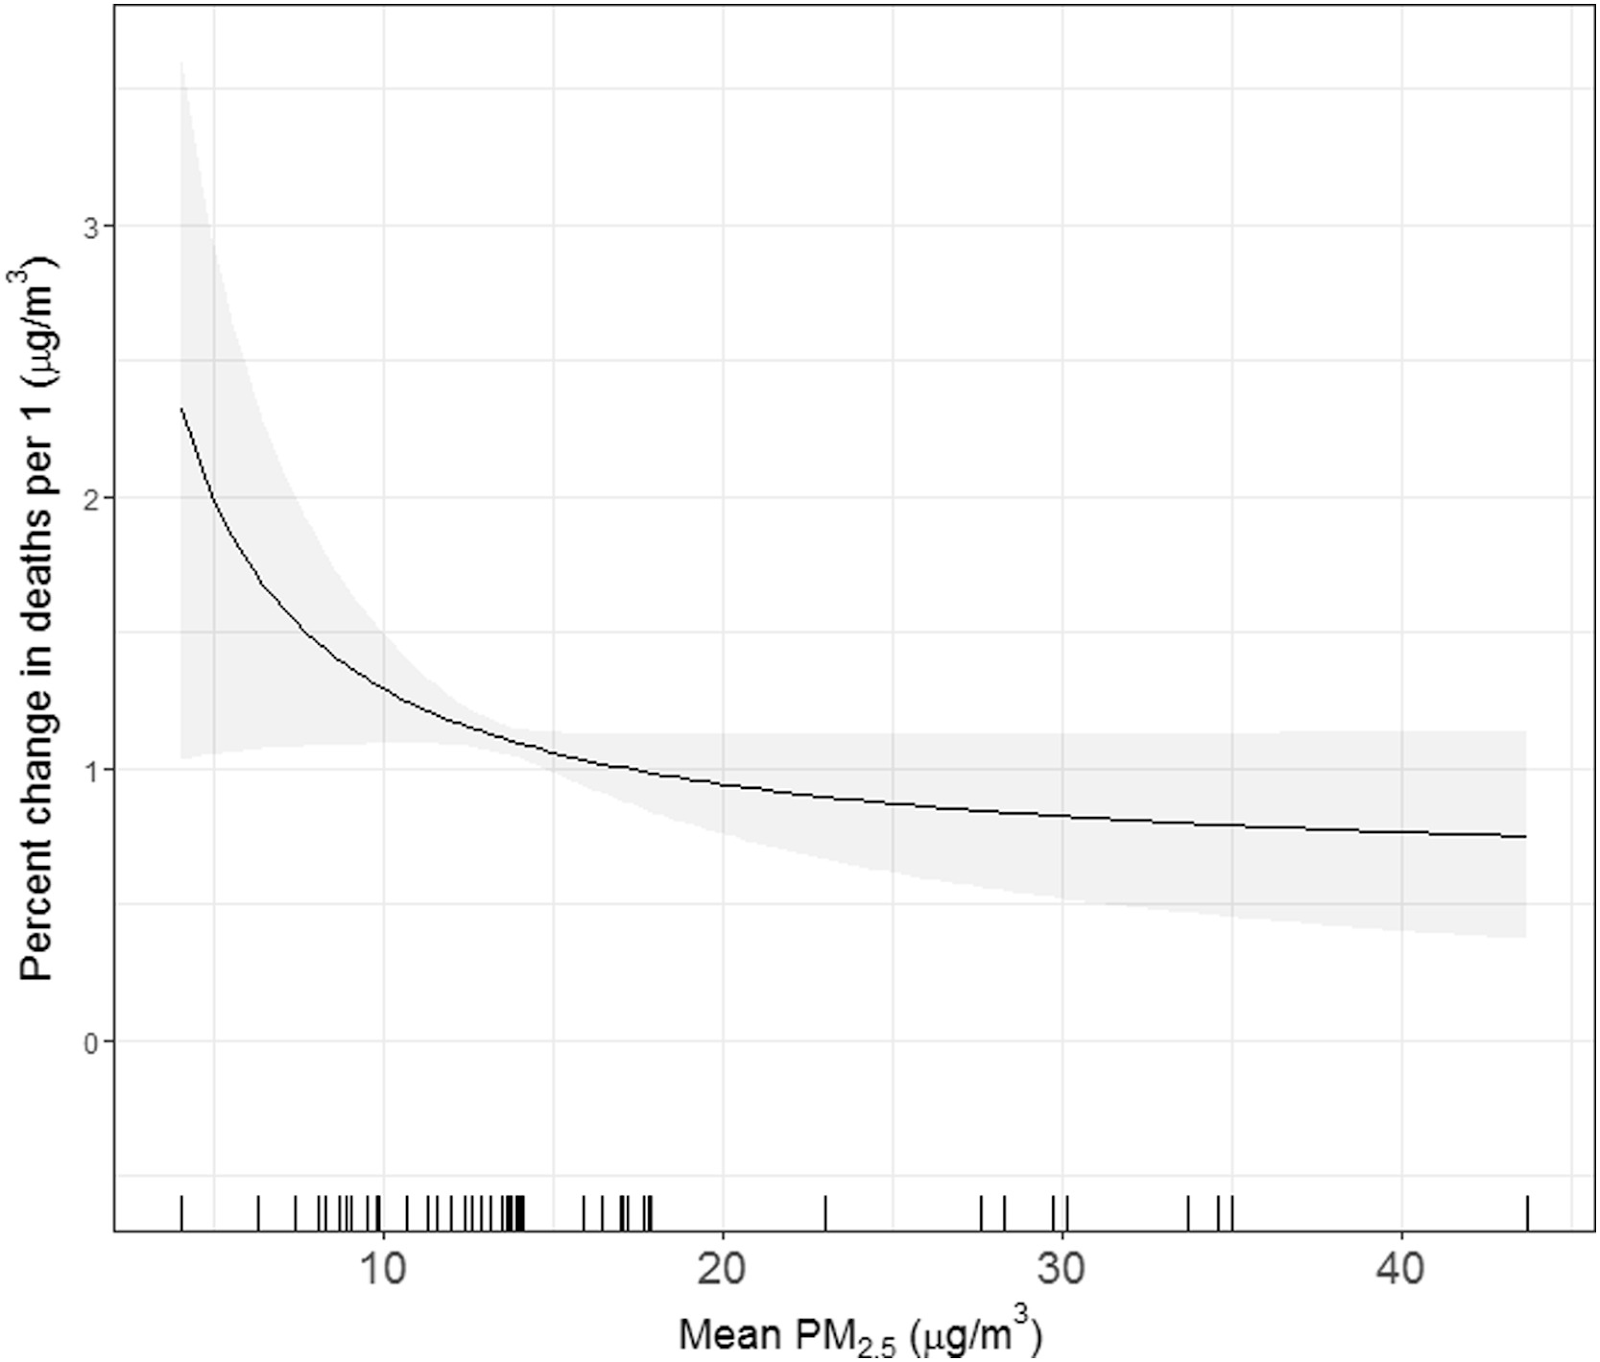
We can interpret the following from this: At 10 μg/m3, a 1μg/m3 increase in PM2.5 leads to a 1.29% increase in mortality, as shown in the diagram below
Meta-regression analysis of long-term PM2.5 exposure and percent change in mortality.
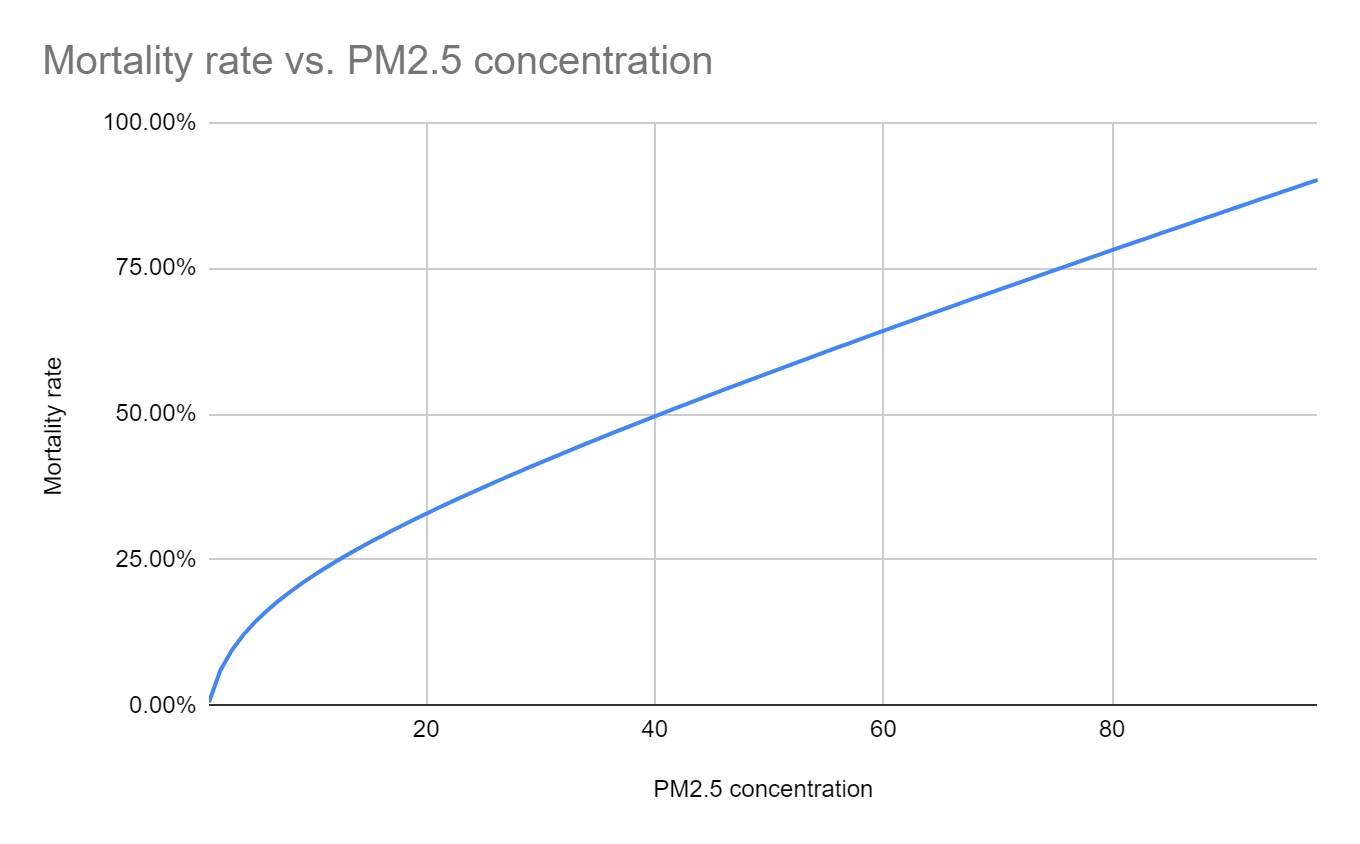
This function tells us the mortality rate from a 1 unit change in PM2.5. To convert this to the mortality rate for any change in PM2.5, we use the function
This is a logarithmic relationship between PM2.5 and mortality at low pollution levels, but tends to a linear relationship for very high PM2.5 levels - as illustrated below
Change in mortality rate from a given change in PM2.5.[110]
2. Causality and Attribution
Our research reviewed two approaches to establish a causal relationship between fine particulate air pollution and health costs.
The first approach, explained above, used exposure-response functions. These converted PM2.5 concentrations into relative risk (RR) ratios and population attributable fractions (PAFs), from which we could attribute deaths and DALYs to air pollution.
However, attributing deaths and DALYs to air pollution is not necessarily the same as air pollution causing deaths and DALYs. Issues of confounding variables and reverse causality may be at play (as one example, people with lower incomes may both live in highly polluted areas and have worse health outcomes). This concern has been raised in recent literature.[111]
On the other hand, this concern is not widely shared. A 2012 review finds “biological plausibility” of causal associations.[112] Core to discussions of causality in epidemiology are the Bradford Hill criteria, a set of nine criteria to provide epidemiologic evidence of a causal relationship.[113]
A more robust approach is to draw causal inference from natural experiments using instrumental variables and difference-in-difference techniques. Coefficients can then be extrapolated to a generalised form. Studies which do this have found the following:
A 10mg/m3 increase in PM2.5 increased infant mortality by 22% in sub-Saharan Africa.[114]
A 1 μg/m3 decrease in PM2.5 reduced deaths by 7.17 per 100,000, amongst medicare recipients in North-East America.[115]
A 10μg/m3 increase in PM2.5 increased daily deaths by 1.54% in US cities.[116]
However, the limited number of natural experiments means any extrapolation is limited. Coefficients lack robustness, almost exclusively focusing on specific groups in particular countries, rather than giving an overall average across PM2.5 levels.
Thus, both approaches have advantages and disadvantages. The former approach suffers from concerns about confounders, whilst the latter suffers from a lack of generalisable evidence. The crux is whether to rely on causal inference from epidemiology. If so, then we can interpret association coefficients as estimates for effect sizes. If not, then only natural or quasi-experimental evidence can be used. Due to methodological uncertainty and the relative lack of studies using the potential outcomes framework, we pragmatically use the attribution approach.[117] Thus, we use Vodonos et al’s paper as the foundation for our estimates on the health impact of PM2.5.
Estimates vary wildly on the total burden of disease. These figures are from the GBD Study (Enter Risk: “Particulate matter pollution”, Cause: “All Causes”). A more thorough data review can be found at Our World In Data. Graphic source: Death rates from air pollution, 2019 (OWID)
WHO Air Quality Guidelines : “PM2.5, fine particulate matter of 2.5 micrometres or less in diameter, is the most dangerous pollutant because it can penetrate the lung barrier and enter the blood system, causing cardiovascular and respiratory disease and cancers. It affects more people than other pollutants and has health impacts even at very low concentrations.”
“Around 2.6 billion people cook using solid fuels (such as wood, crop wastes, charcoal, coal and dung)... 3.8 million people die prematurely from illness attributable to the household air pollution caused by the inefficient use of solid fuels and kerosene for cooking” Household air pollution and health
Air pollution. “The WHO estimates the total death toll to be lower than the sum of indoor and outdoor pollution deaths. This is because the deaths from risk factors are not summable. As the authors explain: “Some deaths may be attributed to more than one risk factor at the same time. For example, both smoking and ambient air pollution affect lung cancer. Some lung cancer deaths could have been averted by improving ambient air quality, or by reducing tobacco smoking.”4 Similarly the death of a particular person could have been averted by reducing the indoor or outdoor air pollution” (Roser (2021))
A 2022 systematic review and meta-analysis suggests that “Increased long-term exposure to PM2.5 and NO2 is associated with depression”, whilst 2019 systematic review of 22 studies finds that “Long-term PM2.5, PM10, and NO2 exposure is not associated with depression.” [emphasis added]
Further research is required to more conclusively resolve which effect dominates the other. This is a concern since effect sizes may be biased in an unknown direction. To comprehensively account for this, one would need to estimate the economic cost of treating air pollution, and the value of goods & services produced by polluting industries.
The State of Global Air Quality Funding 2022 : “In 2021, total philanthropic air quality funding rose by 36% to an all-time high of $63.8 million, but remains less than 0.1% of total philanthropic spending.”
The State of Global Air Quality Funding 2022: “Africa, Asia (excluding India and China) and Latin America only received a combined 3.7%.. Foundation funding totalled $63.8m in 2021”. 3.7% * $63.8m = $2.36 million
The State of Global Air Quality Funding 2022: “Africa, Asia (excluding India and China) and Latin America only received a combined 3.7%.... Foundation funding totalled $63.8m in 2021”. 3.7% * $63.8m = $2.36 million ↩︎
For example, 10 global regions x 10 countries per region x 10 cities per country x 2-5 sources per city implies 2,000-5,000 funding opportunities. Multiple organisations may be able to execute on those opportunities, with each taking a different approach.
For instance, some of the most effective air quality improvement seen in high income countries has been a result of policy regulations, rather than direct interventions (e.g. UK Clean Air Act, US Clean Air Act).
This is not to say that increased advocacy would not be beneficial in Africa. However, advocacy efforts are more likely to pay off _after _monitoring, because a) Advocates will have a better data on where air pollution is coming from, making their advocacy more effective; and b) Governments will likely pay more attention to advocacy efforts if there is clear data to demonstrate that air pollution is a serious problem.
However, the penalised spline model would in fact provide a closer fit to the data. Thus, further research could use this function to better convert PM2.5 levels into mortality
See Goodman et al (2021): “Causal inference regarding ...PM2.5 and mortality estimated from observational studies is limited by confounding, among other factors”, or Schwartz et al (2018): “Studies have long associated PM2.5 with daily mortality, but few applied causal-modelling methods”.
Health Effects of Fine Particulate Air Pollution: Lines that Connect “Clear biological effects of PM exposure have been observed...None of these pathways are definitively demonstrated to be the pathway that clearly and directly links exposure of ambient PM pollution to cardiopulmonary morbidity and mortality… it is unlikely that any single pathway is responsible. There are almost certainly multiple mechanistic pathways with complex interactions and interdependencies… Although much remains to be learned, it is no longer true that there are no known pathophysiological or mechanistic pathways that could plausibly link PM exposure with cardiopulmonary disease and death.”
COMEAP: long term exposure to air pollution: effect on mortality “... the associations reported in the literature of this field are likely to represent causal relationships with air pollution... although we accept that there is a small possibility that some or all of the reported associations represent the effects of some as yet unidentified confounding factor or factors… We accept that the mechanisms underlying these effects are not yet fully understood but we think that the evidence that the main effects bear on the cardiovascular system is persuasive. The recent paper by Pope et al (2004)... sustains us in reaching this conclusion.”


Adding to the causal evidence, there's a 2019 paper that uses wind direction as an instrumental variable for PM2.5. They find that IV > OLS, implying that observational studies are biased downwards:
They also compare their results to the epidemiology literature: