Summary
I tried to estimate the total yearly dollars that are aligned with EA, specifically through the lens of the four cause areas, the thought being that I should direct my personal funds to whichever I feel is most underweight. Questions:
- What do you all think would be an ideal split amongst the cause areas?
- Do you disagree in general with the strategy of allocating my personal donations on the basis of where I expect to differ the most from the community regarding #1?
- Do you feel that the numbers I'm using are misrepresentative? I will do my best to address limitations below.
Data and limitations
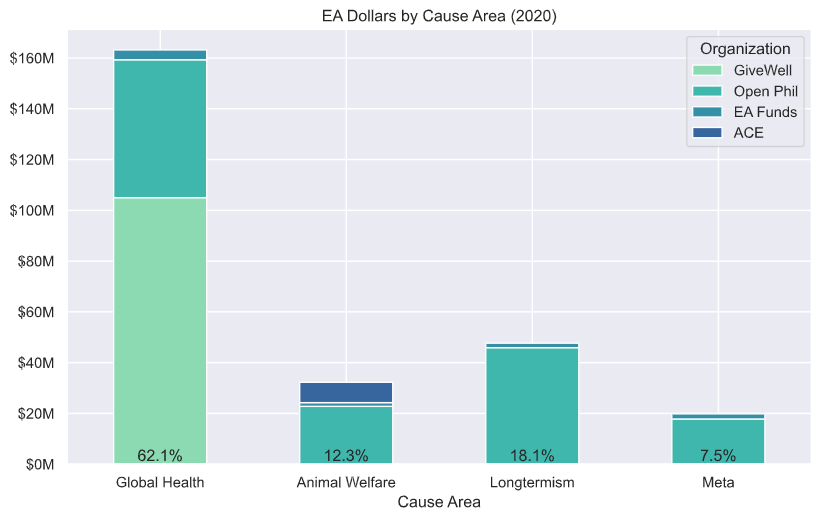
Looking at global funding of EA causes in 2020, the best (relatively quick) estimate I was able to produce is about $263M with a 62/18/12/8 cause area split , as shown in Figure 1. I will briefly touch on where this data comes from, and some of its limitations:
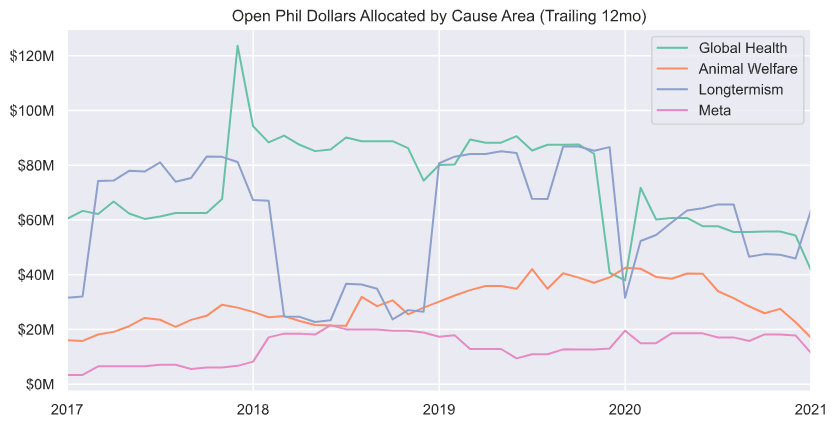
- Open Phil data comes straight from their Grants Database. They categorize slightly differently, but I mapped each grant to the appropriate cause area (and omitted ~36% of grant dollars which didn't belong in any of the four). There is an obvious distinction here in that these grants do not reflect the choices of small individual donors in the EA community. However, Open Phil accounts for more than half of the total funding in this sample, and the cause area breakdown is both fairly predictable and extremely transparent (see Figure 2).
- GiveWell estimate comes from their annual Metrics Report (projected from latest figures published, omitted overlap with Open Phil). This includes donations made directly through the GiveWell entity, as well as other orgs explicitly acting on their research.
- EA Funds provides exact intake figures at their website.
- Animal Charity Evaluators estimate based on their Metrics Report and some discussion here.
Limitations:
- Using cause areas as bins is a useful model, but in practice there is much more nuance. My guess is that there is a lot of funding adjacent to the 'Global Health' EA bin (e.g. Bill and Melinda Gates Foundation), but hardly any adjacent to 'Longtermism'.
- Each bin itself is an imperfect estimate. It would be great if there was some comprehensive source of movement-level statistics.
- Targeting a percentage split by cause area is overly simplistic. Ideally there should be some comparison of [current, relative] opportunity, though it would be very difficult to compare GiveWell-style across bins. Furthermore, if total funding were to increase 10x I wouldn't expect each bin to scale proportionally (e.g. Meta much smaller).
Thoughts
As an individual donor, I am somewhat opposed the idea of impact diversification, or giving to more than one charity for that matter. However, on a macro level I certainly value each of these cause areas, and would expect each to consist of many distinct interventions. So where does that leave me? Should I just pick the one charity that I think is highest EV of all? Should I just split to reflect my uncertainty as to which cause is most effective? I tend to think of each cause area as more or less orthogonal, and very difficult to cross-compare. The way I see it, the best I can do is try to identify the most underfunded space on the margin, and give there.
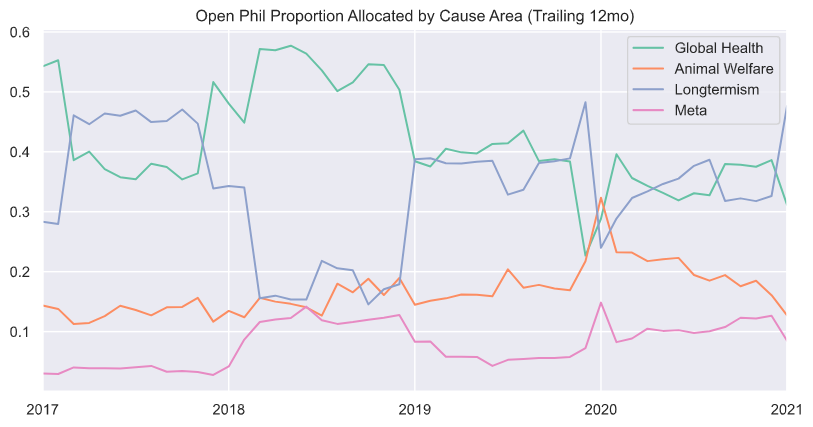
I am still pretty unsure of how to assign relative value to these four bins, but my tentative opinion is that if I were starting from scratch with $263M, I would want to split something like 40/30/20/10 to Global Health, Longtermism, Animal Welfare, and Meta, respectively. This closely resembles the recent choices made by Open Phil (Figure 3), however GiveWell adds a lot of weight to Global Health. Based on the true splits estimated in Figure 1, unless convinced otherwise, I will likely do all of my personal giving via the Animal Welfare/Longtermism EA Funds this year.
Thanks for writing this post and for the great graphs!
One relevant thought regarding OpenPhil, my understanding is that they could have expanded their work within each cause area but they are not giving more because they don't have opportunities that seem better than saving the money for next years (even though they want to give away the money early), or because they have self-enforced upper bounds to give opportunities to other philanthropists (so they don't donate to GiveWell more than half of what they get by donations).
[I'm sure that the previous paragraph is wrong in some details, but overall I think it paints the right picture. I'd love to be corrected, and sorry for not taking the time to verify and find supporting links]
Personally I give mostly to animal welfare, on the ground that it is comparitively neglected within the movement, and even more neglected in the larger philantropic world. Your data seems to confirm my intuition on that score.
One could say thatlong-termism is also neglected, but I am not convinced of the effectiveness of long-termist charities. (I should say I have not looked deeply into it.)
Cool post, I enjoyed seeing these numbers like this. I share your takeaway that global health seems more overrepresented than I expected.
"Do you feel that the numbers I'm using are misrepresentative?" One consideration here is whether the appropriate figures to consider are "EA funding" or "all funding." What's the case for the former? Just that you expect EA funding to be substantially more cost-effective? Maybe. But even then you'd ideally include non-EA funding with some sort of discount, e.g. each non-EA dollar is only counted as 0.5, 0.1, or 0.01 EA dollars. I appreciate also that EA dollars are easier to count.
I was thinking along very similar lines with 'Limitations' #1. It would be much better to model this as a contribution function in four dimensions, rather than only counting 'EA dollars'.
Not only would this require more data, but one would need to assign a multiplier to each separate intervention à la GiveWell moral weights. What fraction of a 'Global Health' dollar is counted when Bill Gates funds vaccine research? Could be interesting for future work.
Another would be to add up the budgets of all EA and EA-recommended organizations (or EA-recommended programs).
You might be able to use donation data from the EA Survey, to better capture individual EA giving.
One issue is that a lot of these areas have very large individual donors that aren't captured by these statistics or even in the EA Survey - for example, there is an individual donor who gives about the same annual amount to animal welfare as all of OpenPhil. (But then of course, there is also the question of who counts as "EA".)
~
I imagine your personal views about the difference in the value of cause areas will dominate this, given that causes might be 10x different whereas these gaps are only 5x at most.
Also I think the choice of what you are funding within each cause also matters a lot.
I think this approach makes sense from a neglectedness standpoint, though I am worried that it wouldn't account for neglectedness outside of EA and neglectedness within cause. I'm not sure if this makes sense from a donor collaboration/coordination/cooperation standpoint, given that it seems like you are deliberately offsetting other people's donations.
"Cause area" is also a pretty weird/arbitrary unit of analysis if you think about it.
Thanks for the reply, definitely gives me a lot to consider.
Personally, I quite like the cause area distinction. One alternate definition I might propose is that a cause area is a subset of interventions which are plausibly cross-comparable. Direct comparisons across these cause areas are flimsy at best, and even if I felt strongly that one of them was the most effective, I would still value each of the others receiving non-trivial funding for the purposes of (a) hedging (b) worldview diversification.
It certainly does, but so long as I donate via EA Funds or GiveWell, that decision is passed along to the very most qualified people I know of.
I might disagree here. Using base rate funding to inform decisions is no different than 'neglectedness' as a pillar of EA—If I had to be truly agnostic I suppose I'd give money to climate change, or purchasing COVID vaccines.
That 80k article is very cool, though they also seem to agree: "If the community is unresponsive to what you do, you can (mostly) take a single-player approach to working out the best action."
It would be great to know more about these donors, and specifically which orgs they donate to. It's starting to feel like a satisfactory measure of 'fundedness' would require a lot more future work.
The size of the gaps are dependent on my personal views, so I think we're in agreement here.