Summary
This shallow cause area report explores the impact of lead exposure in childhood on subjective wellbeing (SWB) in adulthood. It was completed in two weeks. We performed non-systematic searches to estimate the impact of lead exposure on SWB and to find potential cost-effective interventions.
We found studies investigating two correlational longitudinal cohorts (following children to adulthood) from New Zealand and Australia analysing the relationship between childhood blood lead levels (BLLs) and adult affective mental health (MHa). Based on this data, our best guess estimate is that an additional microgram of lead per deciliter of blood[1] for each year for ten years of childhood, leads to a total lifelong (62 years) loss of 1.5 WELLBYs, and a larger overall 3.8 WELLBYs loss when we include some guesses about household spillovers. Hence, we estimate that a modest amount of lead exposure severely impacts on wellbeing across the lifespan.
From several back of the envelope calculations, we tentatively conclude that lead-reducing interventions would be 1 to 107 times more cost-effective than cash transfers. Advocacy against lead in paint, food, cookware, and cosmetics seems particularly promising.
The scarcity of causal and context relevant data means that we are very uncertain about the effect and cost-effectiveness of these interventions. But, given the potentially high cost-effectiveness, we think this is a promising area for additional research. We especially encourage further research into the causal relationship between lead exposure and SWB and the most common sources of lead exposure to reduce uncertainty about the cost-effectiveness of lead interventions.
It’s unclear if the top organisations working to reduce lead exposure, like Pure Earth or Lead Exposure Elimination Project (LEEP), have sizable funding gaps. Therefore, we’re unsure how much more work should be done to evaluate funding opportunities related to reducing lead exposure for philanthropists aiming to maximise their impact.
Notes
- This report focuses on the impact of lead exposure in terms of WELLBYs. One WELLBY is a 1 life satisfaction point change for one year (or any equivalent combination of change in life satisfaction and time). In some cases, we convert results in standard deviations of SWB to WELLBYs using a 2 point standard deviation on 0-10 life satisfaction scales (i.e., 1 SD change is the equivalent of 2 point changes on a 0-10 life satisfaction scale). We consider the limitations of converting from affective mental health measures to WELLBYs in Appendix A4. This naive conversion is based on estimates from large scale data sets like the World Happiness Reports. See our post on the WELLBY method for more details.
- Our calculations and data extraction can be found in this Google Spreadsheet and this GitHub repository.
- The shallowness of this investigation means (1) we include more guesses and uncertainty in our models, (2) we couldn’t always conduct the most detailed or complex analyses, (3) we might have missed some data, and (4) we take some findings at face value.
- Clare Donaldson was co-director of HLI before becoming the current co-director of the Lead Exposure Elimination Project. We do not think this influenced our choices or analysis.
Outline
In Section 1 we introduce the issue of lead exposure and define some key terms we will use throughout the rest of this report.
In Section 2 we explain the mechanisms for how lead exposure could affect wellbeing.
In Section 3 we model the harm of lead exposure on subjective wellbeing using studies of two datasets from New Zealand and Australia (n = 789) relating childhood lead exposure to their adult affective mental health. This is a large section where we discuss our methods, the data we use, our results and the limitations of our approach.
In Section 4 we use existing cost-effectiveness estimates of interventions which reduce blood lead levels, combined with our model of harm, to estimate their cost-effectiveness in terms of affective mental health improvements.
In Section 5 we recommend the most valuable questions that could be answered with the fewest resources.
In Section 6 we conclude.
1 Describing the problem
Lead is a heavy metal that is toxic to humans and causes adverse health effects when present in the human body (WHO, 2021). While very high levels of lead exposure can kill or cause severe illness, lower levels can also have negative and potentially irreversible consequences (BMJ, 2022; WHO, 2021). Lead exposure poses a particular problem for children as they are more likely to ingest and absorb lead which could permanently harm their development (Pure Earth & UNICEF, 2020; WHO, 2021). Lead exposure is even more damaging to children who are malnourished, because the body more readily absorbs lead if other nutrients like calcium or iron are deficient (WHO, 2021).
The most common measure of lead exposure, and the one we refer to in this report is blood lead levels (BLLs), which measures micrograms (1 millionth of a gram) of lead per deciliter of blood (μg/dL or mcg/dL). BLLs mainly represent current levels of exposure and lead burden in the body because BLLs decrease quickly after exposure ceases. Bone lead levels represent long-term levels of lead. We discuss these measures in more detail in a footnote[2].
In a report on lead exposure by Rethink Priorities, Schukraft and Bernard (2021) focused on the negative impact of lead exposure on income and health. Their estimates of the correlational effects on health are based on the DALY burden of lead exposure (Schaffer et al., 2019) due to cardiovascular harm (Lanphear et al., 2018). Their estimated economic effects are based on the correlational relationship between lead exposure and intelligence (as measured by IQ, see Lanphear et al., 2005), which results in lost income (Attina & Trasande, 2013). These factors are important determinants of wellbeing, but they are not direct measures of wellbeing. In this report, we examine the effects of lead exposure to self-reports of subjective wellbeing (SWB), such as life satisfaction (cognitive assessments of how satisfied individuals are with their lives) or affect (how people feel)[3].
2 Mechanisms for the effects of lead exposure on wellbeing
Lead exposure can impact SWB through multiple pathways. Figure 1 provides a visual description of pathways through which lead impacts human wellbeing (inspired by, and expanding on, the figure by Obeng-Gyasi, 2018). In turn, we briefly present (1) the physical and neurological consequences (2) the psychological consequences, and (3) the socio-economic spillover consequences of lead exposure.
Figure 1: Mechanisms for lead exposure to affect wellbeing
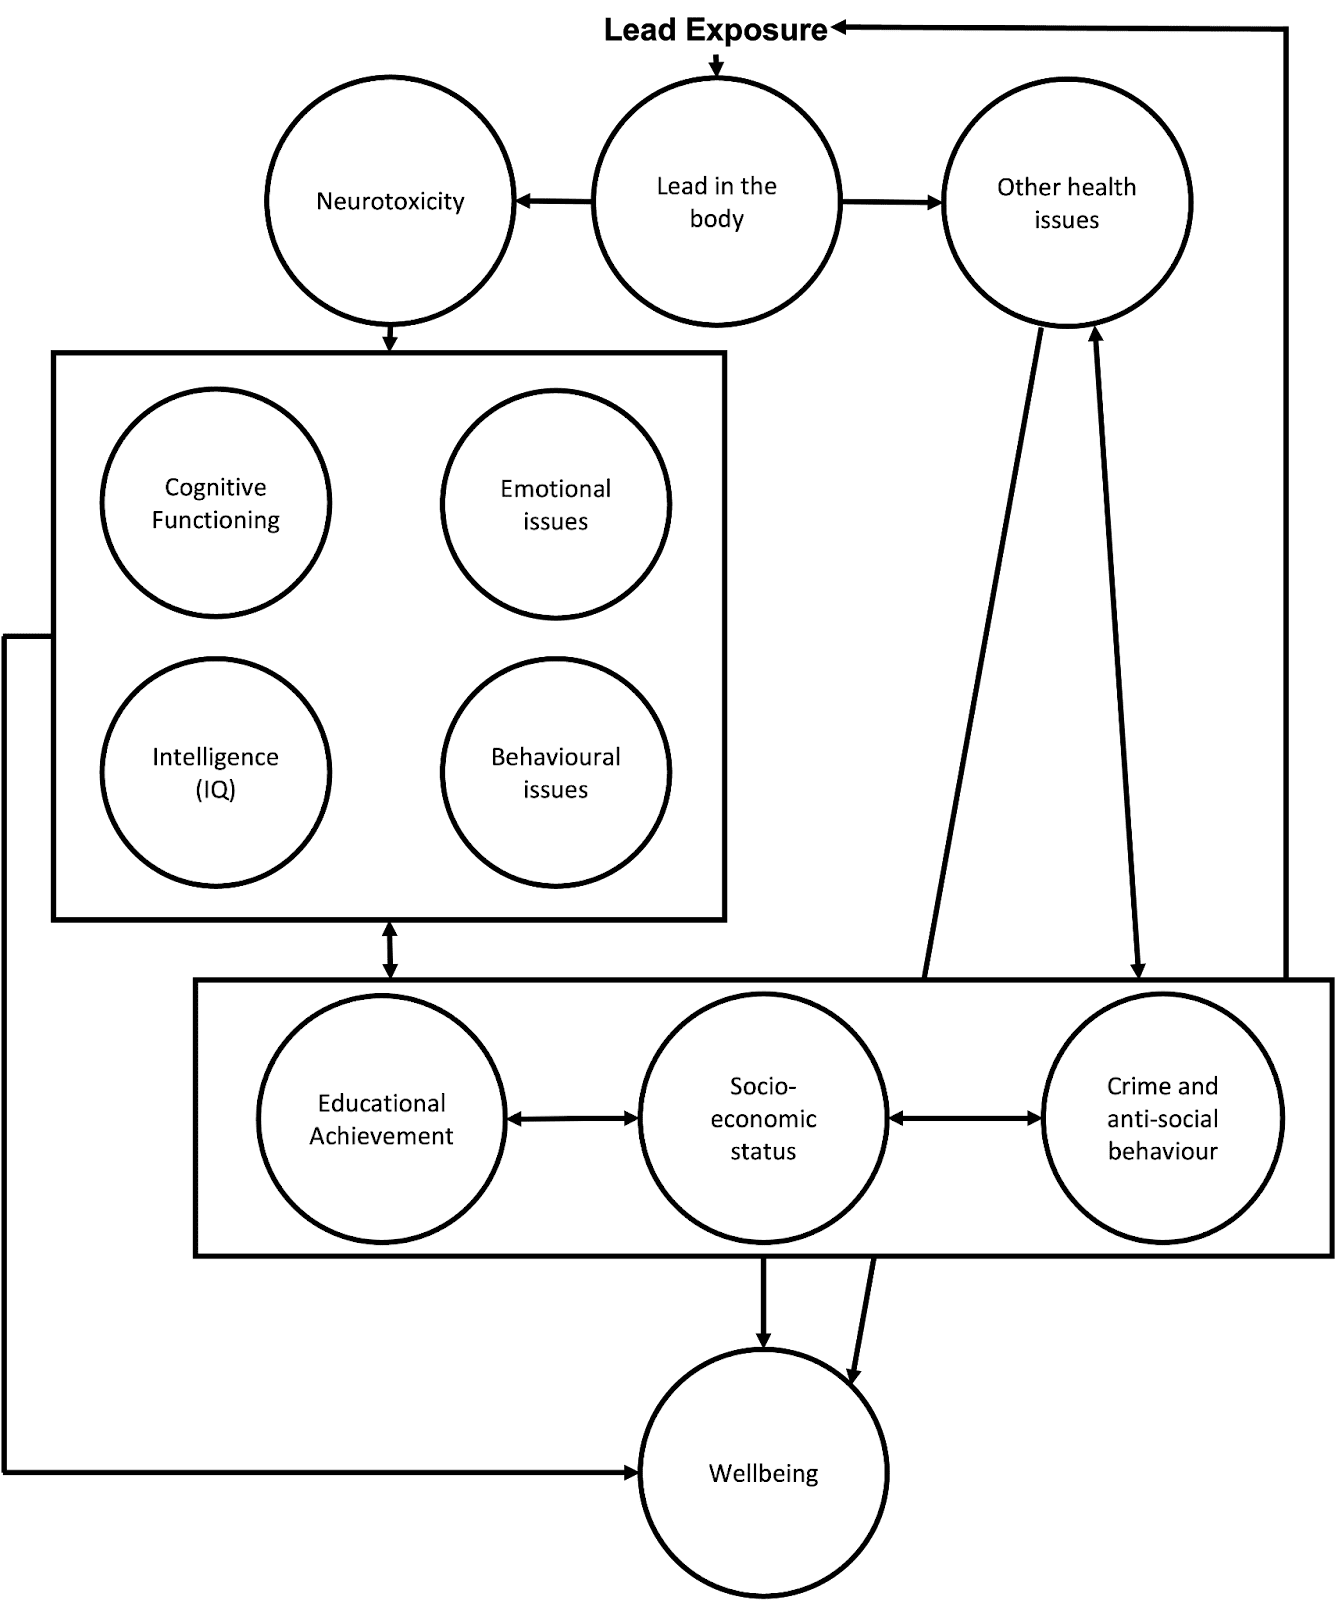
2.1 Physical and neurological consequences of lead exposure
Lead exposure results in lead in the body, which can cause illness (Naranjo et al., 2020) and physical health problems such as cardiovascular and kidney diseases (Navas-Acien et al., 2007; Boskabady et al., 2018).
Lead exposure also causes neurotoxicity (i.e., damage to the central nervous system; Sanders et al., 2009). Neurotoxicity is particularly problematic for children because their brain is developing and damage during brain development can lead to persistent problems with emotional and cognitive function. This is related to the idea of a critical (or sensitive) period in development, where disruptions to the development of certain processes can permanently impair these processes (Bornstein, 1989; Knudsen, 2004). See Räikkönen et al. (2012) for a mental health focused review of the general topic. There’s some evidence that prenatal exposure to lead can impede postnatal mental development (Bellinger et al., 1987). This suggests an ‘earlier the better’ approach to preventing lead exposure.
Lead’s neurotoxicity and adverse health consequences are the likely pathways that impede children’s development (Neuwirth et al., 2020) and causes adverse psychological and socio-economic outcomes in childhood and adulthood. Whilst we think most of the negative effects of lead exposure come from exposure in childhood, exposure in adulthood also appears related to health (Boskabady et al., 2018) and mental health problems (Yu et al., 2017; Yoon & Ahn, 2016).
2.2 Psychological consequences
As a result of neurotoxicity, lead exposure can permanently disrupt cognitive function (Ortega et al., 2021) and intelligence (Counter et al., 2015; Lamphear et al., 2005; Wasserman et al., 1997). Lead exposure is also associated with psychological difficulties such as ADHD (Nedelescu et al., 2022) and can lead to behavioural problems (Fruh et al., 2019). It can also have negative effects on personality: Schwaba et al. (2021) utilised a natural experiment[4] (n = 1,219,29) in which they found that higher lead exposure in childhood made for less conscientious and more neurotic adults. Both personality factors are strongly related to SWB (Anglim et al., 2020, meta-analysis with n = 334,567, studies = 462), suggesting this pathway may adversely affect lifetime SWB.
2.3 Socio-economic and spillover effects
Adult economic status is negatively associated with lead exposure in childhood (Billings & Schnepel, 2018; Gronqvist et al., 2020). This might be due to lead exposure in childhood also being associated with reduced educational attainment (Chandramouli et al., 2009; Evens et al., 2015), which is tied to adult economic status. Low socioeconomic status can in turn lead to higher levels of lead exposure because individuals might not be able to live in areas with low levels of lead or because they are more likely to do jobs that involve exposure to lead.
We believe it is likely that lead exposure can have negative effects on the families and communities of those exposed to lead[5]. We didn’t have time to explore this topic in depth[6], but there is tentative correlational evidence suggesting household and community spillover effects of lead exposure related to crime and education. In a meta-analysis of the correlations between lead exposure and crime rates, Higney et al. (2021; studies = 24) estimate that between 0% and 36% of the reduction in crime seen in the USA in the last few decades is due to a reduction in lead exposure. Crime seems intuitively and empirically related to the wellbeing of a community (Baranyi et al. 2021)[7]. Gazze et al. (2021) find that “Having more lead-exposed peers is associated with lower high-school graduation and SAT-taking rates and increased suspensions and absences”[8]. Lead exposure may also have household spillovers, but Nakata et al. (2021), is the only study we found. They observed that the BLLs of children were correlated to lower mental health levels in mothers, over and above the effect of the mothers’ BLLs on their own mental health. These are the only spillovers we found, but it seems plausible lead exposure could lead to more spillovers through more mechanisms and in further contexts.
In sum, lead exposure, even in small doses, can have important consequences for people’s wellbeing through a variety of paths, including health, cognitive function, and socioeconomic status.
3 Modelling the effects of lead on wellbeing
In this section, we present a simple model to estimate the impact of elevated blood lead levels on SWB. We start by explaining what we want to model and the data we have to model it (Section 3.1).
Next, we discuss the results of our analysis (Section 3.2) and its limitations (Section 3.3). We end with the implications of our results for the scale of the problem of lead poisoning (Section 3.4).
3.1 The data we use to model the lifetime effects of lead exposure on SWB
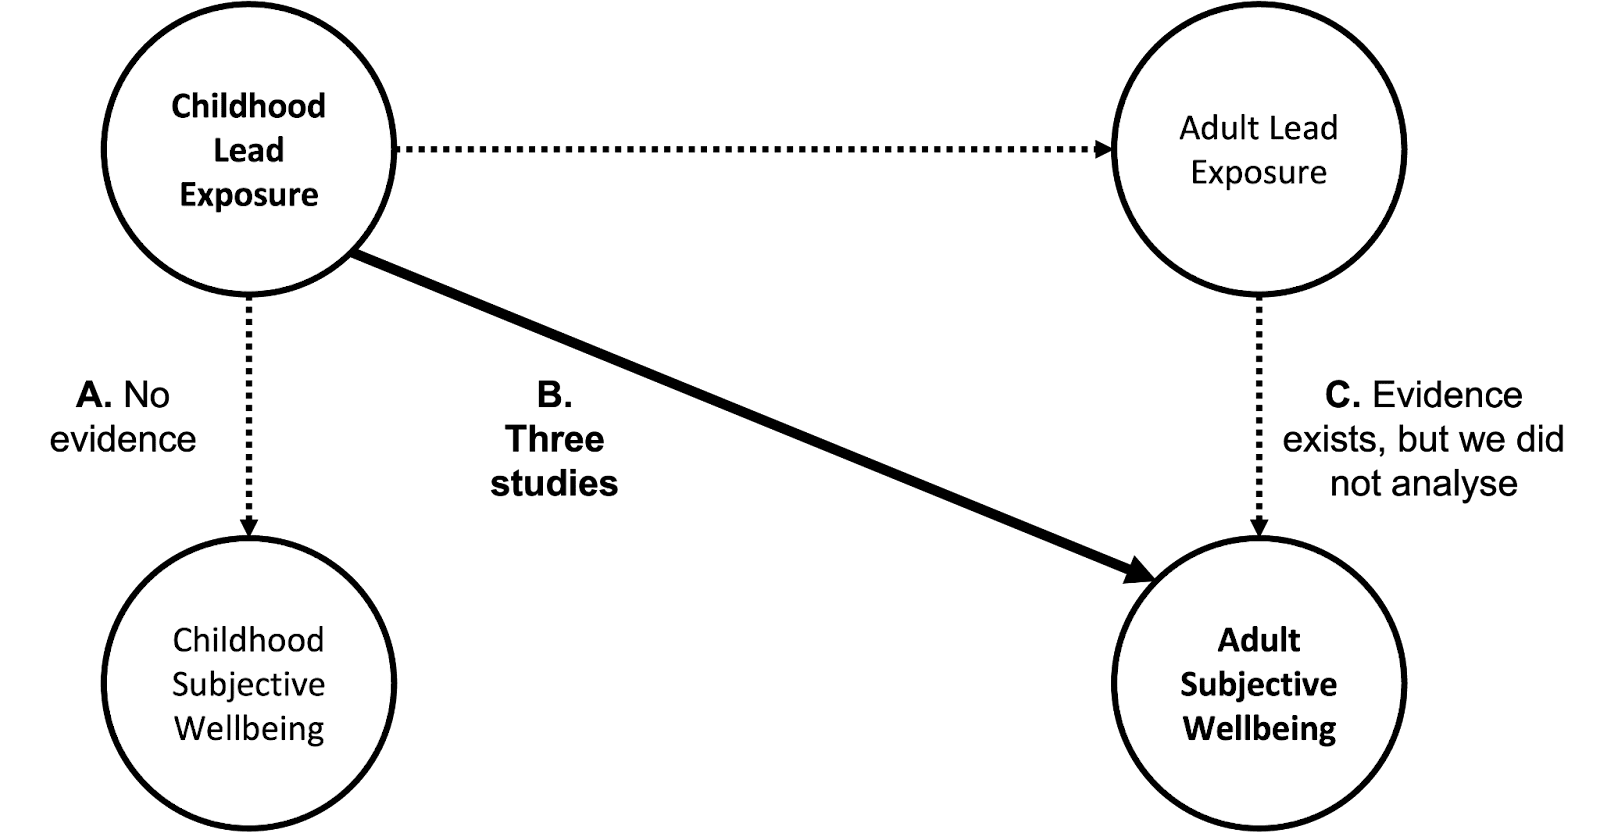
In this section, we discuss how we would like to estimate the effects of (A) childhood BLLs on childhood SWB, (B) childhood BLLs on SWB as adults, and (C) adult BLLs on short and long-term SWB. The different paths through which lead exposure could impact wellbeing are shown in Figure 2. To estimate the lifetime wellbeing impacts of reducing lifetime lead exposure we’d want to understand paths A, B, and C.
Whilst bone lead levels would be ideal for determining long-term effects, we could not find data relating bone lead levels to affective mental health or SWB. Instead, we use the next best measure of lead levels, blood lead levels.
We conducted an unstructured search for studies on lead and SWB[9]. We extracted the necessary data from all the studies we found in order to quantify the paths. To be able to compare results from different studies and measures, we quantify the effect with Cohen’s d (see Lakens, 2013); namely, the effects are all transformed into the same metric, standard deviations (SDs)[10].
We only found studies for paths B and C; we did not find data for path A. For paths B and C, we only found studies that measure affective mental health (MHa); we found no typical SWB measures like life satisfaction or happiness. Thus, we used affective mental health as a proxy for SWB (see Appendix A.4 for a discussion of this limitation). Here, we focus on path B, the impact of childhood lead exposure on adult SWB, because of time constraints, the availability of data, and its importance. We did not have time to analyse path C, which we expect is less important.
Figure 2: Lead exposure’s pathways to impact wellbeing.
Long-term effects of childhood BLLs on adult affective mental health are reported in studies of two longitudinal cohorts: the New Zealand Dunedin cohort and the Australian Port Pirie cohort[11]. We found no studies relating BLLs and MHa in LMICs (we discuss issues of generalisability in Appendix A.3).
The Dunedin cohort is a general health and development cohort study (Reuben et al., 2019)[12] where 579 of the 803 children in the cohort were tested for BLLs[13]. They had an average of 11.08 μg/dL (SD = 4.96, range = 4 to 50). This BLL appears relatively high by modern standards[14]. Reuben et al. (2019) found that a 5 μg/dL increase in BLLs at 11 years old significantly predicted a 0.19 SDs increase in internalising problems (anxiety, depression, sense of loneliness) in adulthood (average age at follow-ups was 27 year old, so 16 years later), after controlling for relevant demographic covariates[15]. If the dose-response relationship is linear at low levels, this could be considered a 0.19 / 5 = 0.04 SD increase in internalising problems in adulthood per 1 μg/dL during childhood.
The Australian Port Pirie cohort, which follows 210 children (90% of those born in the town between 1979-1982 living within 30 km of a lead smelting town), provides more mixed results. The average BLL was 17.2 μg/dL (SD = 5.2). Two studies estimated the effect of an increase in 10 μg/dL at the age of seven on depression and anxiety from the Adult Self-Report Scale (McFarlane et al., 2013) and the depressive subscale of the CAPE measure for psychosis (Galletly et al., 2016) at an average age of 26-27 years old. McFarlane et al. (2013) found a small nonsignificant increase in anxiety symptoms (0.15 SDs) and a small nonsignificant decrease in depressive symptoms (-0.07 SDs)[16]. Galletly et al. (2016), using the same dataset found a nonsignificant decrease in depressive symptoms (-0.32 SDs).
The results from these two cohorts conflict somewhat, with the Dunedin study supporting a significant increase in symptoms while study of the smaller sized Port Pirie cohort yields no significant findings and the results point in an unintuitive direction for depression (BLLs decreasing depression). We combine these results to obtain a meta-analytic average to account for the differences in findings and sample size.
3.2 Estimating the effect of childhood lead exposure on adult affective mental health
Due to time and data constraints, we focus on modelling the effect of childhood BLLs on adult affective mental health (i.e., Path B, rather than Paths A and C, in Figure 2). In Table 1, at the end of this section, we summarise the calculations from our modelling.
Our model of the effects of BLLs on MHa involves multiple parts:
- Quantifying the effect
- Our assumption of causality
- Explaining the model in context
- Spillovers
3.2.1 Quantifying the effect
To quantify the effect, we need to model the dose-response relationship between BLLs and wellbeing over time.
It is important to model the shape of the dose-response relationship between BLLs and wellbeing because interventions will vary dramatically in their effect on BLLs. We assume the dose-response relationship is linear, where each increase of 1 μg/dL in BLLs has the same effect on wellbeing[17]. We guess that a linear relationship seems approximately correct for low BLLs[18], but the relationship may be diminished at higher levels. We did not have the time or data to investigate this question in more depth. The studies we investigated only report results in terms of 10 or 5 μg/dL increases. We converted their effects sizes linearly to 1 μg/dL by dividing the effect by the dosage.
After standardising the effect sizes, we use a meta-analysis[19] to combine the long-term effects of childhood BLLs on adult affective mental health. We find that, on average, the effect of 1 μg/dL in childhood (measured at ages 7 or 11) results in a 0.016 SDs decrease in adult MHa (i.e., an increase in negative mental health symptoms, thereby, loss in SWB) at the average age of 27. We now model how the effect evolved over time to reach this point, and how it might continue afterwards.
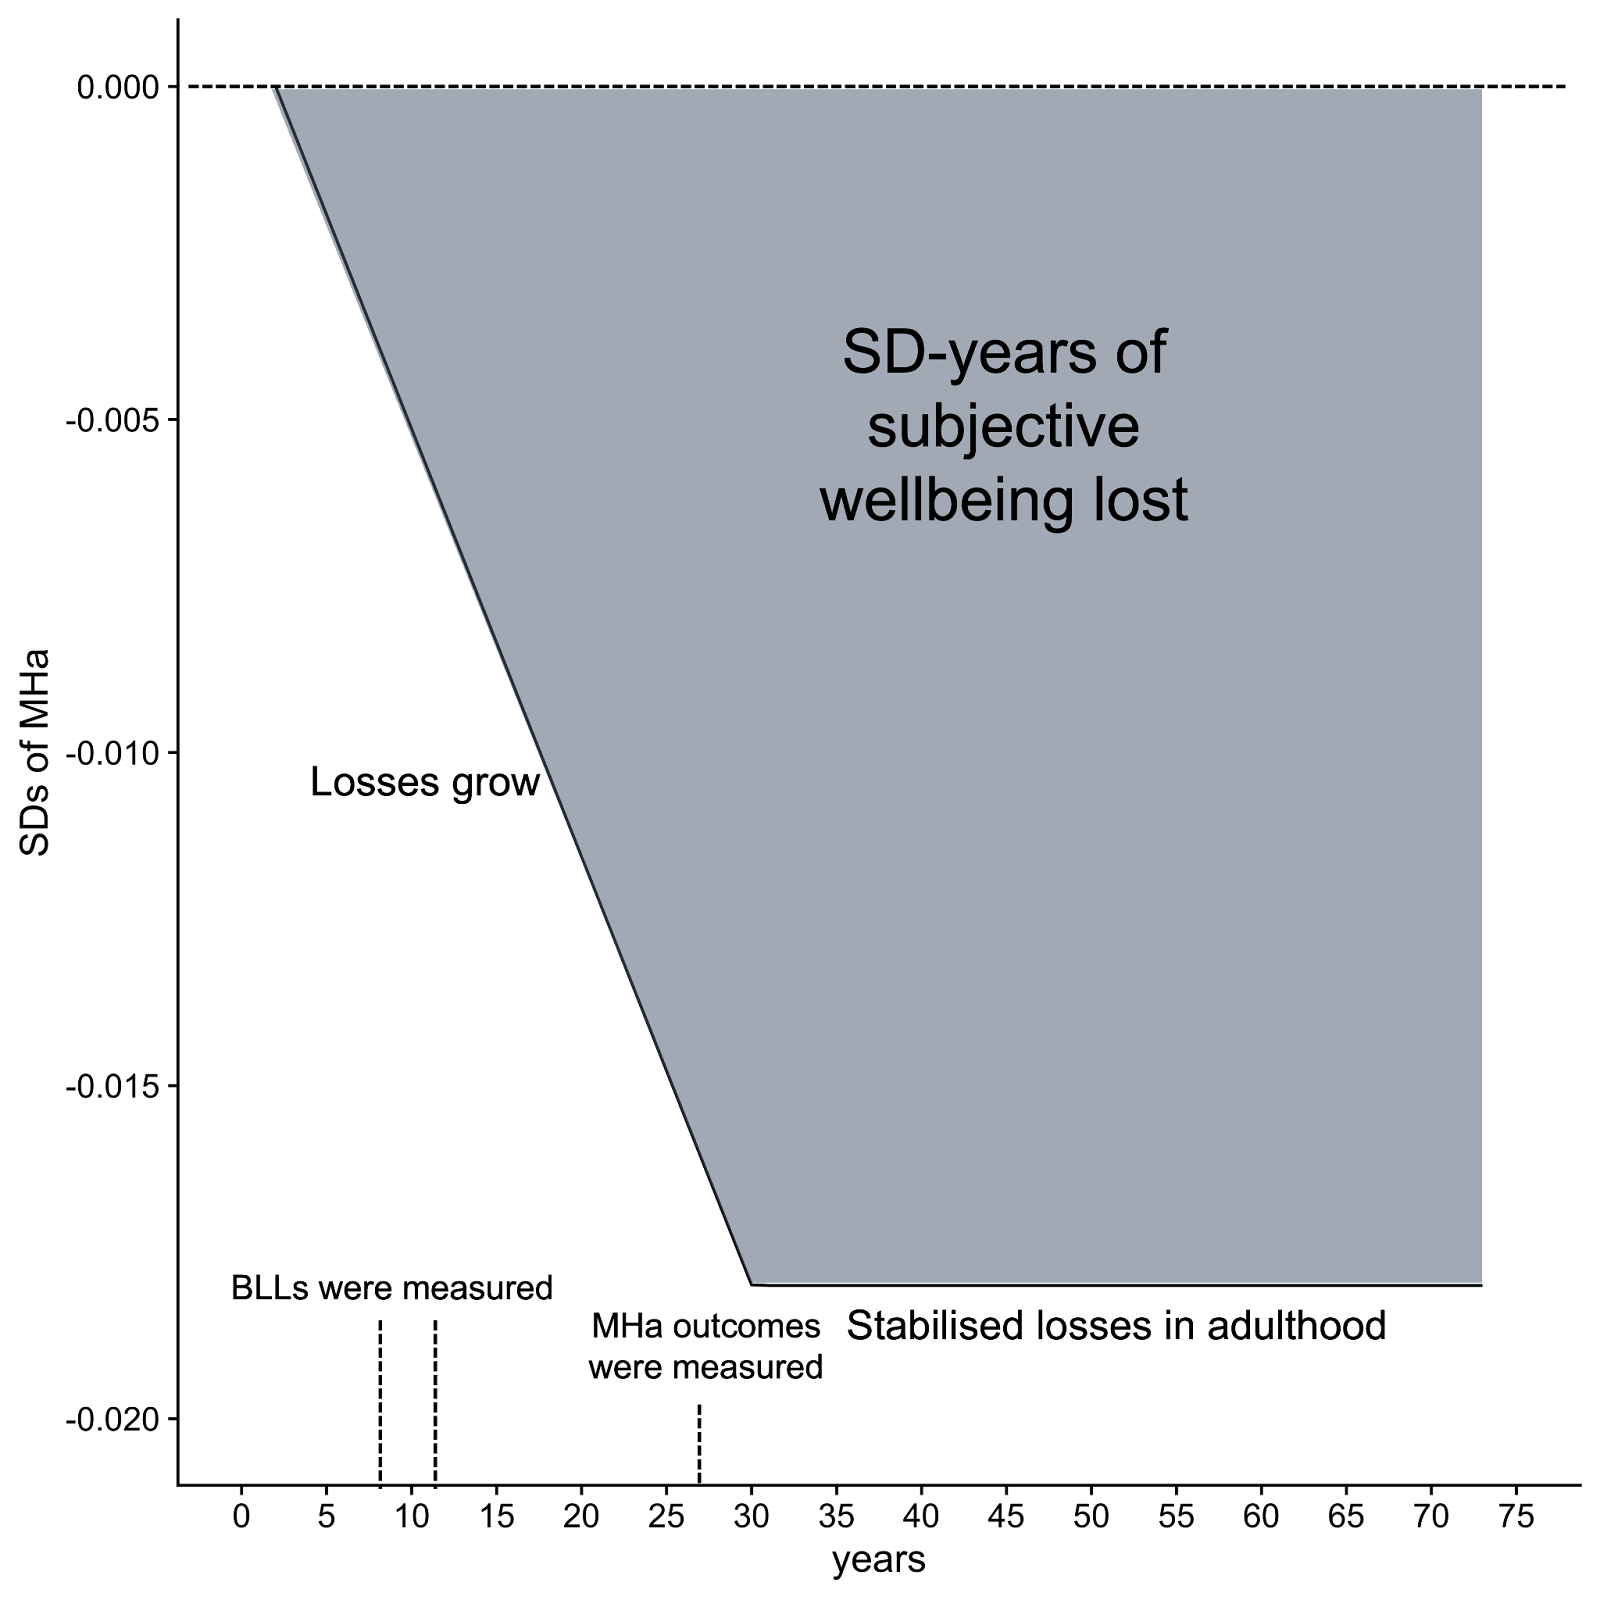
We did not have enough data to estimate the trajectory of wellbeing effects across time. Hence, we need to make assumptions about (i) how long children are exposed to lead in childhood and how long the effects last in adulthood and (ii) how the effect on wellbeing changes over time (the ‘trajectory’). We assume that childhood wellbeing decreases over time in response to a period of lead exposure that occurred during childhood. This decline then stabilises in adulthood and the lower wellbeing persists for the rest of adult life (i.e., adults do not adapt to the consequences of earlier exposure). This choice is mostly because it is the simplest to model with limited time. We discuss the other possible shapes in Appendix A.1. With more time we should test how much of a difference making each assumption would have.
It is unclear where to set the start of the decline in SWB because, (1) participants had their BLLs measured at 7 or 11 years old, but they were likely exposed to lead before then, and (2) BLLs in childhood vary across age[20]. Hence, we assume the effect started ‘during childhood’, but simplify the modelling to a start and end point. Namely, we assume the harm of childhood lead exposure grows linearly from 2 years old until 30 years old, at first because of the health and cognitive consequences of lead exposure, and then because of the added socioeconomic consequences when one is an adult. Effectively, we are extrapolating Path A from the estimates for Path B. The health and cognitive effects of early lead exposure may well have reached their peak between 18-25 years old, but we believe the socio-economic consequences are still likely to grow until 30 years old as people’s earning potential stabilises[21].
All the effect sizes we extracted were measured, on average, at 27 years old; hence, a 0.016 SD decrease in MHa was the effect predicted at about 27 years old due to an average increase of 1 μg/dL of BLLs in childhood. For this effect to start at age 2, it needs to grow by 0.016/(27-2) = 0.0006 each year to reach 0.016 by age 27. Then, it will increase to 0.016 + 0.0006*3 = 0.018 at age 30. This means that, integrated over age 2 to 30, 1 μg/dL of lead in blood in childhood caused a loss of 0.29 SD-years in wellbeing. Then assuming that for each year from 30 to 72.6 years old (average world life expectancy, see Our World in Data, 2019) the early lead exposure will stabilise and cause a yearly loss in wellbeing of 0.018 SDs, causing an extra 0.77 SD-years of wellbeing lost over the life span. In total, according to this modelling, 1 μg/dL in childhood causes a loss of 1.05 SD-years (or 2.10 WELLBYs) in SWB over a person’s life. See Figure 3 for a graphical representation, where the grey area is the integrated loss in SD-years of SWB due to lead exposure in childhood.
Figure 3: Effect of lead exposure on MHa over the lifespan according to our model
3.2.2 Our assumptions about causality
An important limitation with our estimation is that there is scant causal evidence. There are two ways in which issues with causation could affect our estimation.
Firstly, other variables could be causing both increases in lead exposure and decreases in wellbeing. For example, low socioeconomic status could mean one is more likely to live in areas with high lead exposure and more likely to have lower wellbeing. However, we believe this is unlikely to explain away all the effects because Reuben et al. (2019), McFarlane et al. (2013), and Galletly et al. (2016) did control for family variables like parental MHa and socioeconomic status[22].
Secondly, there could be problems of ‘reverse causation’ or ‘selection issues’ where lower SWB causes individuals to expose themselves to lead. For instance, people with low mental health may have parents who are likely to select more lead polluted places to live because they are poorer and polluted places are cheaper. Someone with low mental health may expose themselves to more pollution because of a lower capacity or desire to avoid risk. Maybe the happiest and brightest kids are less likely to eat paint chips, whatever their lead content. This is plausible, but as we explain next, we think it’s likelier that the difference in MHa related to differences in BLLs are explained by the difference in the BLLs and not some other factor.
It seems plausible that some factors contribute to childhood BLLs and adult MH. While some, like family socio-economic status, are controlled for, unobservable factors such as family risk preference or just the vagary of housing assignment may explain both factors. We are particularly concerned about how childhood BLLs predict adult BLLs. But we think that it is likely that people’s lead exposure in childhood is independent of their lead exposure in adulthood. This may at first seem like too strong an assumption because it’s plausible that lead exposed children are likelier to be lead exposed adults. In which case apparent ‘permanent damage’ effects would be in part explained by ‘sustained exposure’ effects. However, this seems less likely in a world where everyone (particularly in high-income countries) is exposed to much less lead as time passes. In many countries, BLLs have been declining for the past few decades: (USA: Tsoi et al., 2016, Mexico: Pantic et al., 2018, worldwide: Hwang et al., 2019). In Australia and New Zealand, the countries we have longitudinal data on, the average BLLs of children surveyed in the 1980’s was 11 and 17 μg/dL, respectively. Recent surveys of adults in the 2010s in Australia (Kelsall et al., 2013) and New Zealand (Mannetje et al., 2020) found BLLs of adults were around 1 μg/dL. If these studies generalise to the longitudinal studies we use, then that suggests a reduction in BLLs over time of 90-94%. This suggests that BLLs in adulthood are unlikely to play a strong confounding role.
After considering this, we guess that accounting for the lack of causal data would reduce the correlational effects we observe by 30%. This leads the overall harm of a 1 μg/dL increase in childhood BLLs to be a 1.05 * 0.70 = 0.74 SD-year (~1.5 WELLBYs) reduction in SWB over the life course.
3.2.3 Explaining the model in context
We estimated that 1 μg/dL increase in childhood BLLs will reduce the lifetime wellbeing of a person by 1.5 WELLBYs. Furthermore, average BLLs for children in LMICs are 5.3 μg/dL (our calculations from data presented in Ericson et al., 2021), so there is an average loss of 5.3 * -0.74 = -4 SD-years of MHa (or -8 WELLBYs)[23]. It’s not clear how large this is, so we try to compare lead exposure to the causal effects of other negative shocks in childhood that had lasting harm on affective mental health.
A few studies have estimated the adult (and presumably lifelong) MHa effects of negative childhood shocks. Singhal (2019) estimated that children living in areas with medium intensity bombing (compared to low intensity) in the Vietnam war had lower mental health when they were adults by -0.63 SDs. If this lasted 60 years then we estimate that the lifelong effect of exposure to war was -38 SD-years of mental health (-76 WELLBYs). Huang et al. (2013) estimate that being exposed to famine in Maoist China in early life had an effect of -0.23 SDs on their mental health as adults. If we assume this lasted 60 years, then the lifelong effect would be -17 SD-years (34 WELLBYs). Jayawardana et al. (2013) estimated that child labour reduced later adolescent mental health by -0.04 SDs. If this lasted 60 years, this would lead to a lifelong -4.4 SD-years (8.8 WELLBYs) decrease in MHa. Adhvaryu et al. (2019) estimated that a 1 SD decrease in cocoa prices in Ghana during childhood living in a cocoa producing region had a causal effect of -0.05 SDs on MHa in adulthood; if this lasted 60 years, the lifelong effect would be -3 SD-years.
So, as a sanity check, decreasing BLLs by the average 5.3 μg/dL could provide a comparable benefit as sparing a child from labour. This does not strike us as unreasonable[24] because it seems like 5 μg/dL higher BLLs is enough of a dose to cause harm through the channels we discussed in Section 2: lower IQ, lower income, lower socioeconomic status, higher risk taking behaviour, and potentially worse emotional regulation.
3.2.4 Spillovers
As mentioned in Section 1, some studies suggest lead exposure may have household spillover effects. However, we do not have sufficient data to estimate household spillovers nor enough time to estimate community spillovers due to increased crime or poorer educational achievement. For now, we make assumptions about the household spillovers and do not add community spillovers, noting that this is likely to be a lower bound of the overall effect of lead exposure on wellbeing. We use the 38% spillover ratio that McGuire et al. (2022, after correcting for a mistake in our analysis). Of the two spillover ratios empirically estimated we have available (cash or psychotherapy), the one for psychotherapy seems most appropriate because lead, like psychotherapy, involves direct health problems and can have indirect socioeconomic outcomes. We make a quick guess that across the individual’s life, they will have a non-recipient household size (i.e., not counting themselves) of 3 people; parents and siblings at first, then their own family afterwards. Therefore, we calculate the overall effect of a 1 μg/dL increase in childhood BLLs on SWB as 0.74 + 0.74 * 0.38 * 3 = 1.58 SD-years (or 3.2 WELLBYs).
3.3 Further limitations and what we would do with more time
We want to reiterate that this analysis was done in two calendar weeks and involves numerous assumptions. The reader should consider these when updating about the impact of lead exposure. We previously noted our lack of data (Section 3.2.1) and our concerns about causality (Section 3.2.2). There are four further limitations of our modelling which could be addressed with more time:
- The data and analysis lack granularity concerning the effects of lead over the lifespan, so we make an assumption in our modelling of the trajectory of this effect.
- We did not find data for path A (current effect of lead exposure on childhood wellbeing – mentioned at the start of Section 3.2) and did not analyse path C (current effects of lead exposure on adult wellbeing), so our model may not accurately capture the total impacts of lead.
- We have no evidence directly connecting blood lead levels and affective mental health or SWB in LMICs, so it is unclear if these results generalise to these countries.
- We only find measures of affective mental health and not typical measures of SWB such as life satisfaction or happiness scores. We treat the relationship between MHa and life satisfaction to be 1:1, but our results would be sensitive to a different conversion ratio.
We elaborate on these limitations in Appendix A.
3.4 The scale of the problem
While BLLs have been declining over time, the scale of the problem differs dramatically between the high income and lower income countries. For example, US children today (born after 2006) have on average BLLs less than 1 μg/dL (Tsoi et al., 2016)[25]. Meanwhile, Ericson et al. (2021) estimate that 48.5% of children in LMICs (632 million) have blood lead levels higher than the CDC’s former[26] reference level of 5 μg/dL. According to Pure Earth (an NGO working to reduce lead exposure) and UNICEF (2020), there are about 815 million children worldwide with BLLs above 5 μg/dL and 176 million with lead levels above 10 μg/dL. This implies that we should focus more on remediating lead exposure in LMICs.
We use these numbers[27] and our previous modelling (Section 3.2) to estimate the scale of the problem in SD-years of MHa lost globally. We think lead exposure represents a total loss in wellbeing of 10.3 billion SD-years (household spillovers included) from children exposed to lead worldwide (or 21 billion WELLBYs). In contrast, 264 million people suffer from depression (Our World in Data). There are many more children exposed to lead than people suffering from depression.
The extent of a problem matters because it directly relates to how long a solution to the problem will remain cost-effective. If a problem is small in scale, then it will quickly become costlier to address the next case. Since toxic lead exposure appears extremely widespread, we expect that addressing it will continue to be cost-effective for some time. Although, note that for all types of countries there has been a trend towards lower BLLs (see Hwang et al., 2019).
4 Solving the problem: How do we decrease lead exposure?
In this section, we review how well various interventions decrease lead exposure, as measured by BLLs, and present them in order of promise. Much of this section extends Schukraft and Bernard’s (2021) work reviewing cost-effective ways to decrease lead exposure. In Section 4.1 we describe several back of the envelope calculations we employed to estimate the cost-effectiveness of reducing lead exposure relative to GiveDirectly, a charity that provides cash transfers directly to those living in extreme poverty. Then, in Section 4.2 we will present and discuss our entire list of possible interventions to reduce lead exposure.
4.1 Estimating the cost-effectiveness of reducing lead exposure to affective mental health
There is some evidence of the cost-effectiveness of interventions in reducing BLLs, which we will discuss below. We can combine this evidence with our model to estimate the cost-effectiveness of these interventions in terms of MHa. We summarise the back-of-the-envelope (BOTEC) cost-effectiveness calculations, in multiples of GiveDirectly’s cash transfers cost-effectiveness (McGuire et al., 2022), in Table 3. The calculations are annotated in the “master tab” of this spreadsheet. We first set out the key results in the table, then make more detailed comments on each below, highlighting the most influential and uncertain parameters. These calculations are extremely speculative.
Table 3: BOTECs of interventions to reduce lead exposure (from this spreadsheet)
| Intervention | Cost-effectiveness in multiples of GiveDirectly | WELLBYs per $1000 | Comment |
| Lead paint advocacy | 107 | 872
| Seems high, but plausible. Based on one case study for the cost and effect. |
| Calcium supplementation for pregnant mothers | 24 | 196 | Seems plausible. Based on one RCT for effect on BLLs, and a reasonable assumption for cost. |
| Toxic site clean-up | 12 | 97 | Seems plausible. Based on three studies for the cost and effect on BLLs. |
| (Fictive) Make-up awareness campaign | 12 | 99 | Seems plausible. Based on a correlational meta-analysis for effect and speculation for cost. |
| Residential soil replacement | 1 | 10 | Seems plausible. Based on three RCTs for the cost and effect on BLLs. |
Advocacy for unleaded paints appears very cost-effective. Lead Exposure Elimination Project (LEEP) is a charity that advocates for governments in LMICs to regulate lead in paint. This prevents future cases of children being exposed to lead in paint. We base our calculations on LEEP’s cost-effectiveness analysis but make a few adjustments which we will discuss. LEEP predicts that one of its interventions would prevent 215,000 children from being exposed to lead in paint over 20 years. We assume that it would, at most, decrease children’s average BLLs of 5.3 μg/dL by 20%, because that’s the share of exposure that LEEP assumes comes from paint[28]. We further discount this figure by assuming that LEEP has a 25% chance of success at eliciting a government commitment to removing lead paint per year of operation in a country[29] and we assume there’s a further 50% chance they keep this commitment[30]. This leads to an expected reduction of 5.3 * 0.2 * 0.25 * 0.5 = 0.13 μg/dL per person. Since our model estimates that each μg/dL of lead exposure averted in children gains 3.4 WELLBYs over their lifetime, and there are 215,000 children affected, this results in 0.13 * 3.4 * 215,000 = 95,030 WELLBYs saved. We think a new intervention would cost $112,000 (a bit more than the $80,000 LEEP reported for their Malawi intervention because we expect future staff to be paid more). Hence, this results in 802 WELLBYs saved per $1000 invested.
However, other evaluators and grantmakers in the Effective Altruism community appear to agree that LEEP[31] is a promising charity (Rethink Priorities, Open Philanthropy, Founders Pledge), so it’s unclear how much of a funding gap LEEP has.
Calcium supplementation for pregnant mothers appears quite cost-effective (24x Givedirectly). Whilst less cost-effective than unleaded paint, this estimate relies on relatively fewer assumptions. A single RCT by Ettinger et al. (2009, n = 600) found that providing calcium supplements to mothers throughout pregnancy had a small reduction on BLLs (-0.4 μg/dL). The key uncertainty here is the extent to which reducing BLLs during pregnancy is equivalent to reducing BLLs in childhood. For how many years of childhood would you have to reduce BLLs by 1 μg/dL to arrive at the same impact of reducing BLLs during pregnancy? We assume the answer is much more than nine-months, based on our idea that “the earlier the better” for preventing exposure to toxic substances. With $8.4 (based on a quick internet search) it seems like you can purchase enough calcium supplements to cover the period of pregnancy.
An awareness campaign for lead in makeup could be cost-effective (12x GiveDirectly). The observational difference between BLLs of users of Kohl, a common makeup product in South Asia often made from a type of lead ore, and non-users is -5.8 μg/dL. This information comes from a small, low quality meta-analysis by Sadeq et al. (2021, studies = 7, n = 1,565). For the BOTEC, we assume that 50% of the correlational difference is causally attributable to the cosmetic. Next, we imagine a fictional intervention where digital ads warn against the dangers of lead-based Kohl. Based on a casual conversation with an email marketer, we speculate that 0.75% of those reached by the ad would stop applying the leaded version to their children, and it would cost $0.75 to reach a person with this ad.
Cleaning up sites contaminated with lead appears quite cost-effective (12x GiveDirectly). Sometimes toxic sites, such as an abandoned battery recycler, are left as a continual and high source of lead exposure in communities. Cleaning up involves removing the material and replacing the soil. The cost-effectiveness of cleaning up the site seems somewhat reasonable. It’s our most well-evidenced calculation based on three cost-effectiveness analyses (based on: Ericson et al., 2018a; Ericson et al., 2018b; Chowdhury et al., 2021). Averaging the effects, cleaning up a toxic site reduced BLLs by 17 μg/dL for those living near the site. This implies very high baseline BLLs (the average BLL in LMICs is ~5). If a concave dose-response relationship was to be relevant in any calculation, it would be relevant here. The cost-effectiveness would decrease (we’re unsure by how much) if we used a logarithmic dose-response relationship. We assume that each toxic site cleanup affects 333 childhoods[32]. The average cost figure of $200,000 comes from averaging the cost estimated from each study.
Replacing residential soil contaminated with lead does not appear cost-effective (around 1x GiveDirectly). We extracted the cost ($5,587.67) and effects (a decrease in BLLs of 2 μg/dL) from three studies in Dobrescu et al. (2022), a systematic review of interventions to reduce residential lead soil. The only clear and explicit assumption we made was that it would cost half as much to deploy the same intervention in a LMIC. As we will see in the next section, we thought this would be the least cost-effective intervention in the set of options we considered. If we take this BOTEC and our ranking seriously, this implies we think any of the interventions to reduce lead exposure we consider are at least as cost-effective as GiveDirectly.
4.2 Guessing the cost-effectiveness of additional interventions to reduce lead exposure.
There are many more interventions to reduce lead exposure than we had the time or evidence to estimate cost-effectiveness for. Instead, we ranked these interventions relative to whether we believe they are more or less cost-effective than the interventions we estimated. This was aided by a survey (see the results in this spreadsheet) we ran where we asked several others who have thought about the issue to provide their subjective estimates of cost-effectiveness. So far, David Bernard and Jason Schukraft (authors of the Rethink report) and Lucia Coulter (one the co-directors of LEEP) have provided their subjective cost-effectiveness ratings, and Table 4 is presented in order of the average rankings between Joel (one of our authors), Jason, David, and Lucia. With more time, we would consider reaching out to more experts.
We illustrate these interventions in Table 4 below. The first thing to note is that across interventions, we have little evidence of what works, so instead, we primarily rely on our judgement and the opinion of researchers and experts. Again, we would like to make it clear that much of this work is directly built on the report of Schukraft and Bernard (2021).
Schukraft and Bernard (2021) broadly categorise interventions as either ‘remediation’ or ‘prevention’. Remediation means removing current lead in the environment (e.g., securing houses already painted with lead paint). Prevention means stopping the introduction of new sources of lead exposure (e.g., preventing new houses to be painted with lead paint). Schukraft and Bernard argue that in most cases it’ll be more cost-effective to prevent new lead than remove existing sources. In general, we agree because remediation activities appear expensive (see our BOTECs in Section 4.1) whereas preventing new lead exposure is about as effective but cheaper.
Currently, advocacy seems the most cost-effective way to prevent new sources of lead exposure. However, we are uncertain how the landscape of leaded-product manufacturing might affect the effectiveness of advocacy. Many of these manufacturers (e.g., producers of artisanal pottery, informal battery recyclers or small scale cookware) are small and mobile. This makes it costlier to regulate these organisations effectively. The more concentrated an industry, the easier it is to regulate, conditional on the government having the desire to implement regulations. However, regulations against more concentrated industries are less likely to pass against a more easily united opposition.
Table 4: Potential interventions to reduce lead exposure ordered from most to least promising
| Intervention type | Lead Exposure Sources | Intervention | Multiple of GiveDirectly |
| Regulate | Lead paint | Regulate paint manufacturers at the national level (e.g., LEEP) | 107 |
| Campaign | Lead in food and spices | Consumer awareness of lead in spices like turmeric or preserved eggs | |
| Regulate | Lead in food and spices | Regulate spice makers to keep lead out of common food or spices | |
| Regulate | Lead paint | Advocate to make lead a controlled substance in international trade | |
| Campaign | Leaded cookware | Advocate for unleaded glazes in pottery (e.g., Pure Earth’s “Barro Aprobado” programme) |
|
| Regulate | Used lead acid batteries | Regulate recyclers by enforcing existing rules | |
| Campaign | Lead paint | Pressure pigment manufacturers to drop lead use (global) | |
| Direct | All | Provide calcium supplements to pregnant women (e.g., Ettinger et al., 2009). | 24 |
| Campaign | Cosmetics | Awareness of lead in common cosmetics in India, China or Africa | 12 |
| Regulate | Cosmetics | Ban use of lead in makeup in India (see Kohl) | |
| Direct | Used lead acid batteries | Cleanup and remediation of toxic sites | 12 |
| Tax | Used lead acid batteries | Subsidise formal recyclers so that they can pay more than informal recyclers | |
| Campaign | Lead in food and spices | Technical assistance to turmeric producers to non-toxically enhance colour | |
| Direct | Dust | Provide air purifiers to households exposed to fine airborne lead particulates | |
| Direct | Leaded cookware | Seal lead into cookware made with lead | |
| Direct | Lead pipes | Introduce water filters in homes | |
| Direct | Leaded cookware | Replace leaded cookware | |
| Regulate | Lead pipes | In-situ electrochemical passivation | |
| Tax | Tobacco | Outlaw tobacco grown in soils beyond a certain lead level or further tax tobacco? | |
| Innovate | Leaded aviation fuel | Invent new aviation gas (AVGAS) | |
| Tax | Leaded aviation fuel | tax AVGAS in the USA | |
| Direct | Lead pipes | Replace lead pipes | |
| Direct | Dust | Replace topsoil with high lead levels | 1 |
5 Next steps for research
We think there are several promising next steps for research that can be done efficiently. We discuss them in the order of their promise (i.e., how much useful information we expect them to provide relative to the resources they'll require).
5.1 Improve our current analysis
We think our current model relating BLLs and MHa could be improved in several ways even before adding more data. First, one could quantify uncertainty around the cost-effectiveness estimates using Monte Carlo simulations. Second, one could run more robustness checks (e.g., about the shape of the trajectory over time). Third, one could make better adjustments for generalising the BLL to MHa relationship from high-income countries to lower-income countries.
5.2 Using other data to estimate the effect over time more accurately
Our modelling lacked time granularity (see Appendix A.1). With more time, we would look for additional data covering other time periods. Ideally, we would want multiple longitudinal studies in various LIMCs where participants are followed from childhood and their BLLs and SWB are measured across life. We would also want data on the BLLs and SWB of the participants' households and some general statistics about their households, areas / communities (e.g. income, education, presence of lead exposure sources, etc.).
However, even with the studies we have currently encountered, there are potential analyses to do if someone can access the data. With more time and access to the data from different cohort studies, a researcher could look more into the dosage effects of lead exposure and how long the harm on affective mental health lasts. Notably, in the Dunedin study, adult outcomes were measured at 18, 21, 26, 32, and 38 years old, but only an average effect on MHa in adulthood (combined across the adulthood follow-ups) was reported. This would be low hanging fruit for assessing lead exposure effects on later MHa over time.
We also welcome a more detailed model where early lead exposure is related to childhood and adult affective mental health through economic and cognitive changes (e.g., via mediation analysis or structural equation modelling).
Additionally, we think our model of the impact of lead exposure on wellbeing could be improved by doing more primary data analysis. In particular, a recent thesis by Keyes (2020) used the National Longitudinal Study of Youth (NLSY) and exploited a staggered rollout of the Clean Air Act (USA, 1970) to estimate the causal effect of reduced BLLs on risk-taking behaviour. Fortunately, the NLSY also asks its participants about their SWB. Therefore, to run the first study of the causal effects of lead exposure reduction on SWB, it only appears necessary to replicate an already existing study.
5.3 Surveying more experts and finding better evidence on the primary sources of lead exposure
We also think there are several further ways to improve how we understand what are the most cost-effective opportunities to reduce lead exposure. The next step would be to give our survey to more experts, and try to expand the list and conduct more BOTECs for the most promising interventions.
We agree with Schukraft and Bernard (2021) that it is important to conduct additional studies to determine which sources of lead exposure (such as paint or toxic waste sites) cause higher blood lead levels. We think running a primary study could be relatively simple[33].
5.4 More RCTs testing the cost-effectiveness of interventions
Lastly, we would like to see more RCTs testing the cost-effectiveness of various lead exposure reduction interventions. These include educational campaigns and nudges about the content of lead, and its dangers, in everyday items. Since lead paint is considered a major threat, we’d like to test how much BLLs (and SWB) change in response to removing or securing lead-painted houses. This would give us an idea of how large a source of lead paint is of lead exposure for the population studied, and give us a benchmark for the cost-effectiveness of lead paint advocacy.
5.5 General questions about advocacy
There are a few general questions about advocacy that this work raised that we think would be important to answer. What’s the general success rate of an advocacy campaign to change a law or regulation? How does this differ depending on the size and income of a country? Is there a reasonable way to empirically estimate the success rate of advocacy? Could we use prediction aggregation platforms like Metaculus to forecast questions like LEEP’s likelihood of success? An answer to these would be very helpful to helping make sense of an appropriate likelihood for an organisation like LEEP to succeed in the future with their advocacy efforts.
6 Conclusion
In this report, we introduced lead exposure as an issue, explained its mechanisms for harm, modelled its effects on affective mental health, and recommended interventions and research to investigate in the future. Our sense is that lead exposure causes large amounts of suffering and that it is potentially very cost-effective to reduce lead exposure. Advocacy against lead in paint, food, cookware, and cosmetics seem promising but we are still very uncertain about the most cost-effective interventions. We think further research could be very promising by enabling more confident evaluations and recommendations of lead exposure remediating charities.
Appendix A: Limitations
A.1 Our model lacks time-trajectory data
Ideally, we would want to model the effect of BLLs on wellbeing across the lifespan. This involves measuring the effects of BLLs on wellbeing in childhood and adulthood and being able to model how much of the effect on adulthood is due to current or continued exposure to lead and how much is due to prior exposure during development. However the data we have and our modelling lack granularity concerning the effects of lead over the lifespan.
One of the assumptions we made in our modelling was that the impact of lead exposure on wellbeing will grow linearly until adulthood and then stay constant; however, there are different shapes it could take. Here are four potential trajectories of the wellbeing impact of childhood lead exposure, illustrated in Figure 5 below and described briefly afterwards.
Figure 5: Wellbeing trajectories after exposure to lead in childhood.
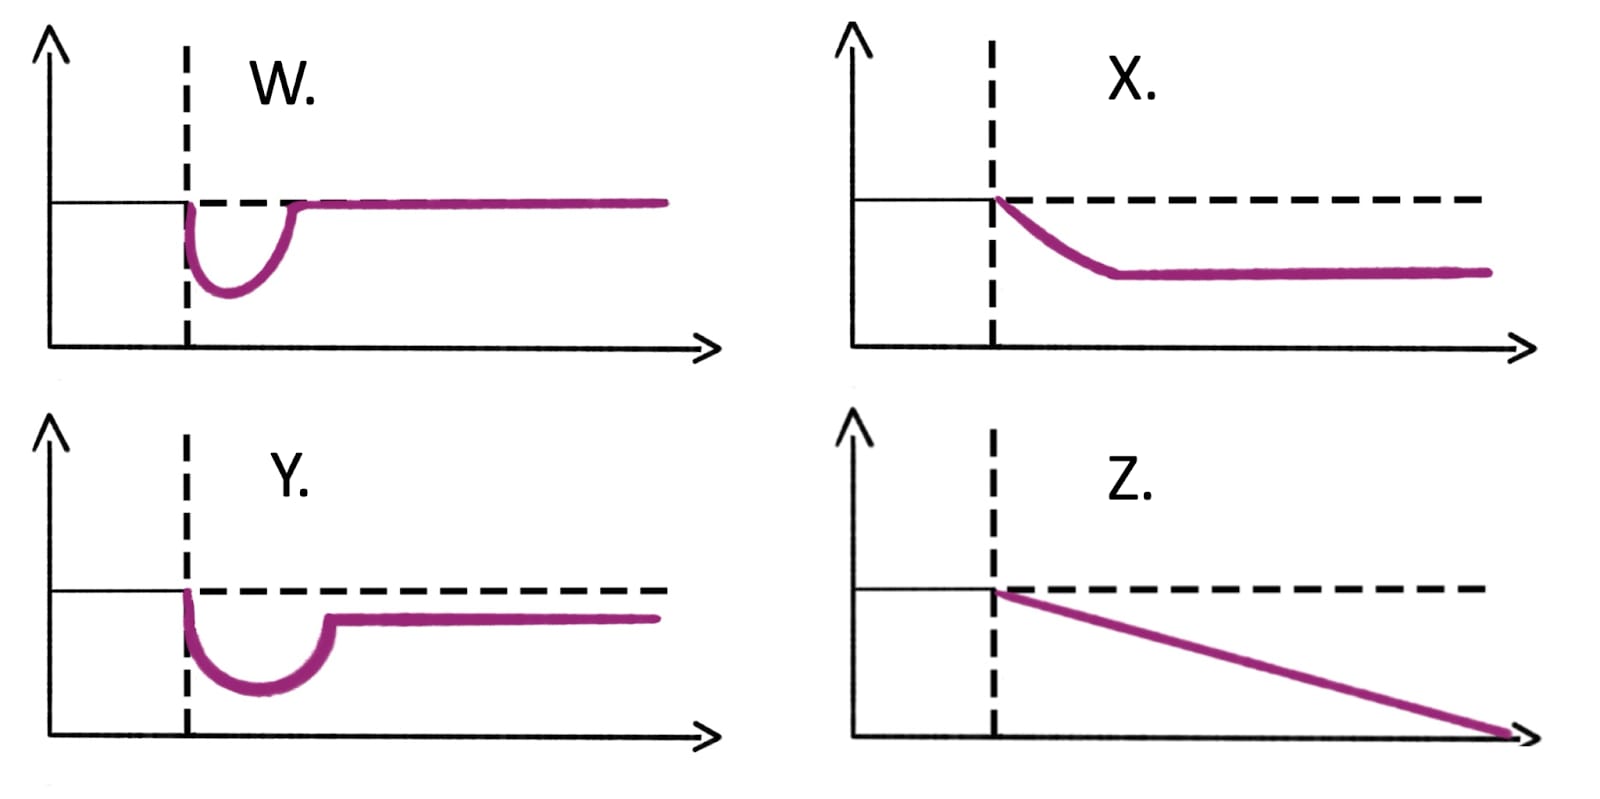
Note: the y-axis is wellbeing, and the x-axis represents time.
- W: Shock and full recovery: An increase in BLLs in childhood causes a large, immediate decrease in wellbeing which then recovers completely after some time.
- X: Shock and no recovery: An increase in childhood BLLs cause wellbeing to decrease towards a point and then wellbeing stays constant over adulthood. This is the shape we choose in our modelling.
- Y: Shock and partial recovery: An increase in BLLs in childhood causes a large, immediate decrease in wellbeing which then recovers a bit before stabilising due to the adverse consequences in adulthood and then stays constant.
- Z: Constant degeneration: An increase in BLLs in childhood causes wellbeing to decrease (linearly or exponentially) across the lifespan as the disadvantages caused by exposure compound.
A.2 We did not find data for path A (child BLL → child MHa) and did not analyse C (adult BLL → adult MHa)
We did not have time to analyse the data for path C: The current effects of adult lead exposure on MHa. There are 13 studies of BLLs in adults and their mental health mentioned in the meta-analysis by Cybulska et al. (2021). We also found a correlational study of BLLs and depression in an elderly Chinese sample (Fan et al., 2020). We did not have time to extract all the effect sizes from these studies. We focused on the long-term effects due to childhood exposure because we guessed this would be the cause of most of the harm.
Nevertheless, spending more time analysing this data would be useful for a couple of reasons. The average effect of childhood BLLs on mental health in adulthood could be contrasted to the long-term effects of increases in adult BLLs to see if these are reasonably estimated. Although, we do not know if effects due to current exposure in adulthood should be larger, smaller or the same as the long-term effects due to childhood exposure. Adults could adapt to the long-term consequences of earlier exposure and suffer more from current health problems due to current exposure, or the difficult consequences from early childhood exposure could be so important that they overshadow current health issues. Additionally, if there are sufficiently different dosage levels estimated, we might get more insight into the shape of the dose-effect relationship.
However, note that effects in adulthood will be difficult to untangle between what is due to current exposure (which might be moderated by respondents’ location, occupation, etc.) and what is due to accumulated effects and early exposure. But as we discussed in Section 3.2.2, BLLs have gone down in New Zealand and Australia by 95% since the time of the studies first survey so continued exposure to the same levels as childhood seem very unlikely.
We found no studies that report the short-run effects of lead exposure on children’s affective mental health. There is one study of the Port Pirie Cohort that looks at BLLs and internalising problems in children ages 11-13 (Burns et al., 1999). However, the internalising problems were reported by the mothers, and there are important issues with evaluating someone else’s SWB (Coleman, 2022; Schneider & Schimmack, 2009). There might be other studies out there that measure children's short term outcomes. However, because of our general experience with the SWB and mental health literature, we think that even when children’s affective mental health is measured, it is usually done so by parents or teachers and not self-reports from the children.
A.3 Issues of generalisability
Finally, we have no evidence directly connecting blood lead levels and affective mental health or SWB in low and middle-income countries (LMICs). Therefore we are assuming that there is a generalisation of the effects of BLLs and MHa in high income countries (HICs) to LMICs. This assumption is reasonable if blood lead levels work primarily through pathways that are not affected by whether the context is LMICs or HICs, such as biological mechanisms (e.g., high BLLs → damage to the brain → cognitive and emotional issues → decrease wellbeing). This might be less true if higher BLLs affect wellbeing through socially mediated mechanisms that may differ between cultures and countries (e.g., if the effects of BLLs on IQ have more adverse consequences in HICs than LMICs). At present, our views are quite unformed on how much lead exposure weights on the context and non-context dependent paths. That being said, we think that the non-context-dependent paths are large enough to make an extrapolation from a high-income country to a low-income country plausible. We have not attempted to make an adjustment for this high-income to low-income country context, but we would reconsider this with more time.
A.4 Affective mental health instead of typical SWB measures
One factor limiting our ability to model the effect of lead on wellbeing is that we only find measures of affective mental health (MHa) and not measures of SWB such as life satisfaction or happiness scores. MHa scores usually contain questions about affect (how someone is feeling) and thereby tap into people’s SWB, but they also contain other questions that are not about affect. This raises a source of uncertainty because SWB and affective mental measures may respond to changes in BLLs differently. We discussed this more in our report on the effectiveness of psychotherapy, which also only had measures of affective mental health. But we will copy a relevant passage that expands on why this may be a concern.
The PHQ-9 [a common measure of depression] asks about someone’s appetite, sleep quality, concentration, and movement in addition to whether they feel pleasure, depressed, tired, bad about oneself, or think they would be better off dead. If treatment improves the ‘subjective well-being’ factors to the same extent as the ‘functioning’ factors, then we could unproblematically compare depression measures to ‘pure’ SWB measures using changes in standard deviations. If, however, there is a disparity, that would bias such a comparison. To push the point with an implausible example, if therapy only improved functioning, but not evaluation and mood, it would be wrong to say it raises SWB and compare it to interventions that did. (p. 7, McGuire & Plant, 2021)[34]
- ^
The average for children in the USA is <1, in LMICs is 5, and the average level near sources of very high exposure (i.e., smelters) is 30.
- ^
After exposure ends, BLLs will half every 35 days. Lead clears from the bloodstream by exiting the body (e.g., through waste) or depositing into bone. However, BLLs do not only reflect current exposure because lead in the blood is slowly replenished by lead deposits in the bone; hence, when one is removed from lead exposure after a long time of exposure, their BLLs will decline rapidly before stabilising as lead from bone storage enters the bloodstream. Bone lead levels (in the tibia or patella) have a half-life of multiple decades (Obeng-Gyasi, 2008, mentions “up to 30 years”, p. 3); hence, they provide a good measure of the long-term cumulative burden of lead in the body and is a potential pathway for long-term effects of lead by restoring lead to the bloodstream over time. Another cumulative measure is a cumulative blood lead index, calculated by combining BLLs over time. BLLs tell us about current exposure whereas bone lead levels can help us measure the long-term consequences of lead exposure (Shih et al., 2007). It appears that BLLs are used much more frequently to test for lead exposure because they can be measured with a relatively cheap blood test while assessing lead levels in bones requires an x-ray. See Hu et al. (2007), for a review of how lead levels are measured in the body.
- ^
We prefer to use a SWB framework because we believe it better measures what matters, that is wellbeing; if we only measure effects on income we still need to make inferences how much those income changes affect wellbeing. We assume lead exposure’s effect on health, income, and other factors such as intelligence will be captured by their effect on people’s reports of their SWB.
- ^
Schwaba et al. (2021) used the variation in rollout dates of the clean air act, which reduced atmospheric lead, across counties in the USA.
- ^
If lead exposure affects SWB levels, then this can affect the household via ‘emotion contagion’ (i.e., positive or negative emotions are experienced to some extent by other household members). If lead exposure reduces health, educational, and economical prospects, this might place a burden on the rest of the household and community. See McGuire et al. (2022) for more detail.
- ^
Additionally, our general impression is that researchers fail to consider, collect, and report spillover effects; hence, we wouldn’t be surprised there are gaps in the evidence.
- ^
They find a meta-analytic correlation of 0.04 (95% CI: 0.03, 0.06) between local crime rates and depression. If we convert this correlation to Cohen’s d (using https://www.escal.site/) this returns a Cohen’s d of 0.08. Close to the average impact of receiving a cash transfer (McGuire et al., 2022). We’d interpret this as making crime levels go from the highest to the lowest in the sample, but we are unsure if that’s sensible.
- ^
They assume that lead exposure leads to worse school performance, which influences peers to do worse: “analysis approach seems rather suggestive by its emphasis on siblings "We compare siblings whose school-grade cohorts differ in the proportion of children with elevated BLLs, holding constant school and peers’ demographics. Having more lead-exposed peers is associated with lower high-school graduation and SAT-taking rates and increased suspensions and absences. Peer effects are larger for same-gendered students."
- ^
The search strategy involved using Google Scholar, Elicit, and Connected Papers, as well as searching through a paper’s references and other papers that cited them. We searched for combinations of ‘lead’ and ‘subjective wellbeing’, ‘happiness’, ‘life satisfaction’, and ‘mental health’.
- ^
We use d = 2*t/sqrt(N), or if converting odds ratios to Cohen’s d we use log(OR)*sqrt(3)/pi.
- ^
Winter and Sampson (2017) measured the long-term outcomes of childhood exposure on 17-year-olds, but mental health outcomes were provided by the primary caregiver (see Appendix A2 for more discussion about the issues with reports made by observers).
- ^
“The full cohort comprised all individuals born between April 1, 1972, and March 31, 1973, in Dunedin, New Zealand, who were eligible based on residence in the province and who participated in the first assessment at 3 years of age […] Assessments were performed at birth [1972-1973] and 3, 5, 7, 9, 11, 13, 15, 18, 21, 26, and 32 years of age, and the most recent data collection was completed in December 2012, when members were 38 years of age” (Reuben et al., 2019, p. 420).
- ^
It is unclear to us why only part of the cohort participated in the BLL testing. Silva et al. (1998) tested differences between the group that provided BLLs and those who did not. They found that the group that did not provide BLLs had higher behavioural problems (observer assessed) and had lower socio-economic status levels.
- ^
For example, the current CDC blood lead “reference value” for children having higher levels than most children in the US (i.e., 97.5th percentile) is 3.5 μg/dL (it was previously 5 μg/dL; CDC, 2022).
- ^
“Study covariates included family-level risk factors known to relate to childhood lead exposure or adult psychopathology and personality, including family socioeconomic status, maternal IQ, and family history of mental illness” (Reuben et al., 2019, p. 421).
- ^
The McFarlane et al. (2013) results are split between genders. Because of the limited data and because we are interested in a general relationship between BLLs and SWB, we take an aggregate between the male and female results (weighted based on their sample sizes).
- ^
Another possibility is to model it as logarithmic, where each 1 μg/dL increase in BLLs has a diminishing effect on wellbeing. In a logarithmic model, relative instead of absolute changes in BLLs are what matters. Hence, greater and greater absolute increases in BLLs (e.g., doublings) would be required to inflict the same amount of harm. We did not run this analysis due to limited time.
- ^
Figure 2 of Reuben et al. (2019), suggests that psychopathology in adulthood increases with BLLs in childhood, but the increase slows above 15 μg/dL, supporting a concave relationship. BLLs also seem to have a diminishing relationship with IQ and socioeconomic outcomes (see Figure 2 of Reuben et al., 2017; and the “Blood lead levels and IQ loss” figure of Schukraft & Bernard, 2021). It also seems possible that the effects of dosage increases when they reach acute and dangerously poisonous levels (45 μg/dL or more; BMJ, 2022) and cause severe health effects.
- ^
We use a multi-level meta-analysis because this gives us an average effect size in Cohen’s d, weighted by the precision of the studies (inverse of their standard error, which is derived from their sample size). The ‘multi-level’ part means the model will adjust for dependence between studies. We have one effect size from the Dunedin cohort and three from the Port Pirie cohort. The Port Pirie cohort effect sizes are likely to be dependent (correlated), if we did not account for this, the average would include too much influence from the Port Pirie effect sizes. See Harrer et al. (2021) for more details.
- ^
Searle et al. (2014) gives an overview of the Port Pirie cohort. Figure 1 of their paper shows the average BLLs at different ages across childhood (from 0 to 11-13). It seems that BLLs peak at age 2, decrease strongly until age 4 and then decrease slowly until age 11-13. This pattern is likely explained by younger children absorbing lead (lead looks like calcium to the body) more readily and because young children put more objects in their mouth, lead contaminated or otherwise.
- ^
This assumption may be more appropriate for high income countries than low-and-middle income countries. Further research should scrutinise and finesse these assumptions.
- ^
Although note that (1) controlling for a variable does not entail causality and (2) there could be potential unobservable variables they did not control for that could confound the results.
- ^
David Rhys-Bernard pointed out that Ericson et al. (2021) contained almost no random samples. Most children were at risk for lead exposure and so this is an upper bound of the BLLs.
- ^
A caveat is that we might expect the recent decline in lead in high income countries (HICs) like the USA (Tsoi et al., 2016) - which is associated with a decline in crime (Higney et al., 2021) - to also apply to MHa. However, symptoms of depression have increased rather than decreased over the latter half of the 20th century (Twenge et al., 2009). Note that determining the causality of such population trends is complex and beyond the scope of this report.
- ^
Compared to McFarland et al. (2022) which estimated that 53% of people alive in the USA had blood lead levels higher than 5 μg/dL as children.
- ^
The CDC states “This level is based on the 97.5th percentile of the blood lead values among U.S. children ages 1-5 years from 2015-2016 and 2017-2018 National Health and Nutrition Examination Survey (NHANES) cycles.” (CDC, 2021). They have since lowered that level to 3.5 μg/dL based on new data that BLLs continue to decrease in the USA.
- ^
We assign children with BLLs between 5 and 10 to have a BLL of 7.5, and children 10 and above to have a BLL of 10.
- ^
We use 20%, the figure given in LEEP’s costs-effectiveness analysis of their own work. We don’t think much lower than this would be reasonable. It seems plausible that lead paint is a substantial source of lead exposure in LMICs. For more related research, see Rethink Priorities’ report (Kudymowa et al., 2023) on lead exposure which we did not have time to review in detail.
- ^
We used a 25% figure based on their success in their first year in Malawi (which implies 100%), and winning another commitment after expanding to 8 more countries throughout the year. Our estimate is pulled down by a prior about a yearly success rate for general attempts at changing laws or regulations through advocacy by organisations of similar size (we would guess a 1% to 5% success rate – even this may be too high). We think that this value should decrease quickly for every year LEEP does not have similar successes.
- ^
If successful, LEEP assumes that the government will have an 80% likelihood of complying with the law. But we think this is too high and thereby we use a value of 50%. But on reflection, this may be too high as well. We would like a general prior for compliance in LMICs with environmental regulations, and to try and combine that with more relevant information from the specific cases of LEEP’s advocacy work.
- ^
The same is true for Pure Earth, another organisation working to reduce lead exposure.
- ^
These studies did not measure the average number of children impacted by a toxic site, so their sample size seems like a lower bound on the impact of the intervention. To adjust for this we naively adjust this by 2.5 times.
- ^
In essence, you randomly survey residents of a geographically small country (to minimise survey costs) with high average blood lead levels (to make it more representative of the most impactful places to remediate lead exposure). Bangladesh may be a good example because it has a large population and relatively high average BLLs (Ericson et al., 2021). Then you take the survey respondent’s BLL, and the lead content of their house paint, the dust, and assess how far their home is from sites of lead exposure like battery recyclers or manufacturers. Participants should also be asked how much they use lead-heavy spices, foods, cookware, cosmetics, and herbal remedies. Depending on the cost, one could test the lead levels in those items. Finally, the survey would ask about their SWB and mental health as outcomes.
- ^
In Appendix A of that same report we also discuss some ways to estimate a conversion rate.
- ^
Joel McGuire and Samuel Dupret contributed to the conceptualization, investigation, analysis, data curation, and writing (original as well as review and editing) of the project. Michael Plant contributed to the conceptualization, supervision, and writing (review and editing) of the project. Ryan Dwyer contributed to the writing (review and editing) of the project.
By the way, the paper "How Much Would Reducing Lead Exposure Improve Children's Learning in the Developing World?", which seems relevant to this post, was evaluated by The Unjournal – see https://unjournal.pubpub.org/pub/evalsumleadexposure/. Please let us know if you found our evaluation useful and how we can do better – contact@unjournal.org
Thanks for doing this!
PS. Looks like your link to LEEP in the summary is broken.