Really cool, it would be interesting to include variable time frames studied and different statistical methods to highlight how these choices can determine results.
P-hacking explained through an interactive visualization
The U.S. economy does better under the Republicans. Or under the Democrats. Choose your variables and get either result! This is a fantastic article on recent issues with scientific method, with an interactive visualization that demonstrates p-hacking. I've never seen anything like this before.
Note: This post was crossposted from Planned Obsolescence by the Forum team, with the author's permission. The author may not see or respond to comments on this post.
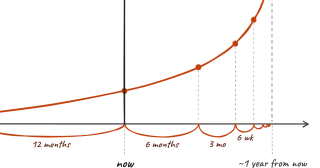
Subtitle: If acceleration compounds, the naive extrapolation implies superintelligence within a year
This post discusses a public METR report on AI R&D acceler...
TL;DR:
* When we started Rethink Priorities (RP) in 2018, our mission was, simply put, to close the knowledge gaps that stopped people from improving the world as much as they could. That hasn’t changed much, but the landscape we’re doing it in is shifting.
* In 2027, we plan to grow our core GHD, Animal Welfare, and Worldview Investigations teams to take on emerging priorities across causes, including those that the forthcoming transformative AI is creating.
...
This was cross-posted from the Animal Charity Evaluators blog.
We update our list of recommendations annually. This year, we announced our recommendations on November 10.
Most people who care about animals arrive at the same impas...

Really cool, it would be interesting to include variable time frames studied and different statistical methods to highlight how these choices can determine results.