Making predictions is a good practice, writing them down is even better.
However, we often make binary predictions when it is not necessary, such as
- Biden win popular vote: 91%
- Danish COVID deaths above 10.000 by January 1. 2022: 84%
Alternatively, we could make predictions from a normal distribution, such as ('~' means ‘comes from’):
- Biden’s popular vote ~ N(0.54, 0.03)
- Danish COVID deaths by January 1. 2022 ~ N(15,000, 5,000)
While making "Normal" predictions seems complicated, this post should be enough to get you started, and more importantly to get you a method for tracking your calibration, which is much harder with dichotomous predictions.
The key points are these:
- Predicting from a normal is surprisingly easy.
- Getting an actionable number for how over/under confident you are requires only simple math!
- The normal distribution carries more information than the Bernoulli (binary outcome such as coins) and will therefore give you more information to act on!
Things this post will answer:
- How do I make a normal prediction?
- Why do I want to do this?
- How do I track my calibration?
Quick recap about the normal distribution
The normal distribution is usually written as N(μ,σ) has 2 parameters:
- a location parameter μ (pronounced mu) which is both the most likely and the average value
- a scale parameter σ (pronounced sigma) which captures uncertainty, high σ implying high uncertainty
the 68-95-99.7 rule states that:
-
68% of your predictions should fall in μ±1σ
-
95% of your predictions should fall in μ±2σ
-
99.7% of your predictions should fall in μ±3σ
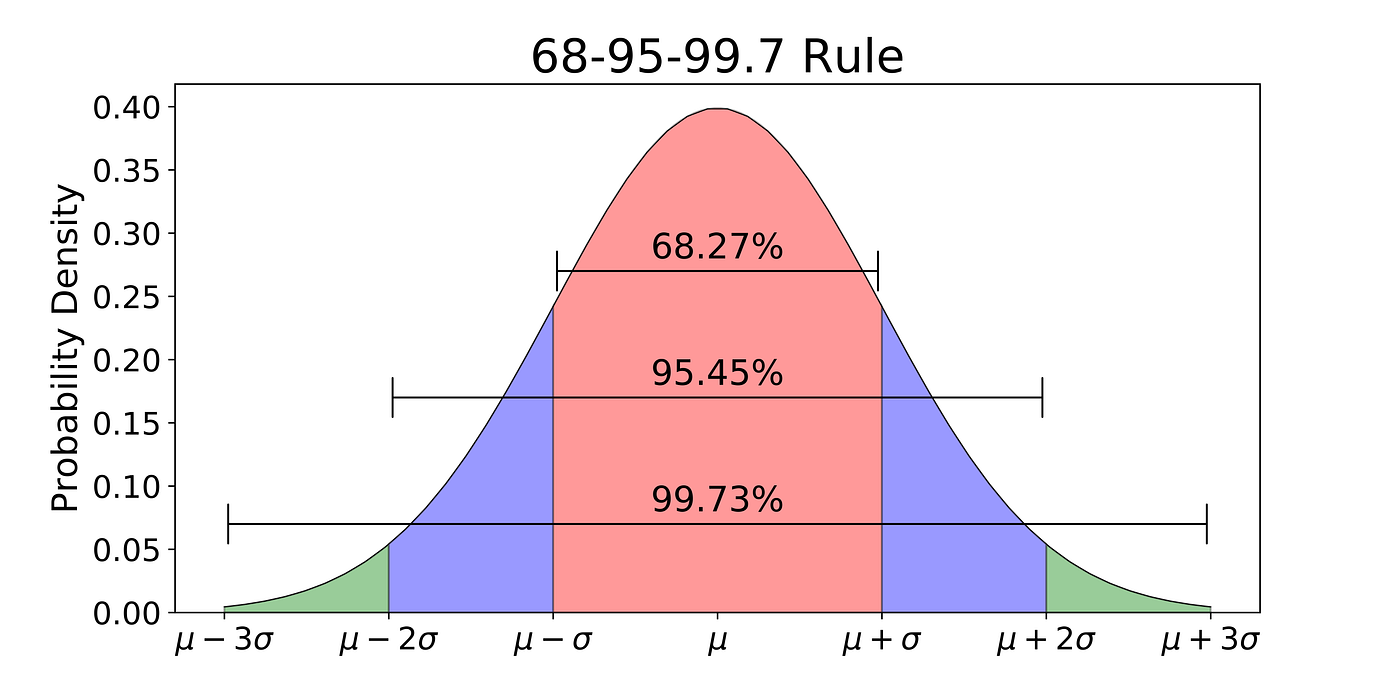
Finally 50% of the predictions should fall within 0.674≈23σ, which can be used as a quick spot check.
How to make predictions
To make a prediction, there are two steps. Step 1 is predicting μ. Step 2 is using the 68-95-99.7 rule to capture your uncertainty in μ.
I tried to predict Biden’s national vote share in the 2020 election. From the polls, I got 54% as a point estimate, so that seemed like a good guess for μ. For σ I used the 68-95-99.7 rule and tried to see what that would imply for different values of σ. Here is a table for 2-5%
| Intervals |
68% |
95% |
99.7% |
| σ=2 |
52-56% |
50-58% |
48-60% |
| σ=3 |
51-57% |
48-60% |
45-63% |
| σ=4 |
50-58% |
46-62% |
42-66% |
| σ=5 |
49-59% |
44-64% |
39-69% |
σ=2 implies a 97.5% (95% interval + tail half tail) chance that Biden would get more than 50% of the votes ); I was not that confident. σ=4 implies a 84% chance that Biden would get more than 50% of the votes (68% + 32%/2), so there is 16% chance Trump wins, I likewise found this too high, so I settled on σ=3.
Why do I want to do this
Biden Got 52% of the vote share, which was within 1 sigma of my prediction. There are two weak lessons that I drew from this ONE data point.
- The pollsters screwed up, so I should have regressed μ towards the mean (50%), such as predicting 53% instead of 54%
- The prediction was exactly 23σ from μ, so the σ was on the 50%/50% boundary just as expected. This was lucky, but it's weak evidence that the σ was well chosen.
Imagine I instead had predicted Biden wins (the popular vote) 91%, well guess what he won, so I was right... and that is it. Thinking I should have predicted 80% because the pollsters screwed up seems weird, as that is a weaker prediction and the bold one was right! I would need to predict a lot of other elections to see whether I am over or under confident.
How to track your calibration
Note: In the previous section we used μ and σ for predictions. In this section we will use μi and σi where i is the index (prediction 1, prediction 2... prediction N). We will use ^σz for the calibration point estimate; this means that ^σz is a number such as 1.73. In the next post in this series, we will use σz for the calibration distribution, this means that σz is a distribution like your predictions and thus has an uncertainty.
I also made a terrible prediction, during the early lock down in 2020. I predicted N(15,000, 5,000) COVID deaths by 2022 in Denmark. It turned out to be 3,200, which is 15000−32005000=2.36 standard deviations away, so outside the 95% interval!
In this section we will transform your predictions to the Unit normal. This is called z-scoring, because if all predictions are on the same scale, then they are comparable:
zideal∼N(0,1)
Normally when you convert to z-scores you use the data itself to calculate μ and σ, which guarantee a N(0,1). Here, we will use our predicted μ and σ. This means there will be a discrepancy between zideal and our z. This discrepancy describes how under/over confident your intervals are, and thus describes your calibration, such that if ^σz = 2 then all your intervals should be twice as wide to achieve zrecalibrated∼N(0,1)
First we z-score our data by calculating how many σ they are away from the observed data x, using this formula:
zi=μi−xiσi
Second we calculate ^σz as the RMSE (root mean squared error) of all predictions:
Var(z)=N∑i=0Var(zi)=N∑i=0z2i^σz=√Var(z)N
And that is, let's calculate ^σz for my two predictions, first we calculate the variances:
- Var(z1)=(54−523)2=49
- Var(z2)=(15000−32005000)2=5.57
Then we calculate ^σz
σz=√Var(z)N=√49+5.572=1.73
So if these were my only two predictions, then I should widen my future intervals by 73%. In other words, because ^σz is 1.73 and not 1, thus my intervals are too small by a factor of 1.73.
Still not convinced?
Here are some bonus arguments:
- Weak 50/50: Sometimes you are actually 50/50, such as Scott's prediction that Bitcoin had a 50-50 shot of going over 3000 in 2019; that could be reformulated as "Bitcoin ~ N(3000, 1500)" such that a price of 10000 counts against the prediction. Now a weak prediction still gives evidence of calibration!
- Overshooting and Undershooting: If Biden had gotten 20 or 80% of the votes, both things would be strong evidence of my prediction being wrong, where the binary predictions can only be 'wrong in one direction'
- High Confidence Predictions are easier to calibrate: In Binary land a 99% prediction is very hard to calibrate because you need to make hundreds of them to get enough data (unless many turn out wrong of course). A Corresponding Normal prediction would have a small σ and thus give as much evidence of calibration as a 60% prediction.
- Right for the Wrong Reason: All of N(50.67, 0.5), N(54, 3), N(58, 6), give Biden a 91% win chance, but for very different reasons, and will thus lead people to update differently after observing x=52.
Advanced Techniques
Sometimes your beliefs do not follow a Normal distribution. For example, the Bitcoin prediction N(3000, 1500) implies I believe there is a 2.5% chance the price will become negative, which is impossible. There are 3 solutions in increasing order of fanciness to deal with this:
- Have different σ for each direction such as (HN = Half Normal):
Bitcoin∼0.5HN(3000,σup=3000)+0.5HN(3000,σdown=1500)
This means if it's above then σ=3000, while if it's below then σ=1500. If you do this, then you can use "the relevant σ" when calibrating and ignore the other one, so if the price of bitcoin ended up being x=10.000 then z becomes 73:
z=3000−100003000=−73
- Often you believe something goes up or down by a factor, such as Bitcoin dropping to half or doubling. For ease of example let imagine that Scott thought there was a 68% chance that Bitcoin’s value would change by less than a factor of 2.
μ=log10(3000)≈3.477σ=log10(2)≈0.301log10(Bitcoin)∼N(3.477,0.301)
z-scoring works the same way, so if the Bitcoin price was 10.000 then:
log10(x)=log10(10.000)=4z≈3.477−40.301≈−1.74
- (If this makes no sense, then ignore it): Using an arbitrary distribution for predictions, then use its CDF (Universality of the Uniform) to convert to U(0,1), and then transform to z-score using the inverse CDF (percentile point function) of the Unit Normal. Finally use this as zi in when calculating your calibration.
I want you to stop and appreciate that we can get a specific actionable number after 2 predictions, which is basically impossible with binary predictions! So start making normal predictions, rather than dichotomous ones!
As a final note, keep this distinction in mind:
- If the data x and the prediction μ are close, then you are a good predictor
- If the mean prediction error on the z-scale is close to 1, then you are a well calibrated predictor.
Getting good at 1 requires domain knowledge for each specific prediction, while getting good at 2 is a general skill that applies to all predictions.
This post we calculated the point estimate ^σz=1.73 based on 2 data points. There is a lot of uncertainty in a point estimate based on two data points, so we should expect the calibration distribution over σz to be quite wide. The next post in this series will tackle this by calculating a Frequentest confidence interval for ^σz and a Bayesian posterior over σz. This allows us to make statements such as: I am 90% confident that 1<σz, so it's much more likely that I am badly calibrated than unlucky. With only two data points it is however hard to tell the difference with much confidence.
Finally I would like to thank my editors Justis Mills and eric135 for making this readable.

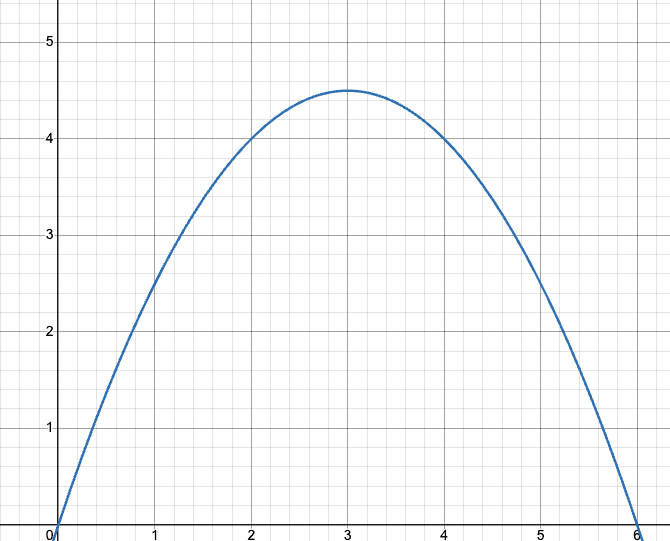
Worth noting that Metaculus has the ability to record continuous distribution predictions, including both normal predictions and much more complicated distributions. E.g. https://www.metaculus.com/questions/5301/a-city-exodus/
If you want to record your predictions for your own questions on Metaculus you can also create private questions here. https://www.metaculus.com/questions/create/