Summary
- A majority of EAs feel that the EA movement is welcoming.
- New EAs rank the movement as more welcoming than long-time EAs.
- No statistically significant trends in welcomeness by race, education, or religion could be identified.
- Selection bias, where those who find the EA community particularly unwelcoming are systematically less likely to fill out the EA survey, makes it harder to properly interpret these results
In this post, we explore which EAs find the EA movement welcoming. Keeping the effective altruist movement welcoming is a guiding principle for many EAs. The EA Survey allows us to see how EAs responded to the question of how welcoming is EA on a 5-point scale from “Very Unwelcoming” to “Very Welcoming”.
A majority of respondents in the survey find the EA movement welcoming or very welcoming. This may not be very surprising since this is from a sample of people who identify as EAs and are engaged enough to take the survey. On the margins are a small percentage (6%) of EAs who believe EA is unwelcoming, and slightly more than a quarter of EAs who find the movement very welcoming.


N.B. images can be viewed in full size if opened in a new tab.
Time in EA

Note the Y-axis: Welcomeness scale from 1-5(very unwelcoming to very welcoming) has been bounded for illustrative purposes.
Ratings of how welcoming EA is are higher among EAs that joined more recently. As there were far fewer EAs in the survey who had heard of EA before 2013, grouping these cohorts more evenly shows a linear trend. Those EAs that joined many years ago and are still part of the movement are less likely to say it is very welcoming than those who have only recently joined. A Kruskal-Wallis H test showed that there was a statistically significant difference in welcomeness between the year groups, χ2(2) = 29.295, p = 0.0001), suggesting a difference between at least two of the groups, but we cannot know from this test which groups.


Separating EAs into just two roughly even groups by year of joining, we see a significant difference in the mean welcomeness score between those who joined in 2015 or before, and those who joined from 2016-2018. Of course, from this we cannot infer that the movement was any more or less welcoming in the past when these EAs joined.

Age
The youngest group of EAs (18-22) appear to have a higher mean welcomeness score, compared to older EAs. The differences between age groups stem from the youngest cohort being more likely to rate EA as “very welcoming” than other groups, but older groups being more likely to rate EA as only “welcoming” rather than more of them rating it as “unwelcoming”. The 35+ cohort is more likely than the others to be neutral on the issue. A Kruskal-Wallis H test showed that there was a statistically significant difference in welcomeness between the age groups, χ2(2) = 18.002, p = 0.0012, suggesting a difference between at least two of the groups.


As we noted elsewhere, the changing age demographics of the movement are likely driven by survey respondents who are already in the effective altruism movement aging, rather than older people joining effective altruism. So based on the above time-in-EA effect, we would expect older EAs to view the movement as less welcoming if they are also veteran EAs. Among recent EAs there are no significant differences in the mean welcomeness score between the age groups ( Kruskal-Wallis H test χ2(2) = 4.744, p = 0.3145). However, among EAs from earlier years there appears to be greater variation, but no clear trends. This may suggest that being very new to EA has a strong positive effect that precludes the knowledge/experiences that are necessary for different age effects to take place.
Cause Selections

Those EAs with a top priority cause of Meta Charities, AI Risk, and other Long-Term Future causes find EA more welcoming than those who prioritise other cause areas. A huge majority (92.67%) of the few respondents who prioritise Nuclear Security (n=17) find EA welcoming, but also are the least likely to be neutral. Those who prioritise Mental Health (n=28) were the least likely to find EA very welcoming and the most likely to find EA unwelcoming. A Kruskal-Wallis H test showed that there was a statistically significant difference in welcomeness between the Top Priority Cause groups, χ2(2) = 27.824, p =0.0019, suggesting a difference between at least two of the groups.
This at first glance seems to run counter to the time-in-EA effect as those prioritising Meta Charities and AI Risk tend to be long-time EAs. However, those prioritising Animal Welfare or Global Poverty also tend to be long-time EAs but have lower welcomness scores, and those prioritising Nuclear Security are among the newest EAs and also see the movement as very welcoming.


First Heard of EA

One might imagine the source from which one learns about EA to affect first impressions of welcomeness. More in-person types such as personal contact, local groups, or EA Global might be associated with higher welcomeness than more distant impersonal online sources like books, the EA Facebook page or the EA Forum. However, there is no apparent personal/online division. EAs that first heard of EA via REG/EAF/FRI/the Swiss group have the highest average welcomeness rating, followed closely by The Life You Can Save organisation. Those coming via Animal Charity Evaluators feel EA is the least welcoming. However, a Kruskal-Wallis H test showed that there was not a statistically significant difference in welcomeness between the First Heard groups, χ2(2) = 14.250, p = 0.7126. These differences are neither significant nor very substantial, with the exception of those hearing of EA via ACE which may reflect the lower priority of Animal Welfare/Rights in EA, the organisation’s involvement in both EA and traditional animal activist communities, and that this only comprises a small number of survey respondents (n=17).


Country/City

Swiss EAs have a high mean welcomeness score, in contrast to the low mean of neighbouring German EAs who are among the most likely to find the movement unwelcoming. EAs from the UK and USA, who make up a plurality of the movement, are very similar in how they view the welcomeness of EA. A Kruskal-Wallis H test showed that there was a statistically significant difference in welcomeness between the country groups, χ2(2) = 28.209, p =0.0004, suggesting a difference between at least two of the groups. There is no apparent trend between countries, average time-in-EA, and welcomeness.


22% of Berlin EAs see EA as unwelcoming or very unwelcoming compared to only 4% of Melbourne EAs. 32% of Melbourne EAs view the movement as very welcoming. EAs in London and the San Francisco Bay Area, which are the most commonly reported locations, have relatively lower mean welcomeness ratings. A Kruskal-Wallis H test showed that there was a statistically significant difference in welcomeness between the city groups, χ2(2) = 24.185, p =0.0011, suggesting a difference between at least two of the groups.


Politics

We have shown elsewhere that most effective altruists are on the left/center-left, and there is interest in how Effective Altruists can be welcoming to conservatives. There are too few EAs on the “Right” (n=9) to say anything meaningful about how welcoming they rated EA, however, their absence in raw numbers from the survey is perhaps more telling. Almost no Libertarian EAs (0.65%) rate the movement as very unwelcoming, while 6.67% of those on the Center-Right and 9.06% of Left EAs rate the movement as unwelcoming or very unwelcoming. However, a Kruskal-Wallis H test showed that there was not a statistically significant difference in welcomeness between at least two of the politics groups, χ2(2) = 5.958, p =0.3103.


Group Membership

Members of local EA groups are significantly more likely to rate EA as welcoming than non-members, as are members of the EA Facebook page. There is not a significant difference between Facebook and non-Facebook members among Local Group members, though there is among non-local group members. Making EA groups more welcoming may then seem a useful way to keep the EA movement open.

The membership involvement clusters we identified in a previous post show that the two groups (clusters 4 and 5) with 100% local group membership see EA as the most welcoming. This makes sense given the differences identified above. The uninvolved group (cluster 1) are unsurprisingly the least likely to view EA as welcoming. A Kruskal-Wallis H test showed that there was a statistically significant difference in welcomeness between the involvement groups, χ2(2) = 61.070, p =0.0001, suggesting a difference between at least two of the groups.

Note the Y-axis: Welcomeness scale from 1-5 has been bounded for illustrative purposes.


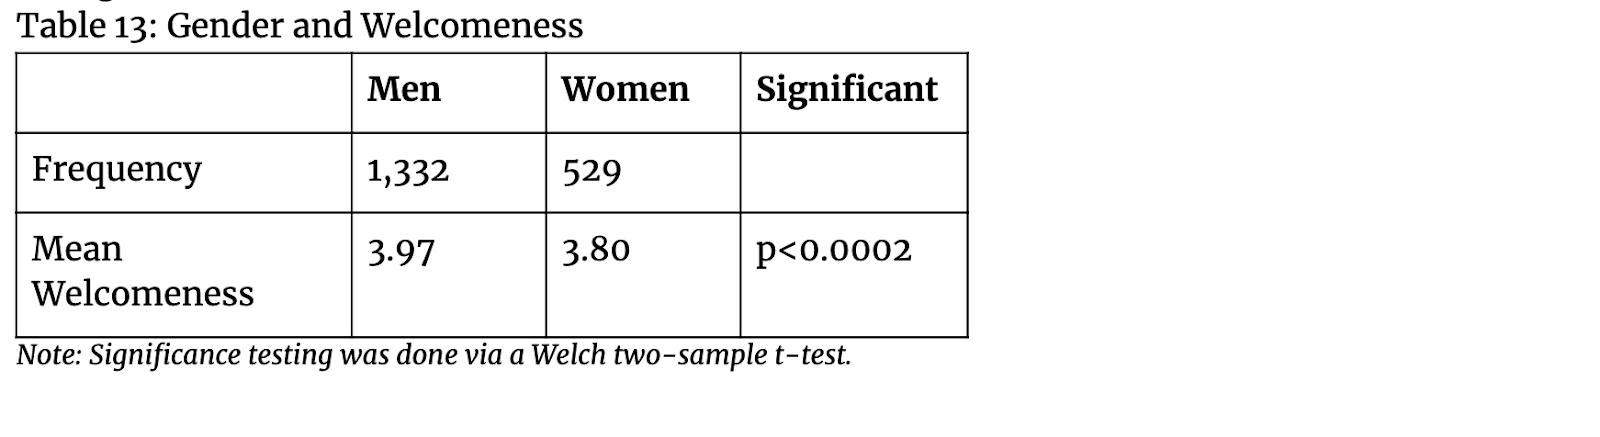
Gender

There appears to be evidence of a gender difference, with women ranking EA in 2018 as less welcoming on average than men do. This difference is statistically significant, however, it seems to stem mainly from more men rating EA as very welcoming, and more women being neutral, rather than substantial differences in the belief that EA is unwelcoming. The apparent difference may also partly stem from women being less likely to be involved across a wide range of dimensions in EA, leading to more neutral ratings. Regarding other demographic measures, there were no statistically significant trends in welcomeness by race, education or religion. This doesn’t mean that these trends don’t exist, just that we couldn’t identify them with the data that we have.
Career

Those respondents that indicated they expect to shift their career based on EA are more likely to view EA in 2018 as welcoming than those who don’t, however, there is no difference between those who have already changed career based on EA and those who haven’t.

8.40% of those in Direct Charity or Non-Profit jobs view the movement as unwelcoming or very unwelcoming, compared to ~5% for other career groups. Those in Research careers are the most likely to rate the movement as welcoming. A Kruskal-Wallis H test showed that there was a statistically significant difference in welcomeness between the career types, χ2(2) = 10.463, p = 0.0150, suggesting a difference between at least two of the groups.


Regression
Using an ordered regression model, these predictors on the EA welcomeness scale only explained 2% to 3% of the variation. This means almost all of the differences in people's perceptions of the welcomeness of EA come from factors that aren't represented in the model or data we captured in the survey. A separate model with Top Priority cause was made due to the relatively large n of respondents who offered no or multiple top causes and were excluded. Overall, the effect sizes appear to be quite small and many of the significant group differences suggested above are not significant so appear to be confounded rather than true associations. It suggests statistically significant increases in welcomeness among those who have joined EA more recently, are men, are Local EA Group members, or expect to shift their careers because of EA (though confounded by top priority cause it appears). Notably, age group is not significant. For reasons of space and simplicity, Country and Top Priority Cause are presented in the table below as the most popular response category (USA and Global Poverty) in comparison to all others. To view a regression table with the categories demarcated, click here. In Models 3 and 4, there are no significant differences between any single top priority cause when each is compared to all the others combined. Similarly, while the USA and Germany appear significantly different when each are compared to the combined other countries, this is not significant once top priority cause is controlled for. However, in Model 6 there is a significant (p<0.05) positive difference in welcomeness between AI Risk and Global Poverty, and between Meta Charities and Global Poverty.

Selection Bias
One issue when interpreting these results is that there is a strong potential for our findings to be undermined by selection bias. We can only collect data from those people we can see - those who find the EA community so unwelcoming that they do not fill out the EA Survey at all will not be included in our results and we thus cannot learn from them. This could mean that we miss important trends that would be noticed if we somehow had a sample that was perfectly representative of all current and prior EAs. Measuring the EA-related sentiment among potential EAs and/or people who left EA was unfortunately impossible with the main survey and would require actively reaching out to these highly dispersed groups. Therefore, we cannot here make claims about how welcoming the movement is to those outside it, and what policies might be best enacted to improve this. The relative low number of some groups or categories may be suggestive of this, but not definitive. Instead, we can offer insights into which groups are represented in EA, even if they haven’t found it very welcoming, and which groups feel especially welcome.
Multiple comparisons
Given the number of hypothesis tests we do in this piece, we may run into problems of multiple comparisons, so it is also informative to do Bonferroni correction - that is count the number of hypothesis tests (both Kruskal-Wallis and T-tests) in the analysis and note whether any p-values significant at the p<0.05 level remain significant at the p<0.05/(N of tested hypotheses) level. We ran 17 such tests (including tests done but not included in this post), making our adjusted threshold p<.0029. Of all the results we found here, only the finding of welcomeness by career type becomes statistically insignificant under this more stringent criterion.
Conclusion
The vast majority of EAs feel that the movement is welcoming and the continued growth of the movement is a positive sign. Welcomeness-related differences between various groups tend to be minor, so no major cluster appears to be substantially excluded in comparison with the baseline rating. However, we do not have confident estimates of attrition rates from the data available here to discuss any selection or survivorship bias. Among those still in the movement, we can discern some differences in terms of welcomeness ratings.
EAs in local groups, in particular, view the movement as more welcoming than those not in local groups, though there are also potential selection effects at work here. That EAs who have been around the longest tend to view the movement as less welcoming is interesting, as it may suggest the initial positive bump in welcomeness ratings among new EAs could subside once they learn or experience more and give way to the other differences highlighted here.
Updates and Corrections
Upon helpful feedback from Greg Lewis, initially presented chi-squared tests have been replaced with Kruskal-Wallis Test results. We have also added a discussion of Selection Bias and adjustment for multiple comparisons.
Text was added to offer more discussion of selection bias, regression design, and issues of multiple comparisons.
We had previously concluded that “EAs prioritising Meta Charities, and Long-Term Future causes are more likely to find EA welcoming.” Upon further reflection on feedback from Greg, we have decided to no longer emphasize this conclusion. In fact, we can only conclude that EAs prioritising Meta Charities, and Reducing Risks from AI are more likely to find EA welcoming relative to EAs prioritising Global Poverty. This still seems important as a plurality of EAs rank Global Poverty as their top cause, but the previous phrasing was not accurate.
Credits
This post was written and with analysis by Neil Dullaghan, with contributions from David Moss.
Thanks to Peter Hurford, Luisa Rodriguez, and Marcin Kowrygo for comment and Kim Cuddington for data visualisation assistance.
The annual EA Survey is a project of Rethink Charity with analysis and commentary from researchers at Rethink Priorities.
Supporting Documents
Other articles in the 2018 EA Survey Series:
I - Community Demographics & Characteristics
II - Distribution & Analysis Methodology
III - How do people get involved in EA?
IV - Subscribers and Identifiers
VIII- Where People First Hear About EA and Higher Levels of Involvement
IX- Geographic Differences in EA
XI- How Long Do EAs Stay in EA?
XII- Do EA Survey Takers Keep Their GWWC Pledge?
Prior EA Surveys conducted by Rethink Charity:
The 2017 Survey of Effective Altruists
The 2015 Survey of Effective Altruists: Results and Analysis
The 2014 Survey of Effective Altruists: Results and Analysis
Thanks for this - the presentation of results is admirably clear. Yet I have two worries:
1) Statistics: I think the statistical methods are frequently missing the mark. Sometimes this is a minor quibble; other times more substantial:
a) The dependent variable (welcomeness - assessed by typical Likert scale) is ordinal data i.e. 'very welcoming' > welcoming > neither etc). The write-up often treats this statistically either as categorical data (e.g. chi2) or interval data (e.g. t-test, the use of 'mean welcomeness' throughout). Doing the latter is generally fine (the data looks pretty well-behaved, t-tests are pretty robust, and I recall controversy about when to use non-parametric tests). Doing the former isn't.
chi2 tests against the null of (in essence) the proportion in each 'row' of a table is the same between columns: it treats the ordered scale as a set of 5 categories (e.g. like countries, ethnicities, etc.). Statistical significance for this is not specific for 'more or less welcoming': two groups with identical 'mean welcomeness' yet with a different distribution across levels could 'pass statistical significance' by chi2. Tests for 'ranked dependent by categorical independent' data exist (e.g. Kruskall-Wallis) and should be used instead.
Further, chi2 assumes the independent variable is categorical too. Usually it is (e.g. where you heard about EA) but sometimes it isn't (e.g. age, year of joining, ?political views). For similar reasons to the above, a significant chi2 result doesn't demonstrate a (monotonic) relationship between welcomeness and time in EA. There are statistical tests for trend which can be used instead.
Still further, chi2 (ditto K-W) is an 'omnibus' test: it tells you your data is surprising given the null, but not what is driving the surprise. Thus statistical significance 'on the test' doesn't indicate whether particular differences (whether highlighted in the write-up or otherwise) are statistically significant.
b) The write-up also seems to be switching between the descriptive and the inferential in an unclear way. Some remarks on the data are accompanied with statistical tests (implying an inference from the sample to the population), whilst similar remarks are not: compare the section on 'time joining EA' (where there are a couple of tests to support a 'longer in EA - finding it more welcoming'), versus age (which notes a variety of differences between age groups, but no statistical tests).
My impression is the better course is the former, and so differences being highlighted to the readers interest should be accompanied by whether these differences are statistically significant. This uniform approach also avoids 'garden of forking path' worries (e.g. 'Did you not report p values for the age section because you didn't test, or because they weren't significant?')
c) The ordered regression is comfortably the 'highest yield' bit of statistics performed, as it is appropriate to the data, often more sensitive (e.g. lumping the data into two groups by time in EA and t-testing is inferior technique to regression), and helps answer questions of confounding sometimes alluded to in the text ("Welcoming seems to go up with X, but down with Y, which is weird because X and Y correlate"), but uniformly important ("People in local groups find EA more welcoming - but could that driven by other variables between those within and without local groups?")
It deserves a much fuller explanation (e.g. how did 'country' and 'top priority cause' become single variables with a single regression coefficient - is the 'lumping together' implied in the text post-hoc? How was variable selection/model choice decided? Model 1 lacks only 'top priority cause', so assumedly 'adding in political spectrum didn't improve explanatory power' is a typo?). When its results vary with the univarible analysis, I would prefer the former over the latter. That fb membership, career shifting (in model 2), career type, and politics aren't significant predictors means their relationship to welcomingness, if, even if statistically significant, probably confounding rather than true association.
It is unfortunate some of these are highlighted in the summary and conclusion, even more so when a crucial negative result from the regression is relatively unsung. The ~3% R^2 and very small coefficients (with the arguable exception of sex) implies very limited practical significance: almost all the variation in whether an EA finds EA welcoming or not is not predicted by the factors investigated; although EAs in local groups find EA more welcoming, this effect - albeit statistically significant - is (if I interpret the regression right) around 0.1% of a single likert level.
2) Selection bias: A perennial challenge to the survey is issues of selection bias. Although happily noted frequently in discussion, I still feel it is underweighed: I think it is huge enough to make the results all but uninterpretable.
Facially, one would expect those who find EA less welcoming are less likely to join. We probably wouldn't think that how welcoming people already in EA think it is would be informative to how good it is at welcoming people into EA (caricatured example: I wouldn't be that surprised if members of something like the KKK found it generally welcoming). As mentioned in the 'politics' section, the relative population size seems a far better metric (although the baseline hard to establish) to which welcomingness adds very little.
Crucially, selection bias imposes some nigh-inscrutable but potentially sign-inverting considerations to any policy 'upshot'. A less welcoming subgroup could be cause for concern, but alternatively cause for celebration: perhaps this subgroup offers other 'pull factors' that mean people who find EA is less welcoming nonetheless join and stick around within it (and vice versa: maybe subgroups whose members find EA very welcoming do so because they indirectly filter out everyone who doesn't). Akin to Wald and the bombers in WW2, it is crucial to work out which. But I don't think we can here.
Thank you Gregory for the very constructive criticism, it strikes me as one of the most useful types of comments a post can receive, and is good for me personally as a researcher.
"Misuse of Chi^2"
That is a very fair critique of the use of Chi^2 here. I have replaced the Chi^2 tests with K-W tests where appropriate and made a comment in the “updates and corrections” section noting this. Replacing the Chi^2 tests as K-Ws did not change any of our results in any of the sections except politics (which became non-significant). Looking into the change in the politics finding would require more work at this stage to drill down into more detail, and the regression results presented later suggest doing this might not be of much added value.
"Descriptive-v-inferential"
My intention in each sub-section was to report whether there was any significant relationship (using the inappropriate Chi^2 test) or use inferential style language in the cases where I used t-tests. In cases where I had not found a relationship (e.g., First Heard of EA). I used language to that effect "These differences are neither significant nor very substantial". In the specific case of age that you mention I mistakenly diverged from this intended style by not using either a reference to a significance test or language to that effect. I have added the K-W test to this section. Certainly, more can be done to ensure the style is more consistent and does not mislead the reader.
"The ordered regression"
You're right that the discussion of the regression was insufficient. I wanted to include the regression in the post because, as you mentioned, regression analysis can do a lot to clarify these relationships. But I decided to keep the discussion short because the regression seemed to offer very limited practical significance (as you pointed out). Had I decided to give it more weight in my analysis then it certainly would be appropriate to offer a fuller explanation. Nonetheless, I should have been clearer about the limited usefulness of the regression, and noted it as the reason for the short discussion.
Regardless, here's a more detailed explanation:
Variables in the model (and piece in general) were chosen based on cleavages in EA we have found in previous posts to explore how they might differ in terms of welcomeness. "Top Priority" was a separate model because so many respondents either did not give a top priority or gave many and thus were excluded. It was disappointing that the factors in the survey data explained so little of the variation.Nevertheless, I thought it would still be of interest to see that the major themes we have been discussing in the survey series so far don't seem to be very important on this measure.
The line regarding political spectrum does indeed appear to be a mistake so I have removed it and stated something to this effect in the “updates and corrections” section.
For simplicity, Country and Top Priority Cause were each presented as a variable where the most popular response was compared to all the others combined. These were the USA and Global Poverty, though the table and discussion should have been more explicit about this, and has been updated accordingly. Country was categorised into the top countries by number of responses; USA, UK, Germany, Australia, Canada, Switzerland, Sweden, Netherlands, and “other”. The initial significance we noted in both of these categories was in comparison only to the most popular response; those prioritising AI Risk and Meta Charities appeared significantly more likely to view EA as more welcoming compared to Global Poverty, and those EAs from Australia and Canada appeared significantly more likely to view EA as more welcoming compared to American EAs. However, it would have been more appropriate to model each country as a dummy variable also, which has been done in the regression table linked to here. Due to how our previous phrasing of this result could be misinterpreted, we have decided to to de-emphasise this conclusion.
"Selection bias"
As you point out, measuring the EA-related sentiment among potential EAs and/or people who left EA was unfortunately impossible with the main survey and would require actively reaching out to these highly dispersed groups. There was no intention in this post to argue how good the movement is at welcoming people into EA overall, although some may attempt to do so based on the results presented here and so it is wise to add caveats about the limits to doing so. I think your suggestion of focusing more on population sizes relative to a baseline (where possible to establish) is a great idea as a first step in moving in that direction. If this were the aim of the post then certainly the results presented here do little to accomplish that goal. Instead, we could only look at how welcoming people already in EA think it is, the results of which I don't think are "all but uninterpretable".There do seem to be meaningful differences in welcomeness perceptions within our sample that still seem worth talking about, even if we can't see the differences outside our sample. If we think the differences in perceived welcomeness are predictors of dropping out of EA, then these findings might hint at factors that influence retention. Again, our data do not allow us to make these inferences about retention but could be useful signposts for further analyses to explore how community perceptions of welcomeness may affect EA retention.
In fact, we debated internally whether to publish this piece at all due to concerns of selection bias and we were unsure what conclusions we could actually draw. We ultimately went ahead with publishing it, though with the decision to not make any specific recommendations. Even still, I can see how we ended up overstating what can be concluded from this data. I certainly share your concern that any "policy" devised simply by looking at the results presented here would almost certainly miss the mark. It was not the intention here to make policy suggestions on how to make EA more welcoming (though there is a sentence in the Local Groups section that does slide in that direction), as clearly a lot more information is needed from former or potential-but-non-EAs.
Once again, many thanks for your thoughtful comments and suggestions.
Thanks for your reply, and the tweaks to the post. However:
I think the regression having little practical significance makes it the most useful part of the analysis: it illustrates the variation in the dependent variable is poorly explained by all/any of the variables investigated, that many of the associations found by bivariate assessment vanish when controlling for others, and gives better estimates of the effect size (and thus relative importance) of those which still exert statistical effect. Noting, essentially, "But the regression analyses implies a lot of the associations we previously noted are either confounded or trivial, and even when we take all the variables together we can't predict welcomeness much better than taking the average" at the end buries the lede.
A worked example. The summary notes, "EAs in local groups, in particular, view the movement as more welcoming than those not in local groups" (my emphasis). If you look at the t-test between members and nonmembers there's a difference of ~ 0.25 'likert levels', which is one of the larger effect sizes reported.
Yet we presumably care about how much of this difference can be attributed to local groups. If the story is "EAs in local groups find EA more welcoming because they skew (say) male and young", it seems better to focus attention on these things instead. Regression isn't a magic wand to remove confounding (cf.), but it tends to be better than not doing it at all (which is essentially what is being done when you test association between a single variable and the outcome).
As I noted before, the 'effect size' of local group membership when controlling for other variables is still statistically significant, but utterly trivial. Again: it is ~ 1/1000th of a likert level; the upper bound of the 95% confidence interval would only be ~ 2/1000th of a likert level. By comparison, the effect of gender or year of involvement are two orders of magnitude greater. It seems better in the conclusion to highlight results like these, rather than results the analysis demonstrates have no meaningful effect when other variables are controlled for.
A few more minor things:
I'm appreciating this exchange. I wonder if part of the problem stems from the word welcoming*, especially as selection bias naturally tends to neglect those who didn't feel welcome. This could especially be a problem for assessing how welcome women feel, if what's happening is that many quickly don't feel welcome and simply leave.
One way to overcome this would be to set up a contact list for a group of male and female people attending an intro event. Even 10 of each (and 5 others) could be useful, not for statistical significance but for an initial assessment at low cost in time and effort. This could be via email but better would be via phone also. You could follow up after the first activity, at the end of the session, a month later and a year later. It could be repeated on a small scale at several intro events, which might give more initial info than a large sample at one event, which might not be representative.
The most powerful tool might be telephoned "semi-structured interviews" which is a well-established social science and participatory appraisal method. Again you wouldn't be looking for statistical significance but more for hypothesis generation, which could then be used in a follow up. eg if a lot of women were saying something like "I just didn't feel comfortable" or "it was too ...." that could suggest a more specific follow up study, or even lead directly to thoughts about a way to redesign intros.
It helps if such a survey wasn't conducted by someone seen as an organiser, and perhaps ideally a woman?
Wow, this is incredibly comprehensive - great work, thanks to authors!
Considering how many graphs and tables there are, I am surprised there's no mention of subjective welcomeness conditional on race, ethnicity, and socioeconomic background.
Do you know if this data exists?
Also, were there any questions getting at why EA is or is not welcoming?
Thanks! :)
Thanks! Glad you enjoyed the post.
That data certainly does exist as we discuss in a previous post: https://forum.effectivealtruism.org/posts/S2Sonawxz2cY4YdXK/ea-survey-2018-series-community-demographics-and?fbclid=IwAR1JEucxFIdHfTqi3P2sC0FMssaZgNPeb3uaiCU3sOaOauoFLFg7Uby0lMk
The low N in many of the categories of those characteristics makes any inference difficult, though there are no apparent differences in welcomeness along lines of race, education, or religion.
There was no specific question in this year's survey following up on reasons for welcomeness ratings.
I haven't seen people act differently towards people who prioritize mental health. Wonder if the lower score has something to do with the kind of person who prioritizes mental health? People who are more mentally/emotionally sensitive and therefore feel less welcomed?
Note: I don't know very much about mental health, and the first two paragraphs of this comment are highly speculative.
That would be my theory, though I might not use the word "sensitive". I'd think that part of the effect (probably most of it) has something to do with lower average happiness and/or higher rates of depression/anxiety among people who prioritize mental health.
I'd guess that people who strongly support that cause are more likely to have direct experience with mental health issues than other people in EA. Having a lower level of happiness/life satisfaction could then translate into generally lower "scores" on surveys asking about many different positive feelings, including "how welcome you feel".
Of course, mental health isn't a very well-supported cause area within EA, so it could also be the case that people who favor it have a hard time finding other people in EA who share their level of support. It's probably much easier to find someone who knows a lot about animal advocacy at an EA event than to find someone who knows a lot about mental health as a cause area, and 1-on-1 conversations are a big driver of "feeling welcome".
(Anecdotally, experiencing intermittent mild-to-moderate depression over the last few years seems to have made me more likely to read about EA work in mental health. Empathy tends to influence the causes to which I am emotionally drawn, inside or outside of EA.)