Comments
Two formatting issues:
1. IV - Subscribers and Identifiers leads to a comment
2. VII- Group Membership should lead to https://forum.effectivealtruism.org/posts/kqTTyz7BCt6ExrfF6/ea-survey-2018-series-group-membership
Two formatting issues:
1. IV - Subscribers and Identifiers leads to a comment
2. VII- Group Membership should lead to https://forum.effectivealtruism.org/posts/kqTTyz7BCt6ExrfF6/ea-survey-2018-series-group-membership
Thanks! Fixed (I hope).
In a reply to our previous post in this series titled 'How do people get involved in EA?, Ben Todd made the following request:
[An] additional analysis which would be great is if you could identify the 20% of the respondents who seem most involved and dedicated, and then repeat the analysis by source for this sub-group. This would give us some sense of the quality as well as the scale of the reach of different sources.
We are happy to oblige!
Selecting Proxies for Involvement
Naturally, what measure we should use to determine the “most involved and dedicated” EAs is controversial. Any proxy we select will also necessarily be imperfect as there will almost certainly be exceptions to the rule.
In this post we examine two potential proxies, which may potentially each capture two distinct modes of EA involvement.
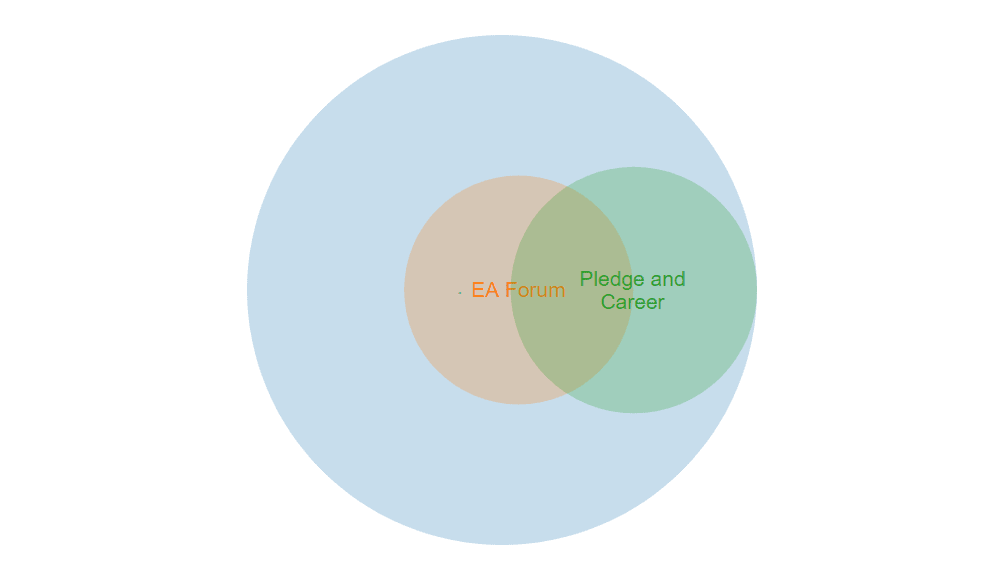
The first is EA Forum membership. This seems likely to serve as a reasonable proxy for respondents who are especially likely to be interested in and familiar with in-depth EA discussions. As it happens, it also picks out a group that make up almost exactly 20% of respondents (20.1%).
We also look at the group of respondents who have taken the Giving What We Can Pledge and report that effective altruism has changed their career path or they expect that it will. Close to a third of respondents (32.4%) had taken the GWWC Pledge, similarly 33.9% report that EA has shifted their career path while a slighter larger percentage report that they expect it will shift their career path (37.7%). These factors may capture a distinct dimension to involvement and dedication (e.g. actually taking the Pledge and changing career, but not necessarily being deeply involved or familiar with EA concepts or discussions).
A slightly higher percentage of respondents had both taken the GWWC Pledge and made (or expected to make) a career change (22.9%) than were EA Forum members. Notably, however, the GWWC-Career group and the Forum group were not particularly overlapping. Only about 38% of people in this group were members of the Forum, while only 43% of Forum members had both taken the Pledge and made or expect to make a career change (though this is a significantly higher proportion than that of the sample as a whole).
EA Forum Membership
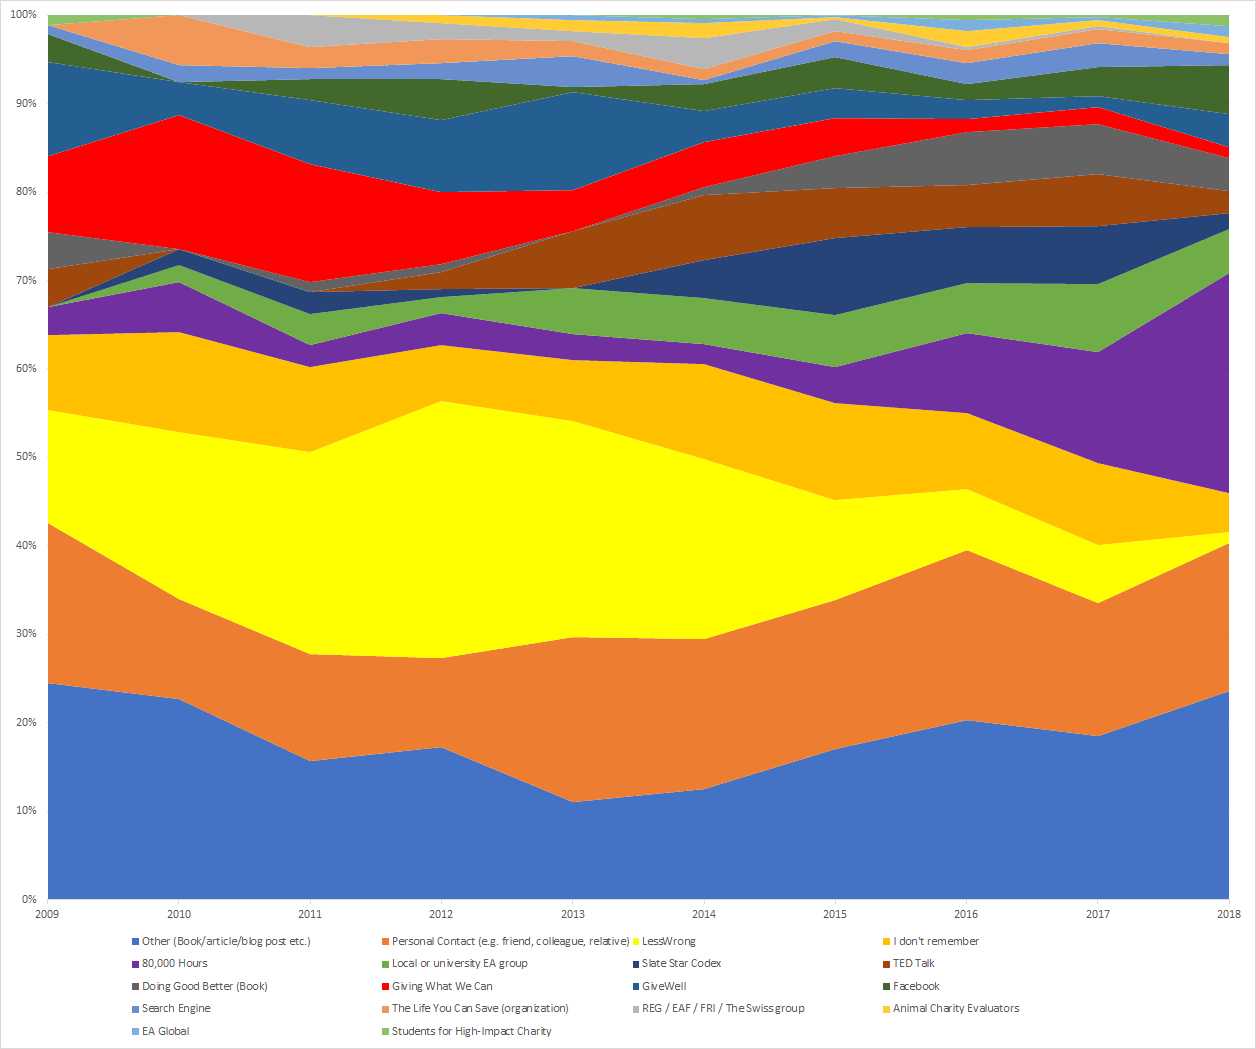
While we present a breakdown of where EA Forum members (compared to non-members) first hear about EA below, we think these raw figures are likely to be of limited use for discerning which routes tend to lead to a higher proportion of more involved members.
This is largely due to possible confounders, the most obvious of which is when an individual first heard of EA. As noted in our previous post, where EAs first hear about EA has changed dramatically over time. For example, a full 25% of EAs hearing about EA in the last year, report hearing about EA from 80,000 Hours, compared to less than 5% in earlier years.
N.B. images can be viewed in full size if opened in a new tab.
In addition, many more EAs joined in more recent years (apart from in 2018, when the survey was run) than in earlier years. This means that 80,000 Hours is heavily overrepresented among those newest to EA.
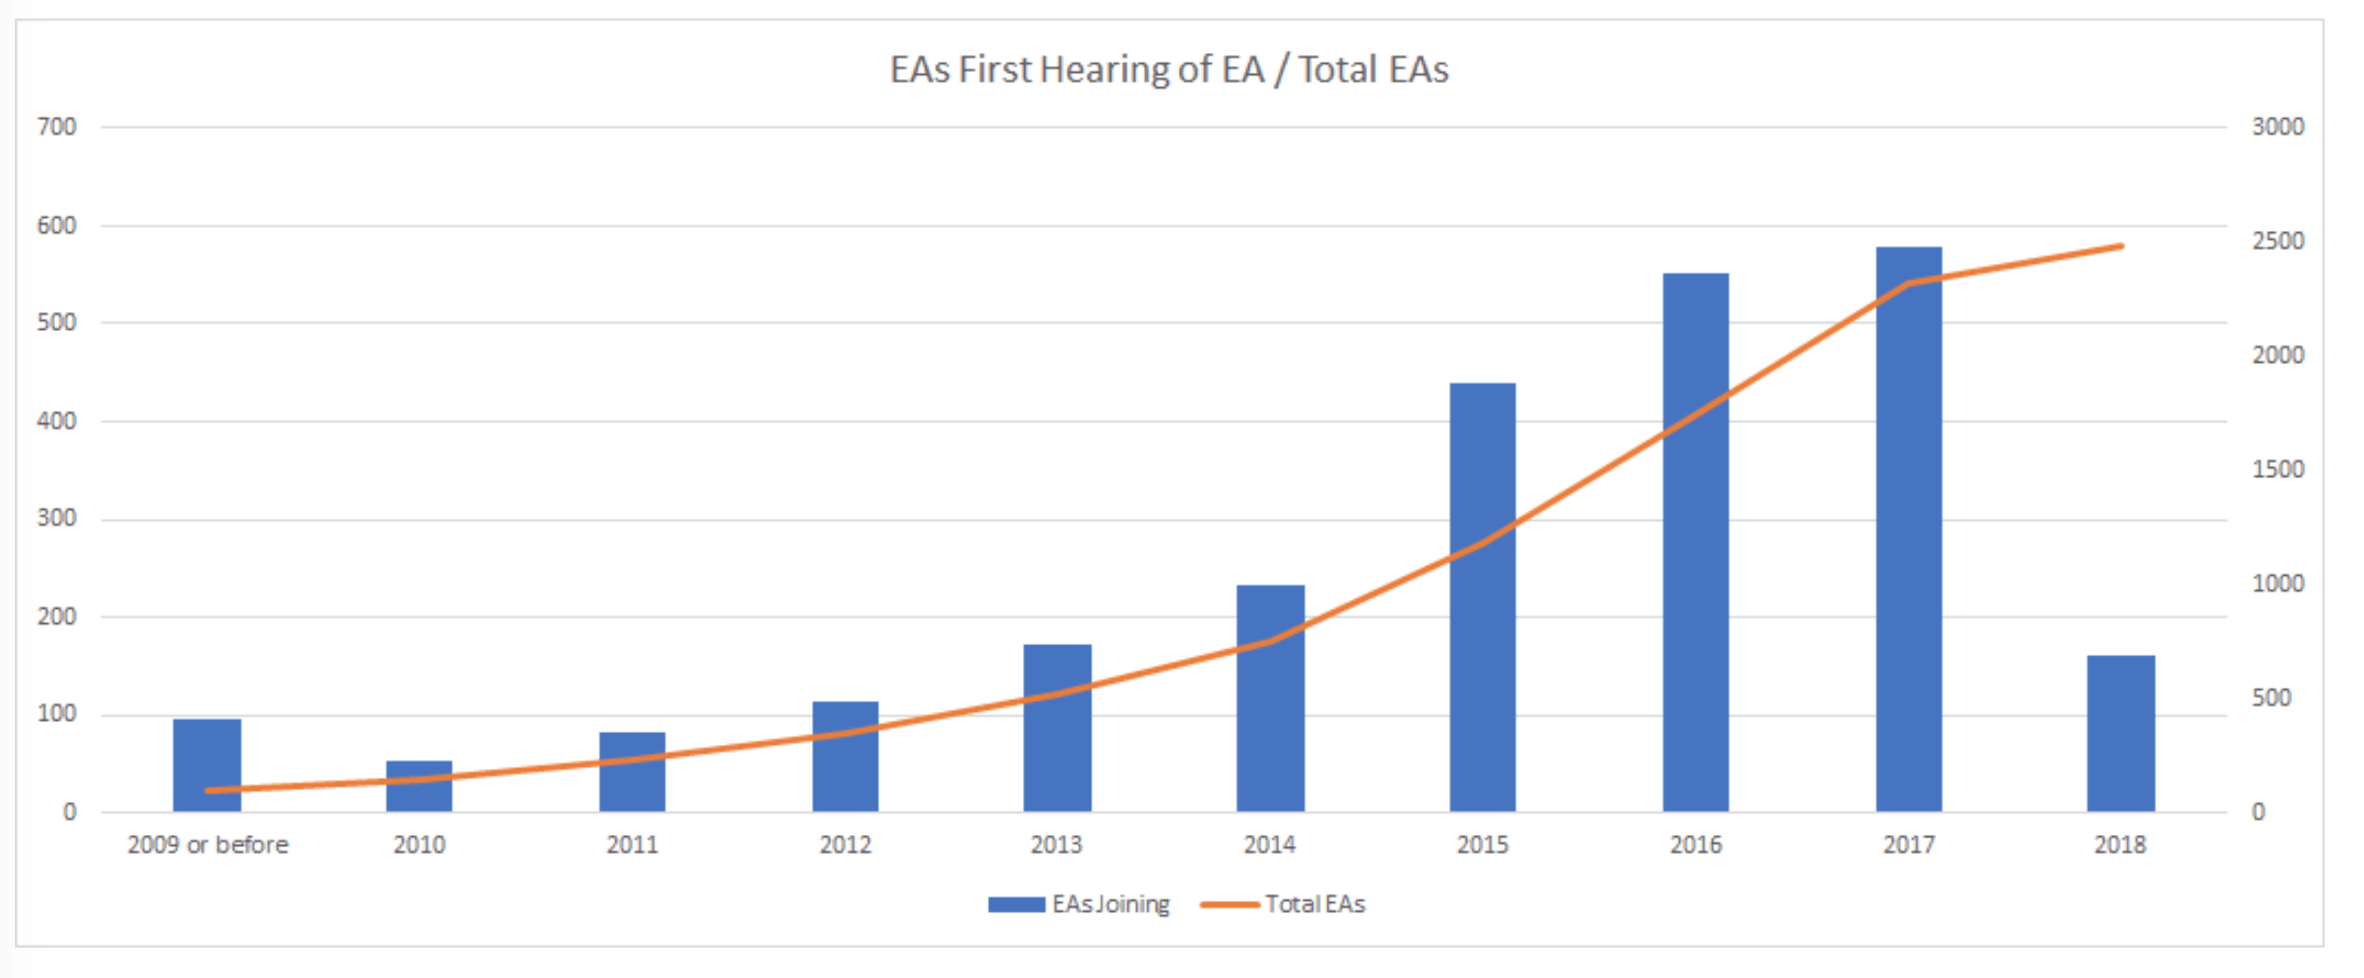
As we know that respondents who more recently heard of EA are much less likely to be more involved in EA (as captured by metrics such as EA Forum membership- see graph below), this means that we would expect those who heard of EA from 80,000 Hours to contain many more new and less involved EAs.
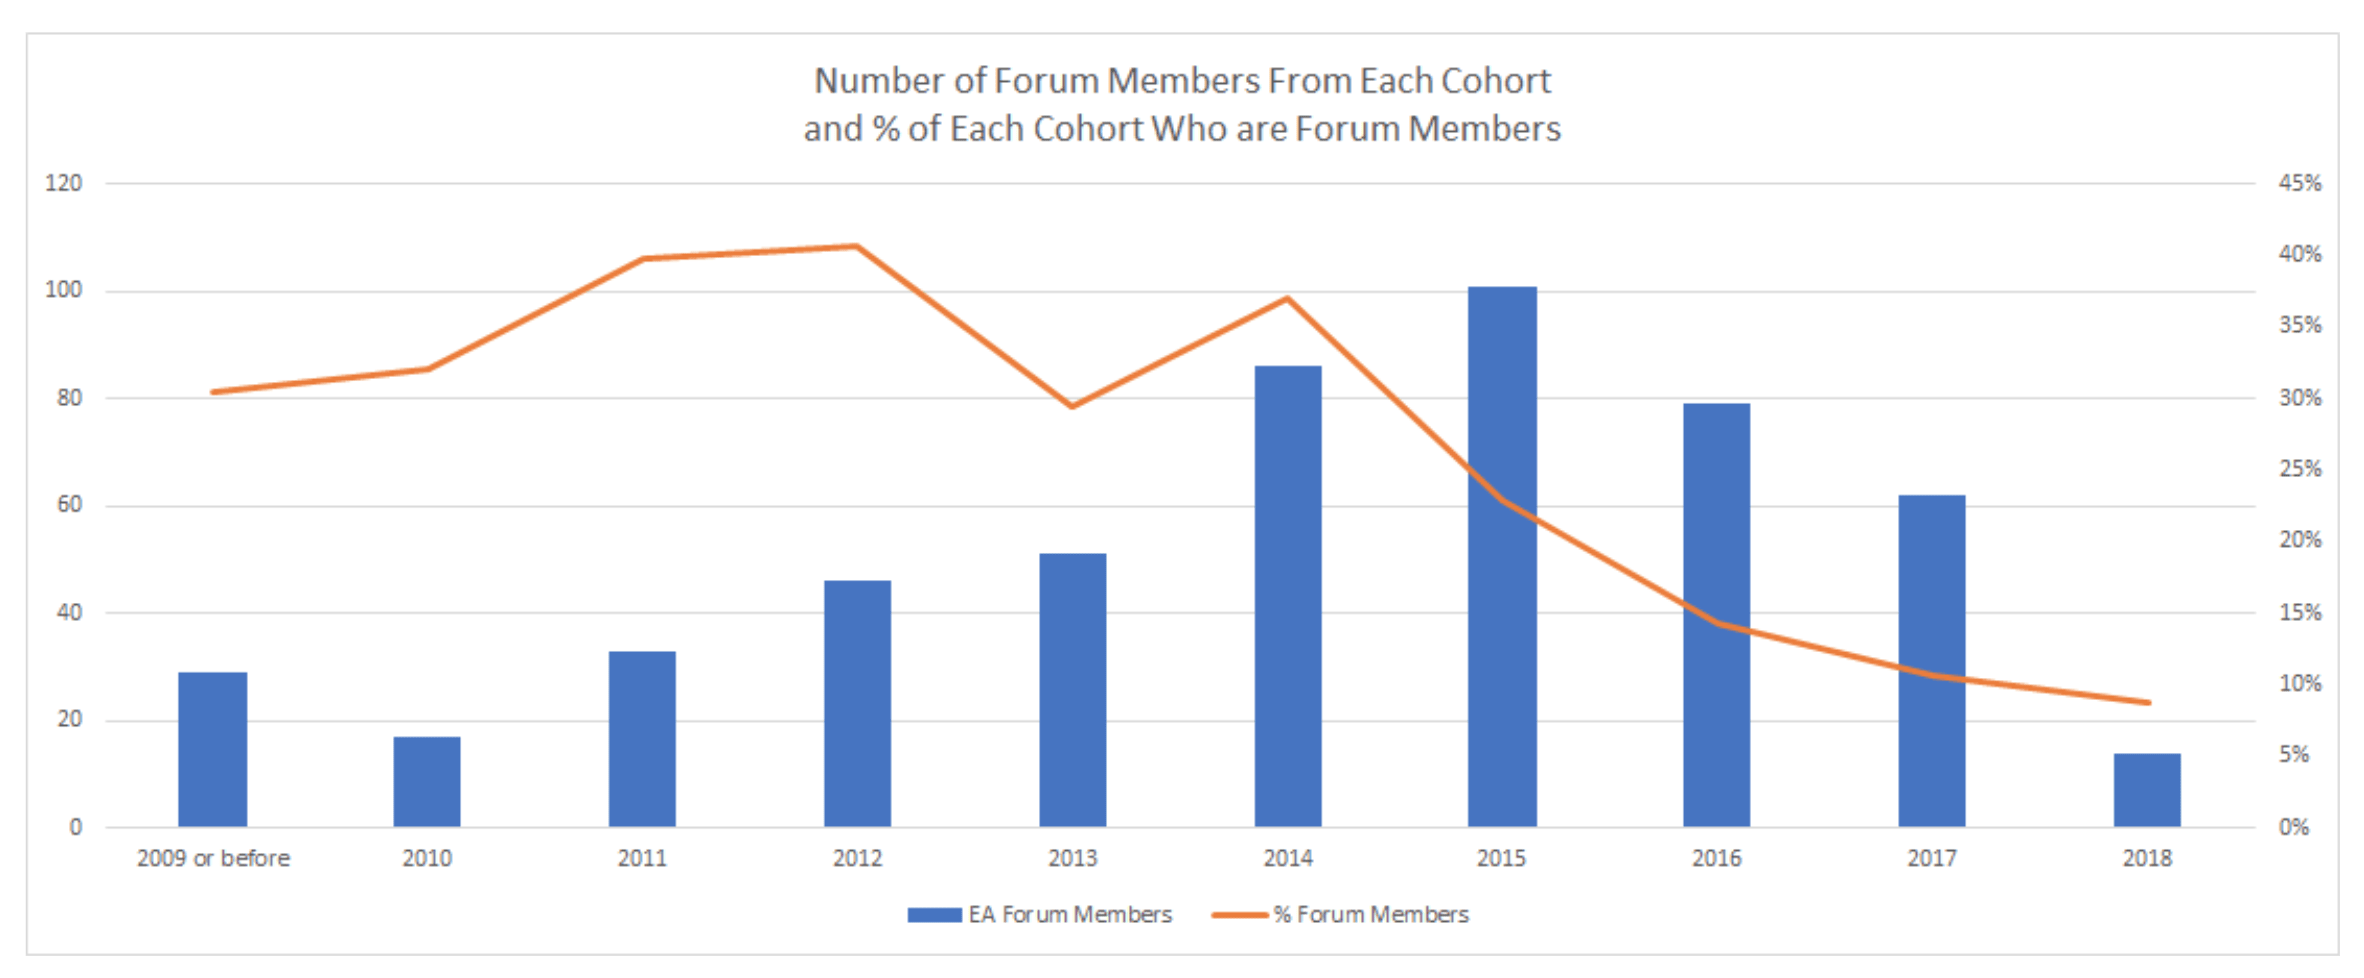
This means that comparing the percentages of more involved EAs who first heard EA from different sources will likely be misleading, due to penalising routes which have disproportionately recruited EAs more recently. That said, it may still serve as an indicator of the effect of different groups’ recruitment on the composition of EA so far.
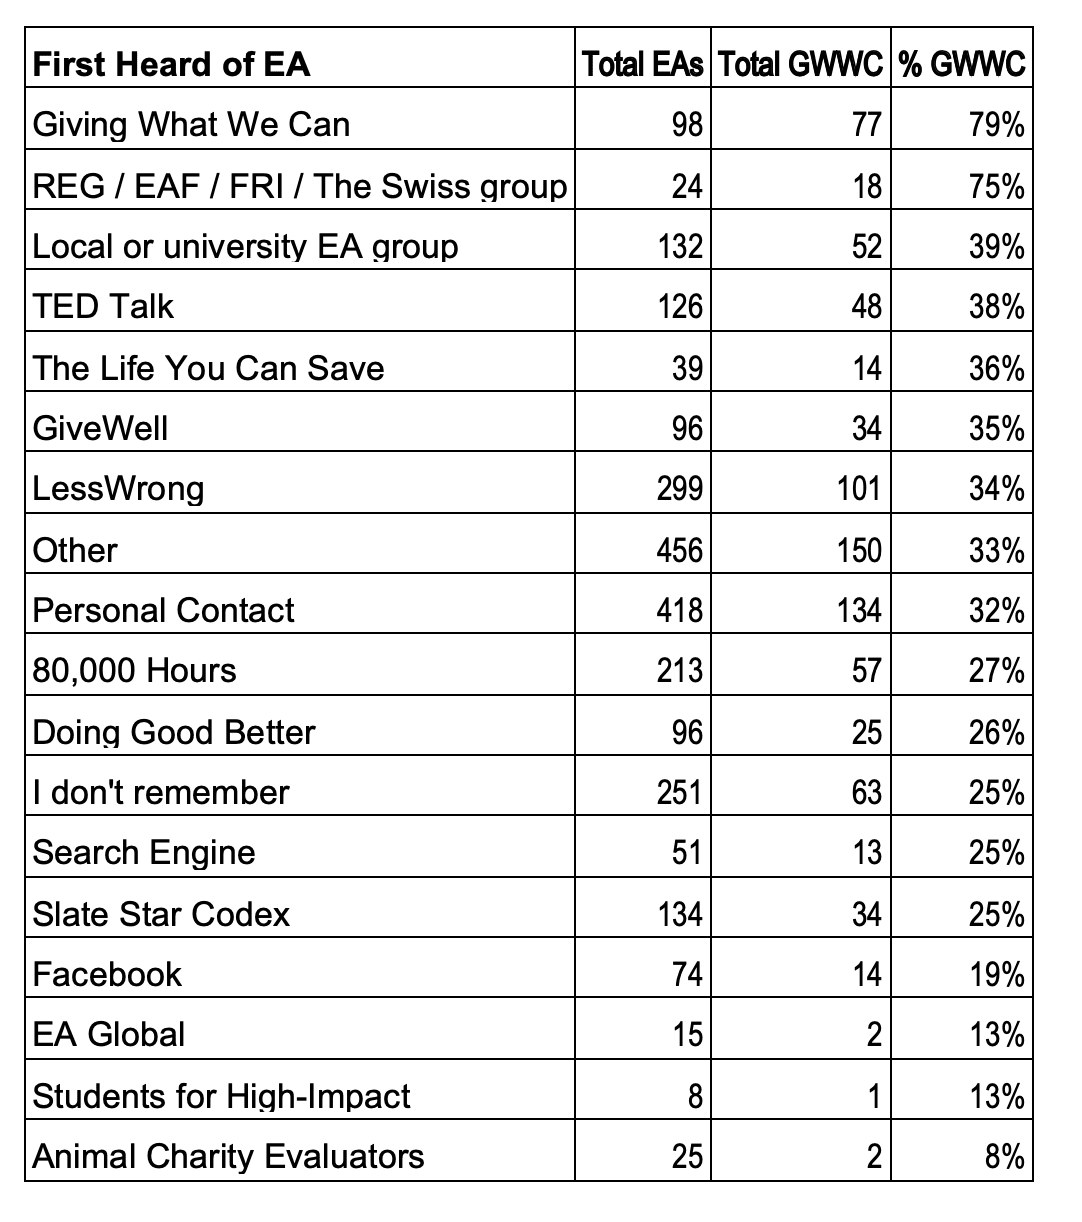
Sure enough, a smaller percentage of EAs first heard of EA from 80,000 Hours, when looking at Forum members, rather than looking at the rest of the sample. The same holds for those hearing about it from SlateStarCodex. Forum members were disproportionately more likely to have heard about EA from LessWrong, by contrast (note that more people first heard about EA via LessWrong in earlier years as well).
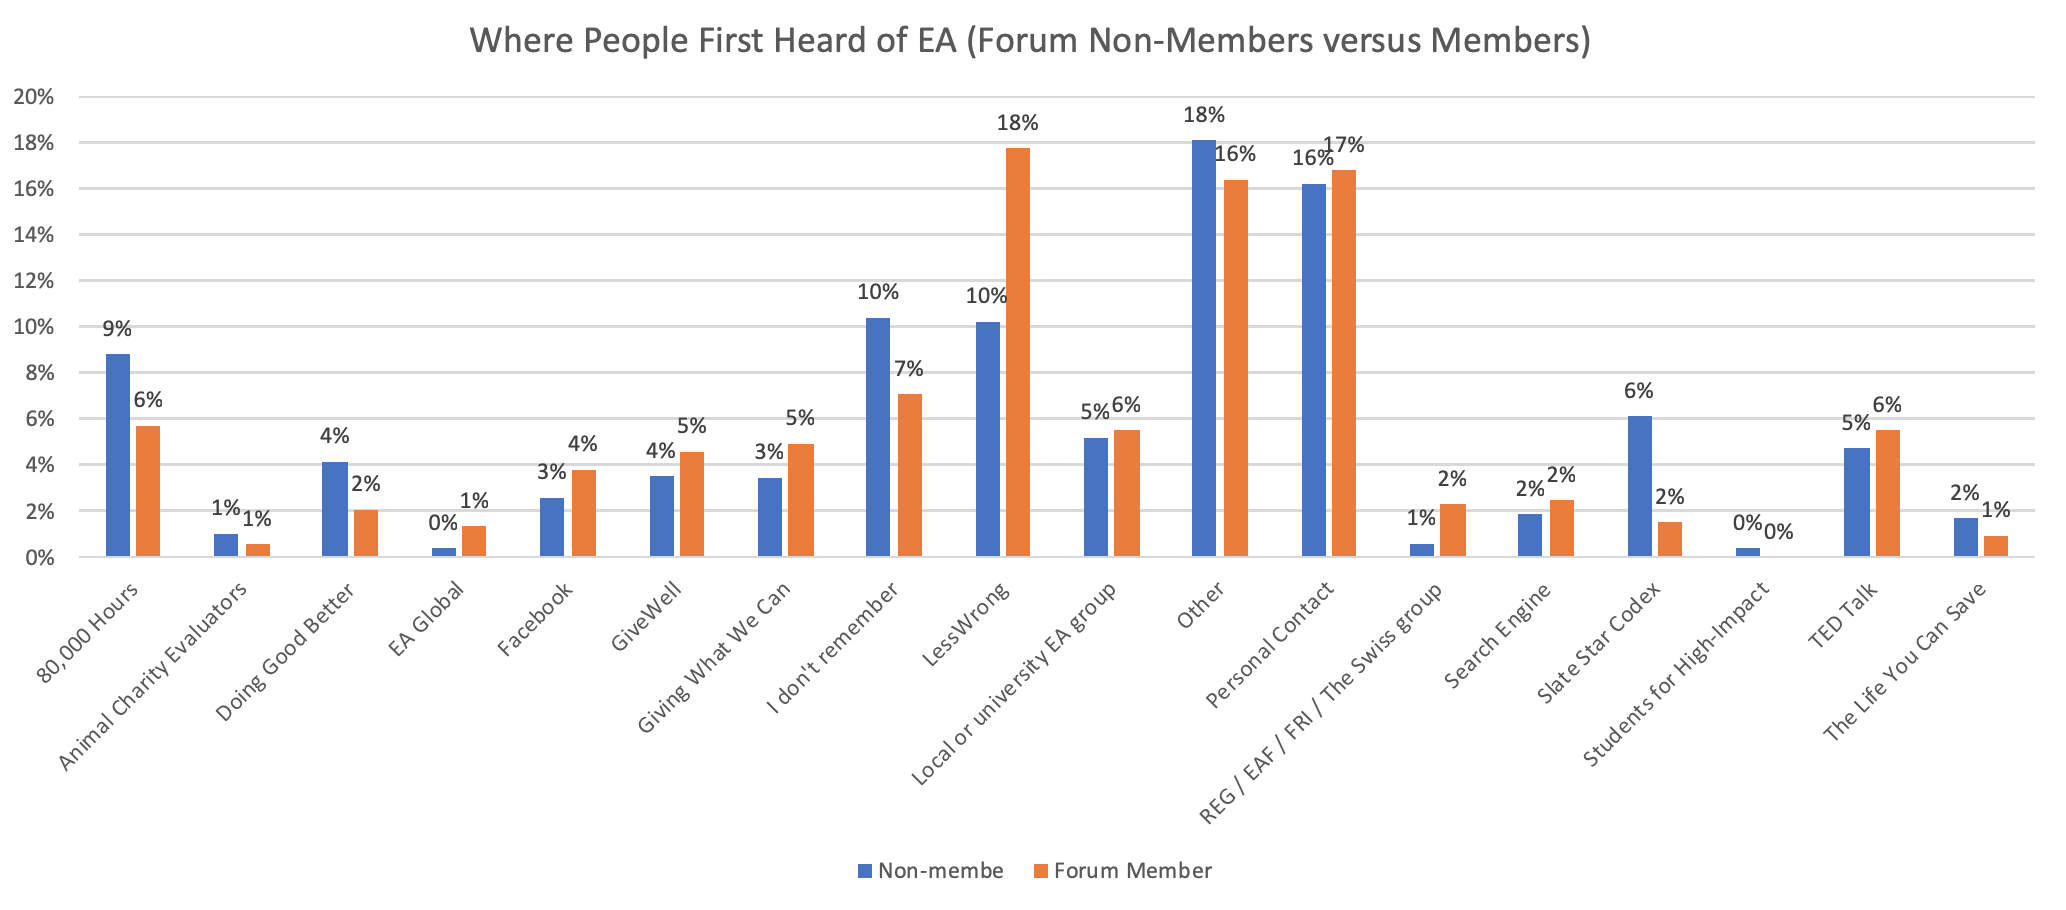
For the most part, the raw percentage point differences between the other categories are quite small (though they may reflect large differences in the proportion of people from different sources who join the Forum as shown in the table below) as are the total numbers of EAs (and Forum members) coming from many of these different sources.
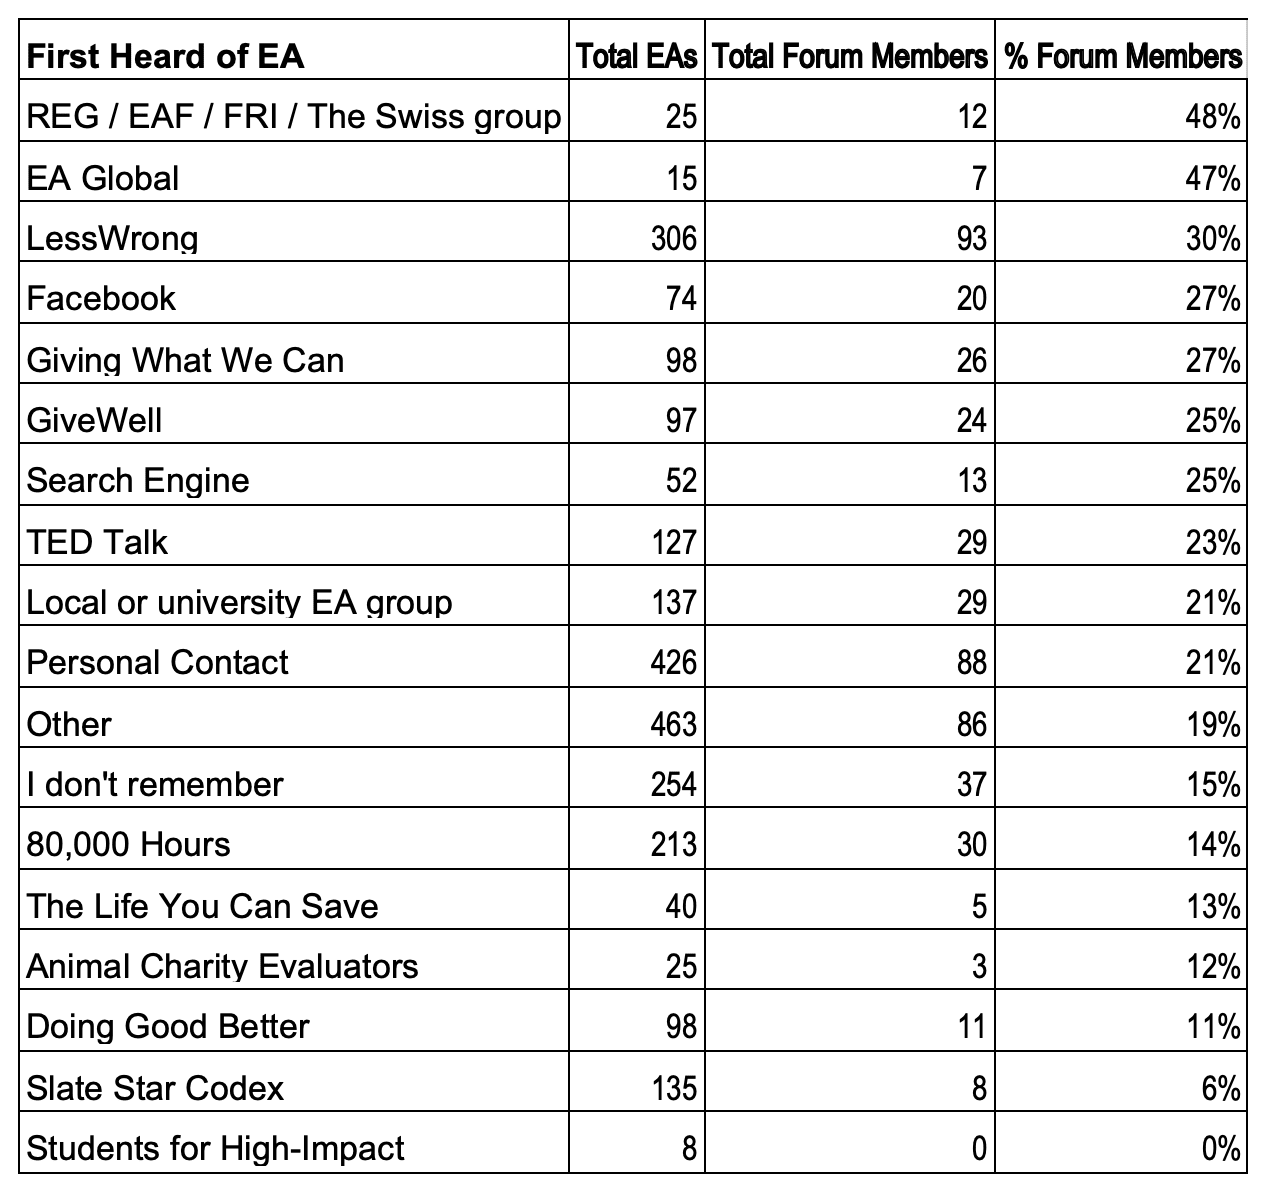
It is important to interpret the differences in the proportions of people from different sources becoming Forum members in the context of the absolute number of Forum members coming from each source. For example, while a much higher percentage of people who first hear about EA from EA Global are members of the Forum, than other sources (such as 80,000 Hours and Personal Contact), the total number of Forum members coming from these other sources is much higher. That said, if you were to take the percentage of EAs recruited from a given source who are involved as a potential indicator of the quality of the recruitment from that source, then you might care more about groups recruiting a higher percentages of involved members, rather than recruiting higher total numbers of both more and less involved EAs. It is also important to note that in principle, high proportions of involved members could potentially be produced by a certain route into EA being very bad at engaging members (for example, if a group caused dropout in all but its most engaged recruits, then survivorship bias might leave a very small, but exclusively highly engaged group taking the survey). We would caution against putting too much weight on these percentages as a means to compare different routes into EA in this way, due to the small numbers involved in many of these categories and potential confounds mentioned above. The difficulty of identifying patterns of clear differences across different routes into EA and different years can be discerned by viewing the following crosstab, which shows the totals and percentages of EA Forum users from each source, within each year.
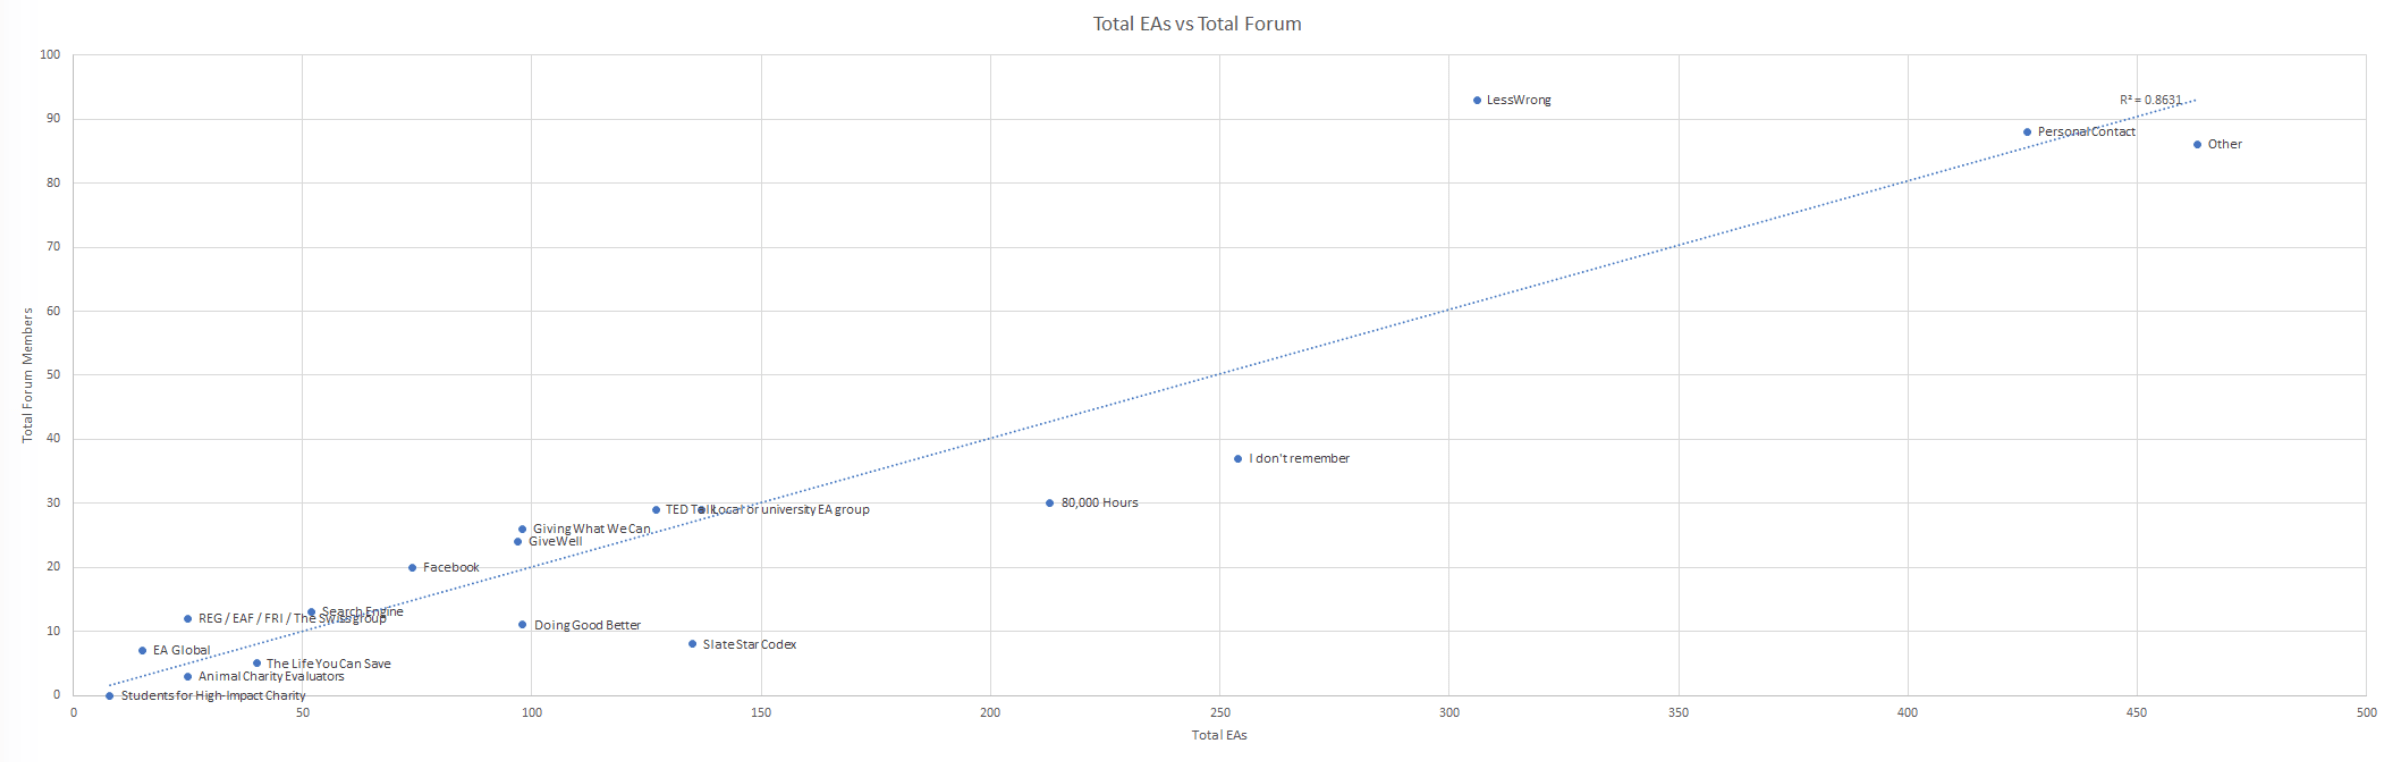
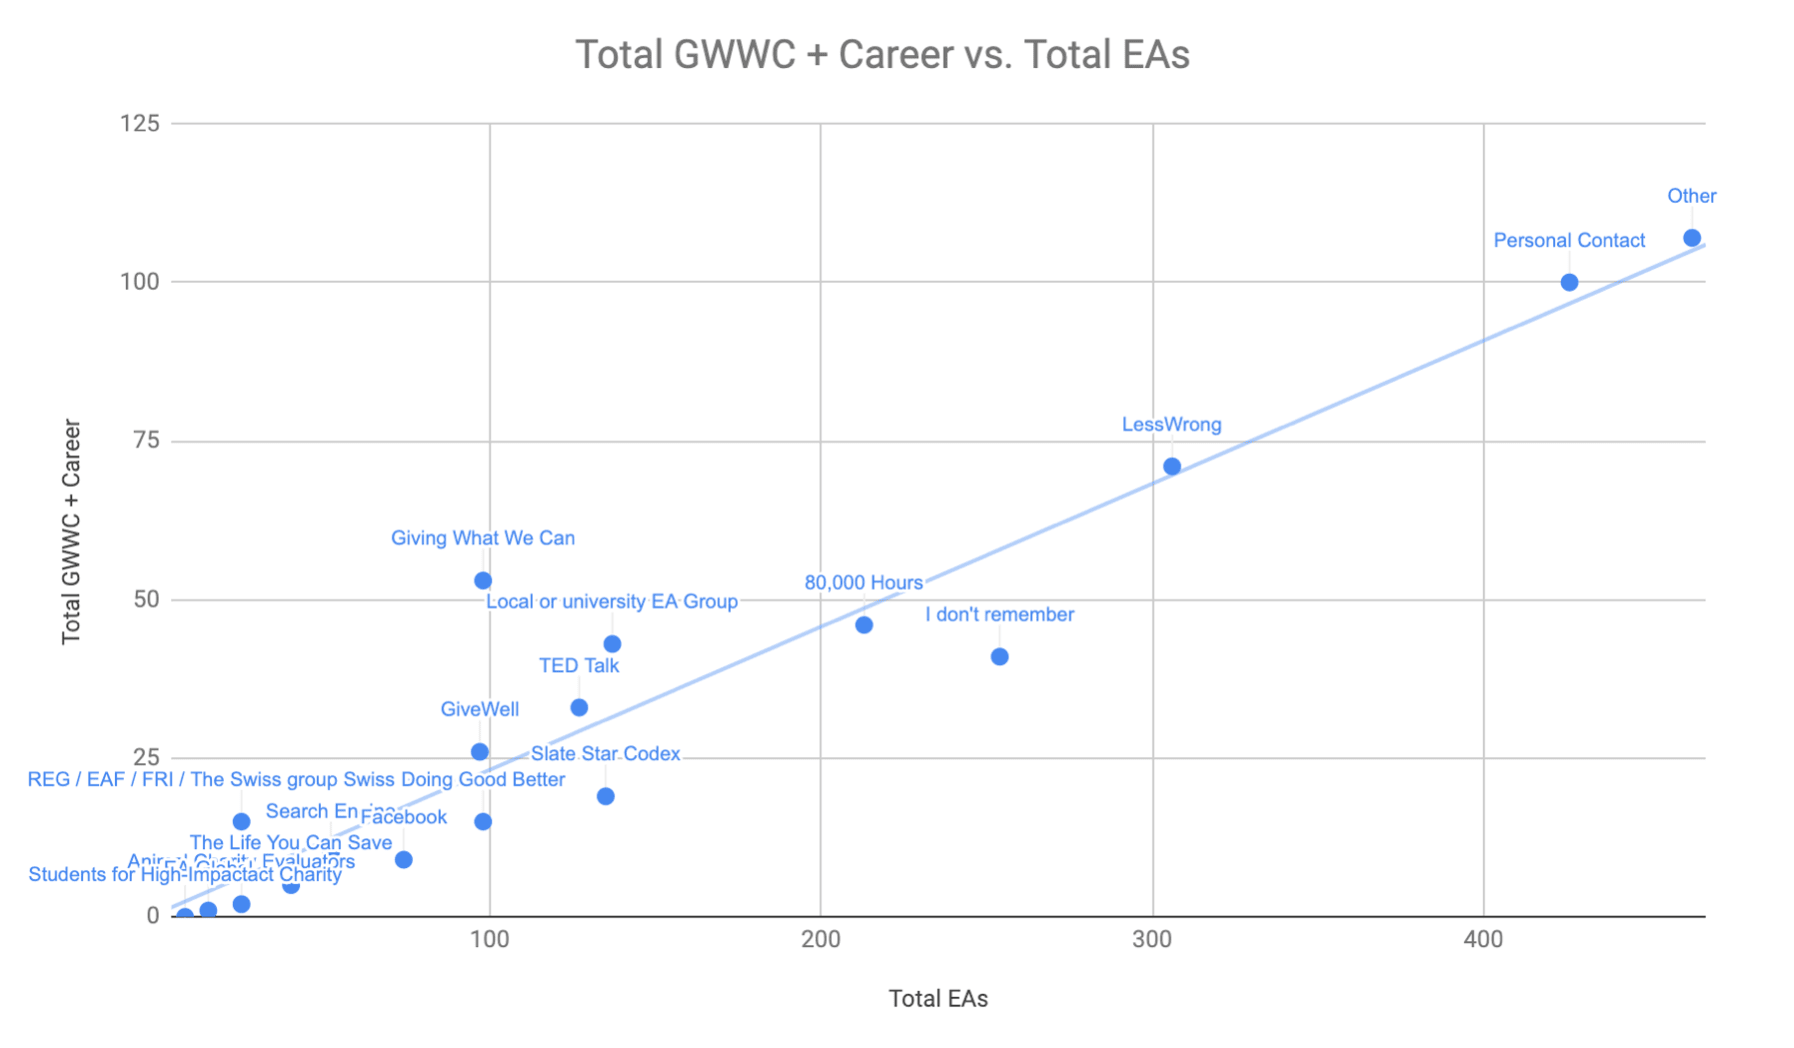
Moreover, when we examine the correlation between the number of EAs, in total, recruited from different sources and the number of Forum users recruited from each source, we find this to be very highly correlated (r=.929), suggesting much of the variance in total Forum users recruited is explained simply by different sources recruiting more total EAs. One can see in the scatter plot below the small number of sources which are above or below the line, suggesting a disproportionately high or low number of Forum members recruited relative to total EAs recruited.
We attempted to model predictors of EA Forum membership in a way which could account for where EAs first heard about EA being confounded by other influences on EA Forum membership by creating a random forest model and subsequently running a logistic regression. Neither of these models were informative. Examination of the confusion matrices indicated that neither model was better than random for predicting the minority class of being an EA forum member from factors such as first heard EA, involvement or membership in other groups. Neither upsampling nor use of synthetic data improved the predictions.
GWWC Pledge and Career Changes
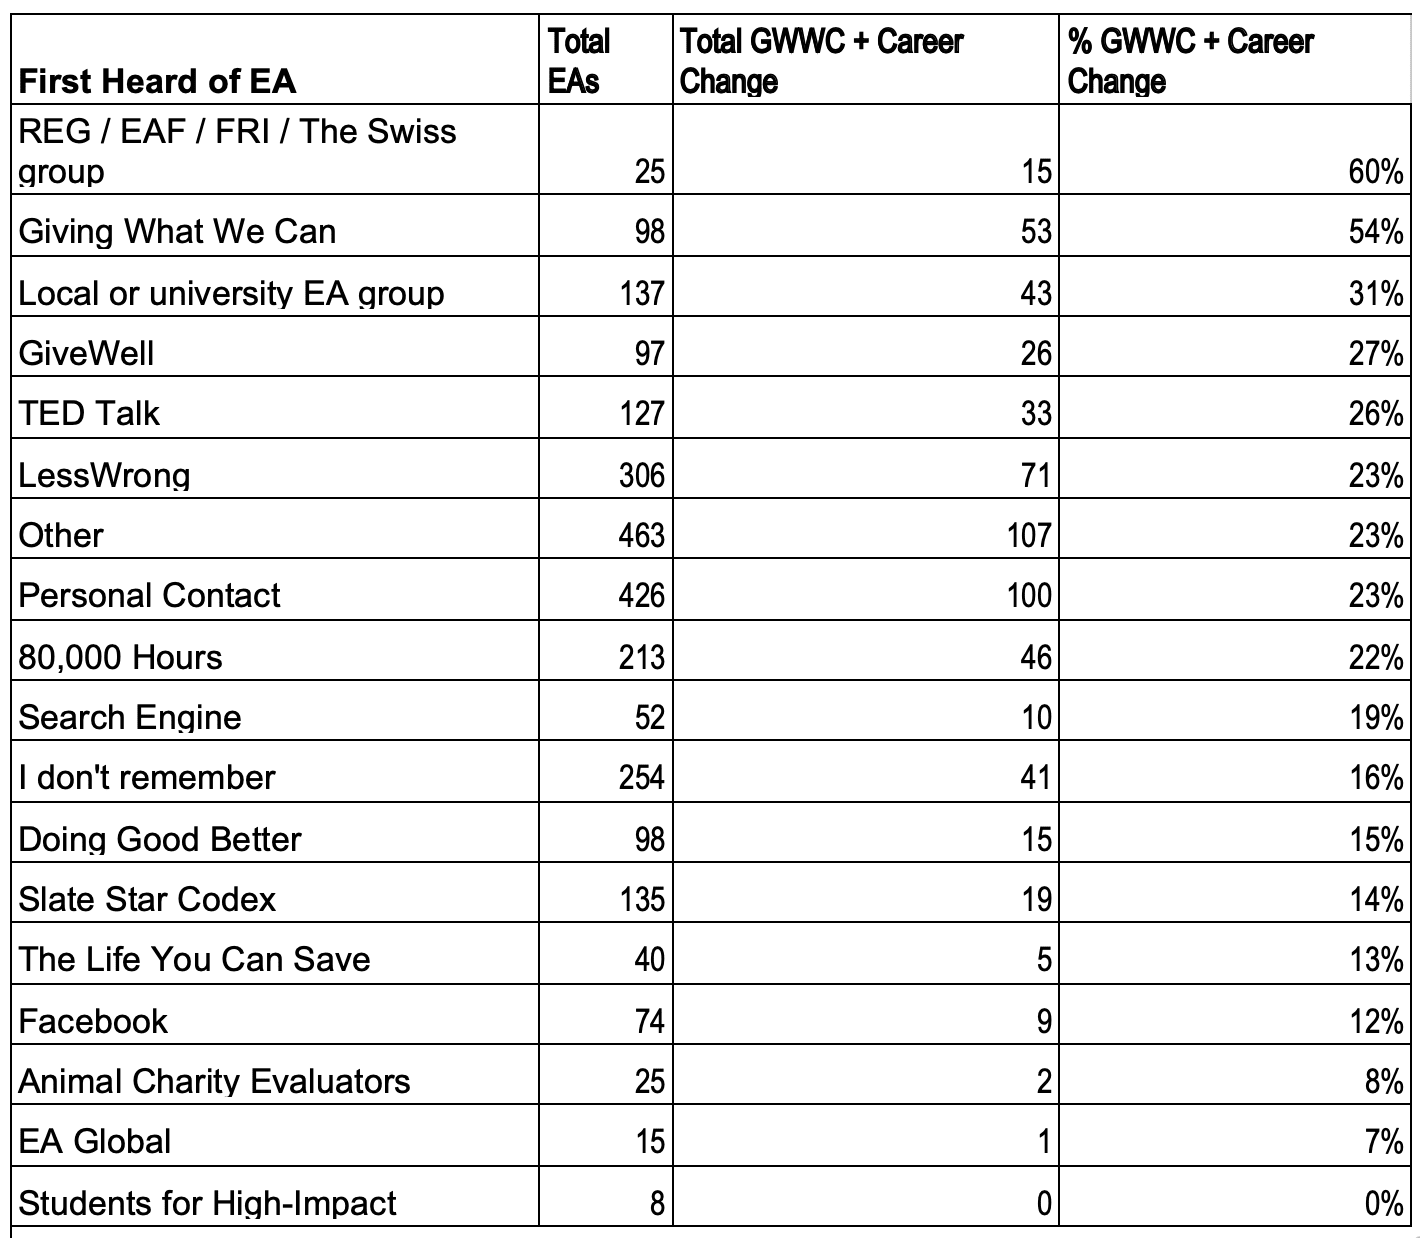
As with EA Forum membership above, we examine the raw percentages of people in our taking the GWWC Pledge, making a career change or both who hear about EA from different sources. For the most part, the results do not differ substantially from those above for Forum membership. As with EA Forum members, you can also view the cross-tabs showing the total EAs, total GWWC pledging/career changing/both pledging and career changing, and % pledging/career changing/both pledging and career changing EAs, within each year from each source of people first hearing about EA.
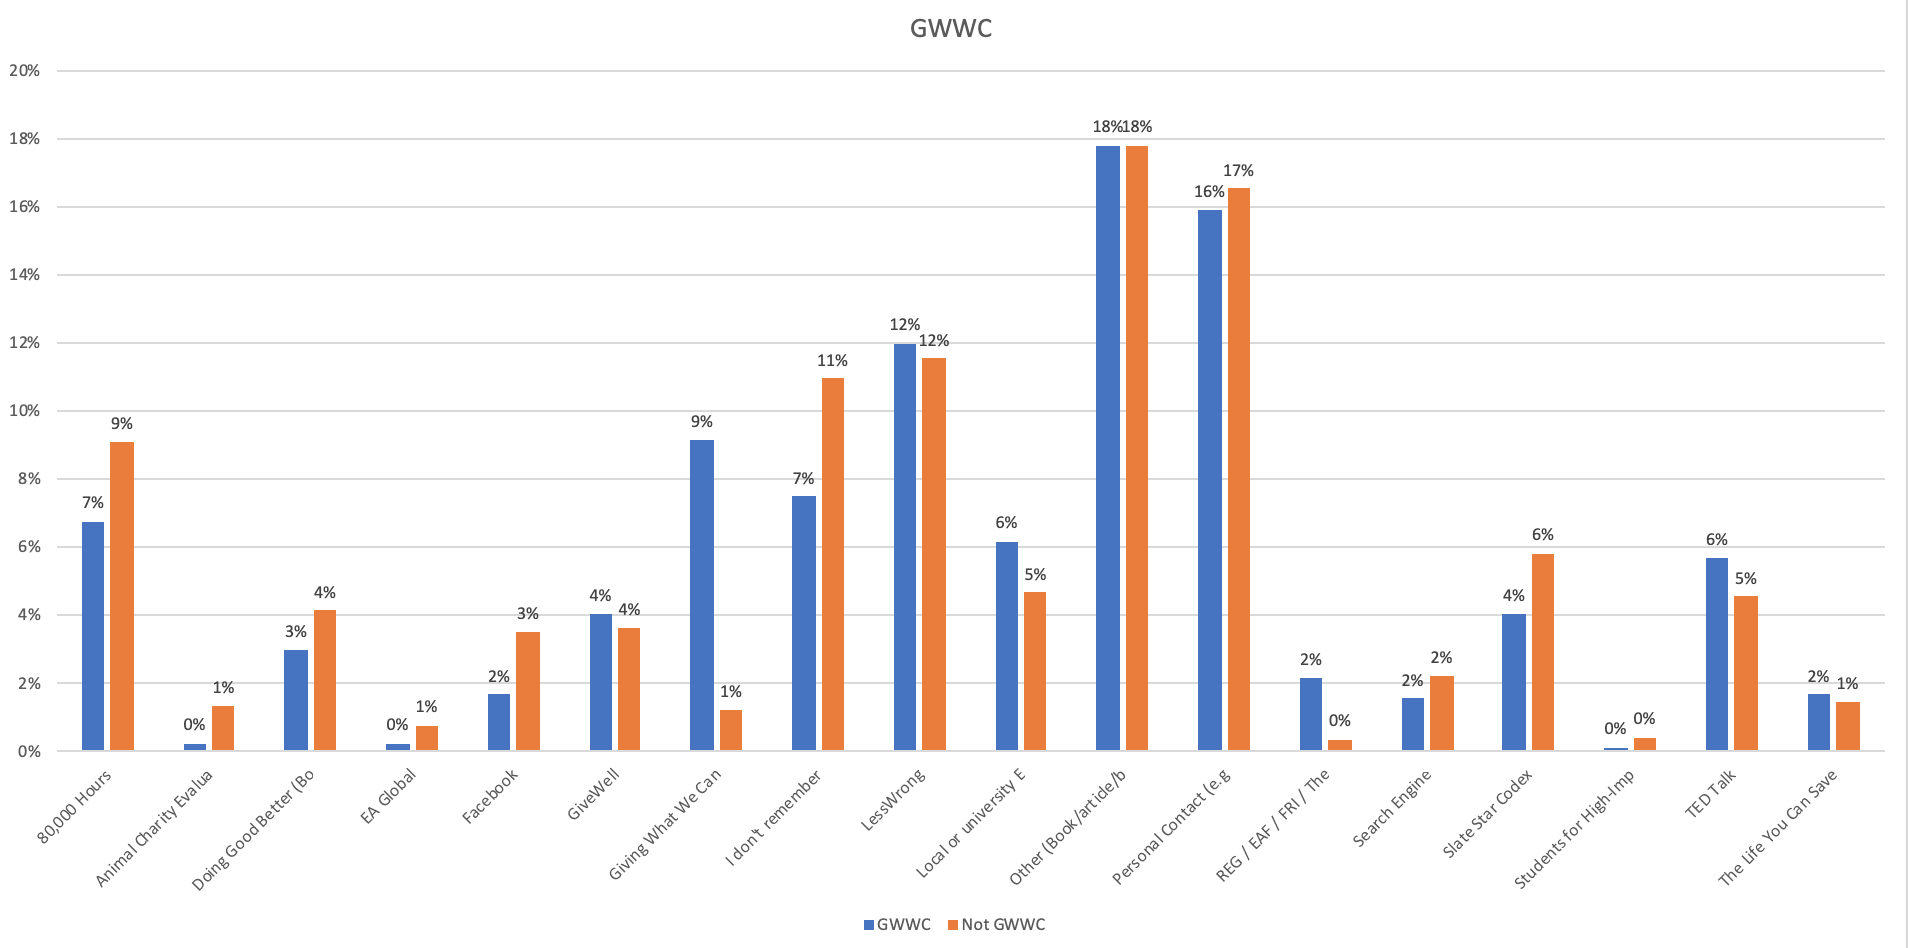
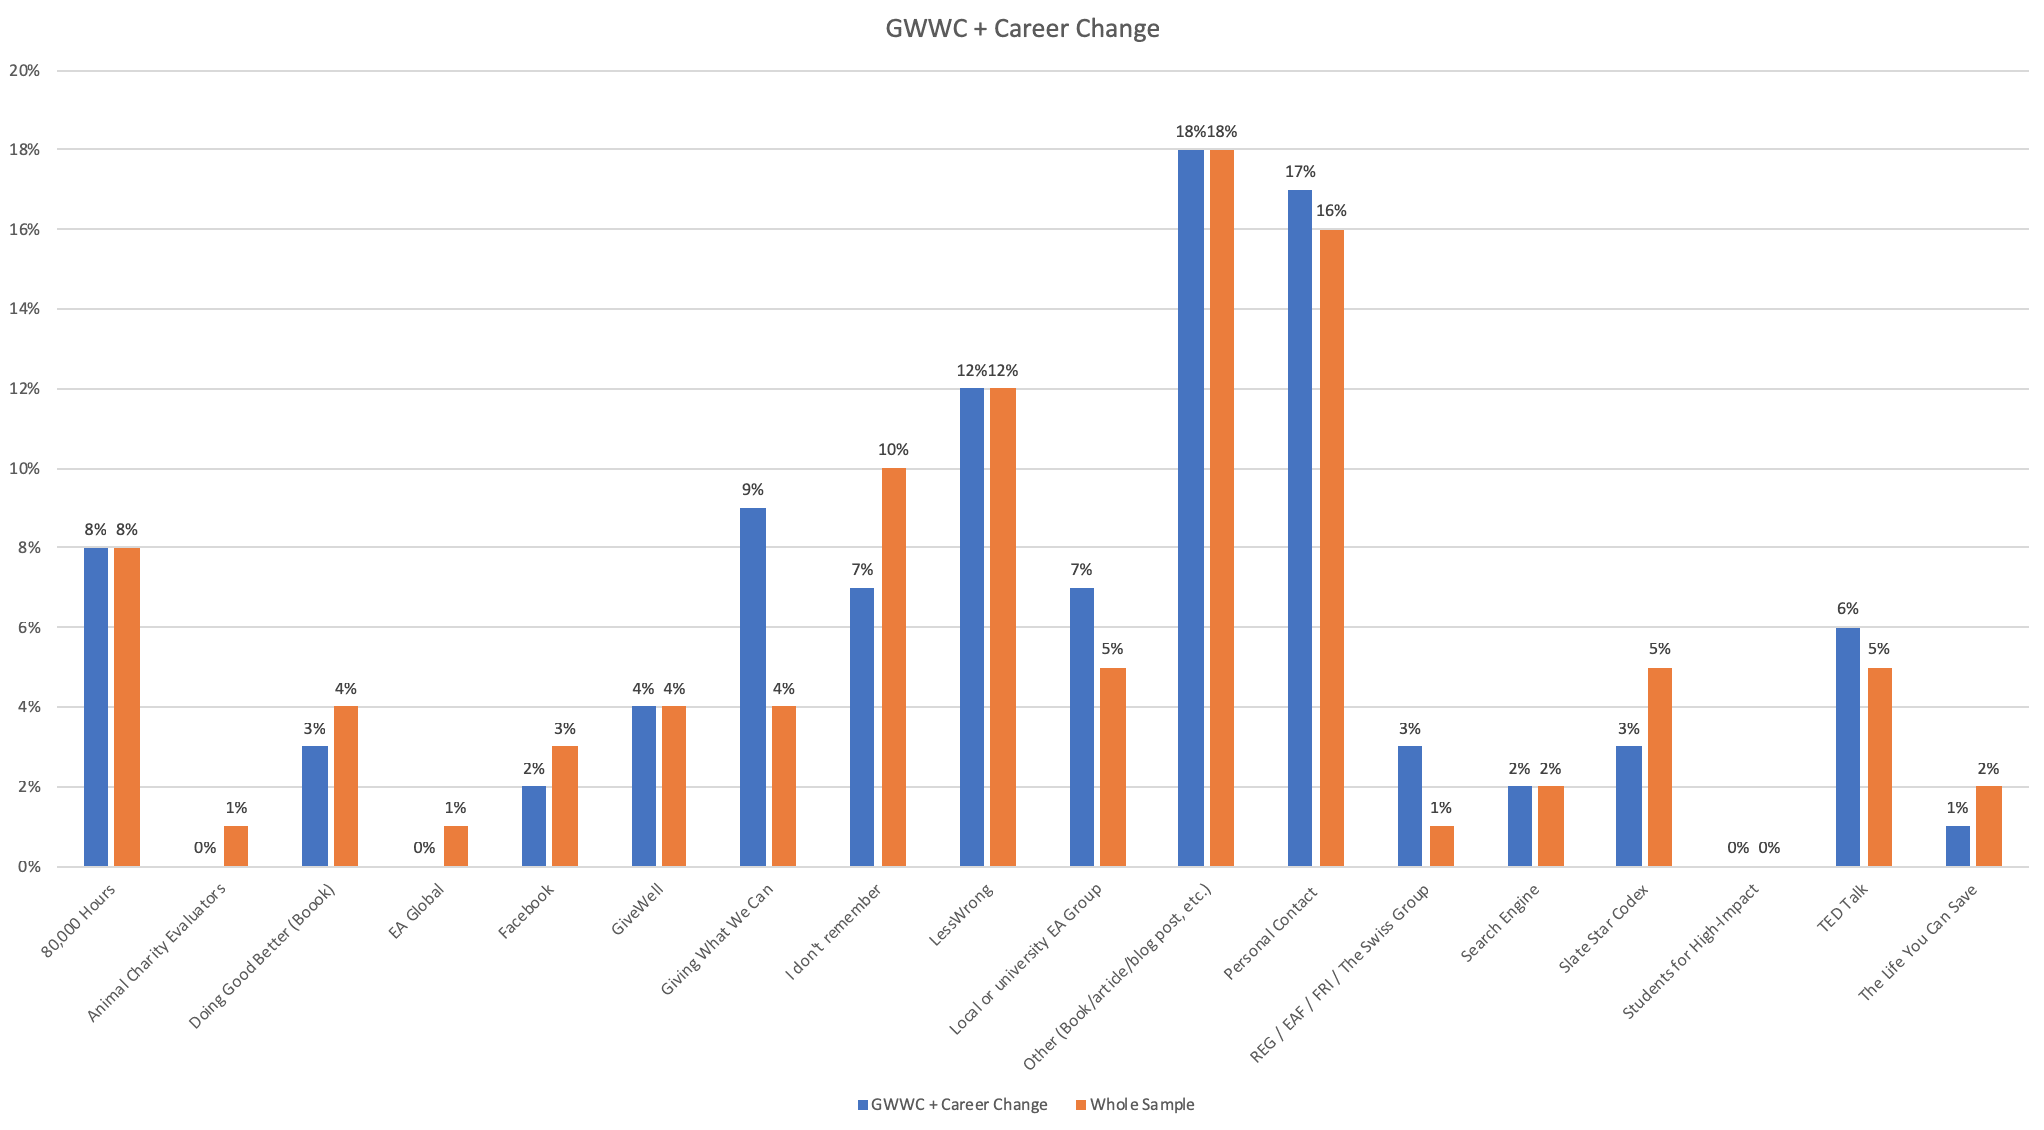
Running the same analyses as for EA Forum membership above, we find again that a disproportionately small number of GWWC pledgers first heard of EA from 80,000 Hours, but a very disproportionately large number report first hearing about EA from GWWC.
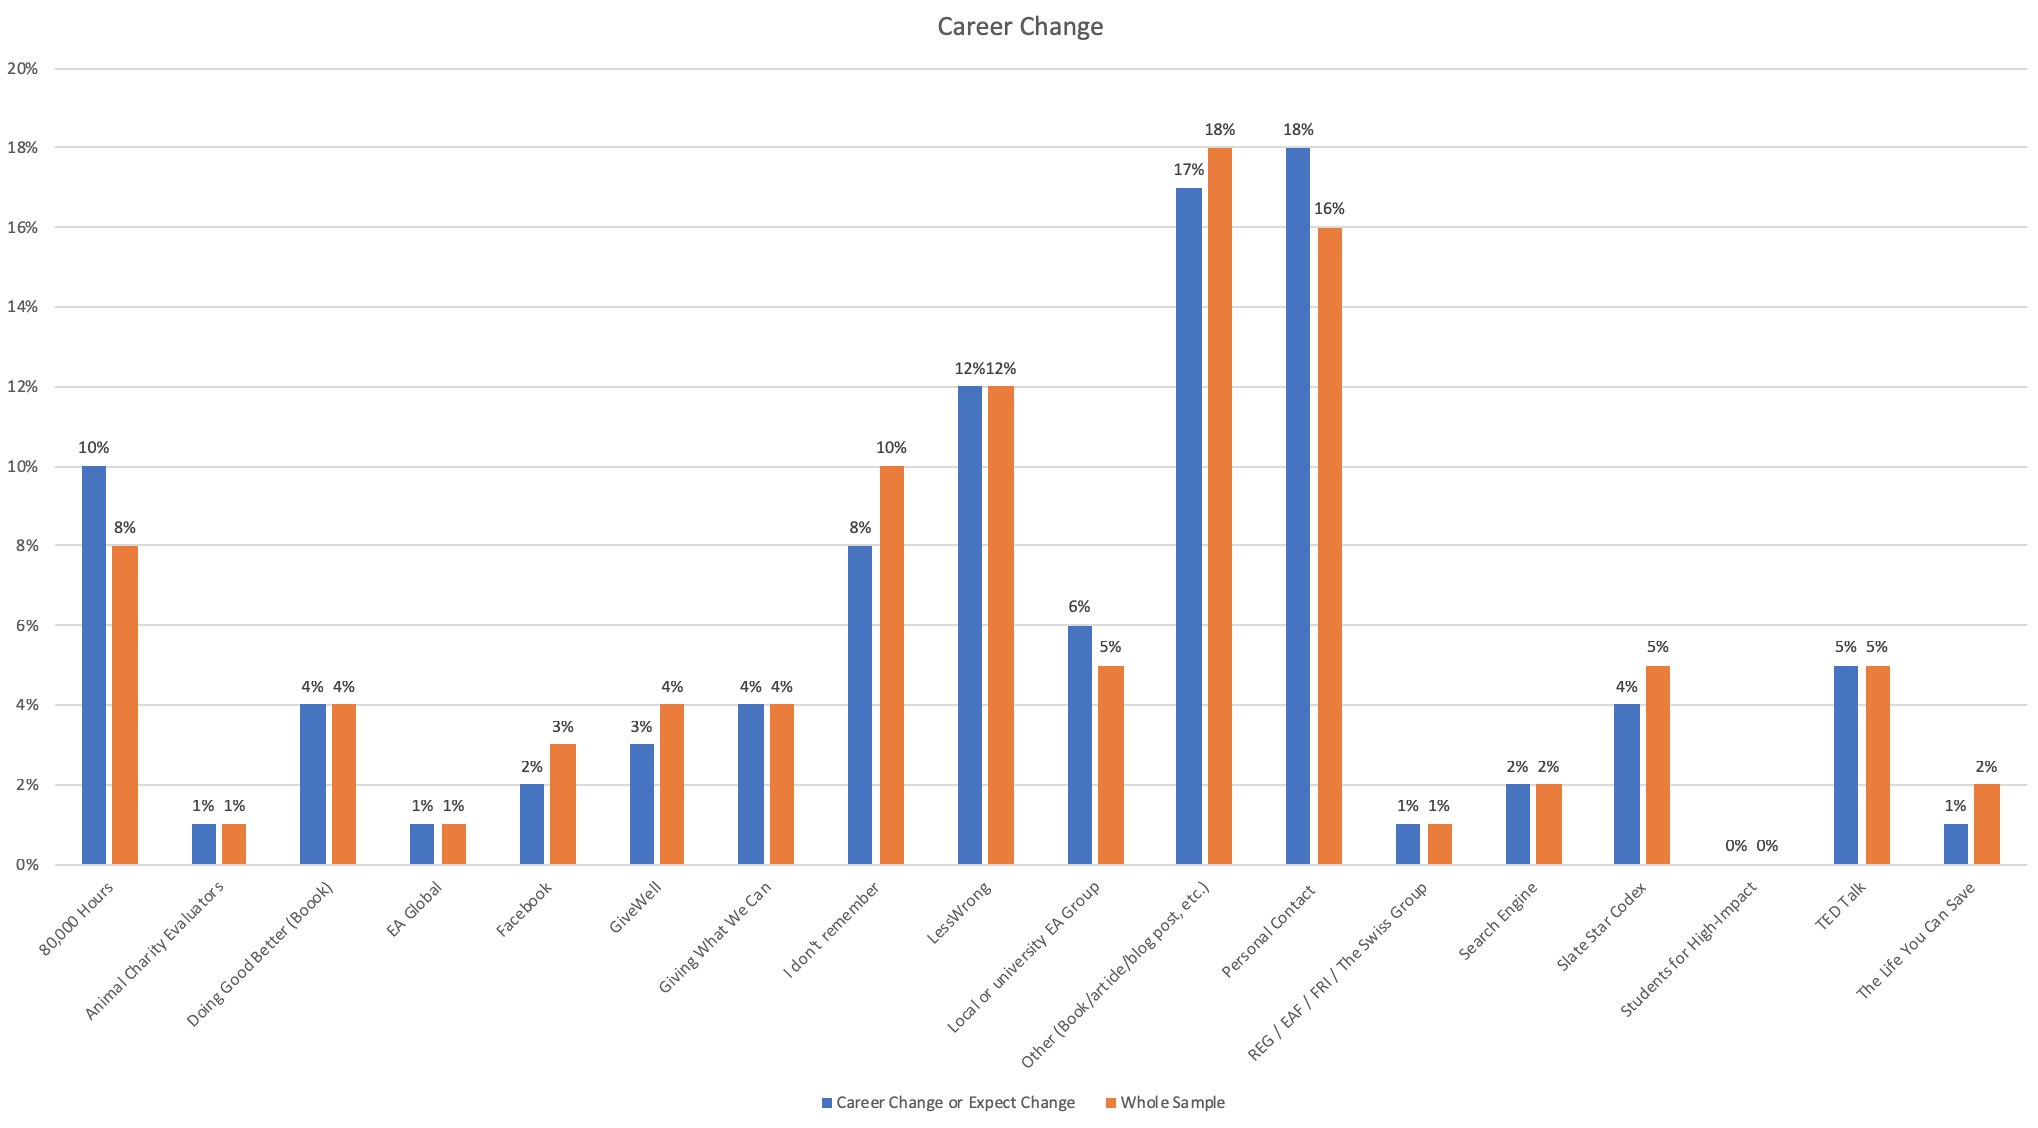
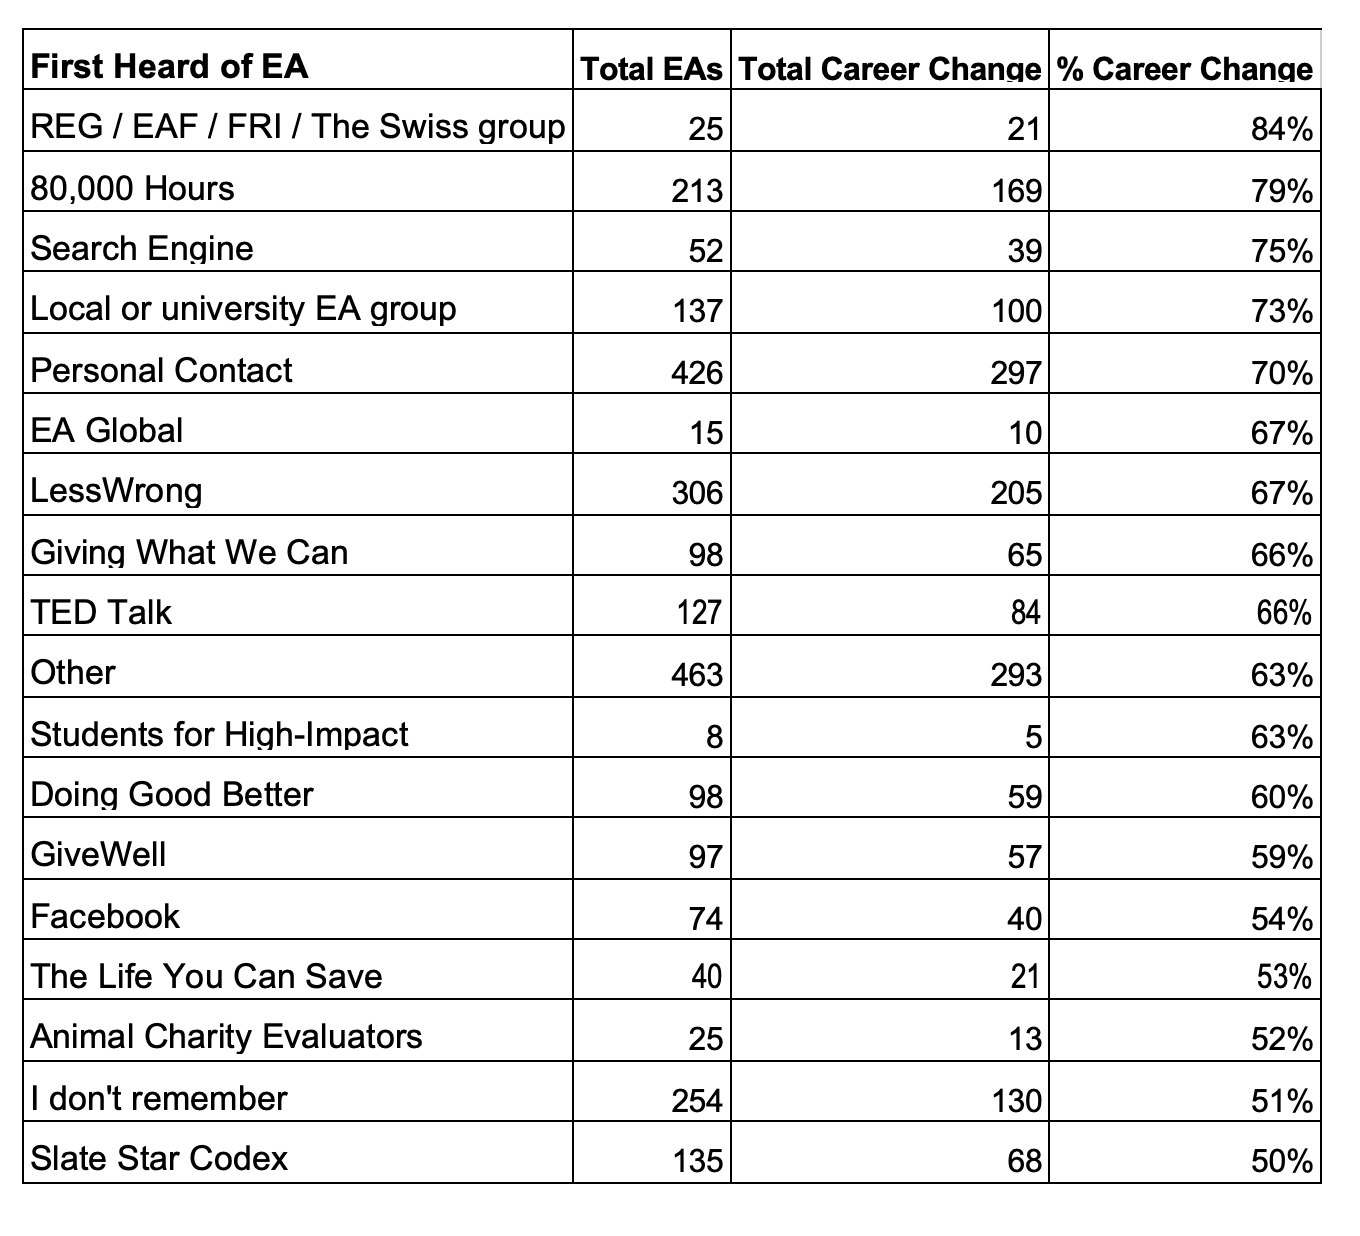
In general, there are very small raw percentage differences between career change and non-career change groups, across each route into EA. As the table below shows, moreover, more than 50% of EAs hearing about EA from each source either have changed their career plans as a result of EA or expect to. Of note, though, 80,000 Hours now seems to be over-represented, rather than under-represented, among EAs who have or expect to make career changes.
As with total number of Forum members, the total numbers of EAs taking the GWWC Pledge (r=0.970 (p<0.01)), making (or expecting) a career change (r=0.9888 (p<0.01)) or both (r=0.9501 (p<0.01), were highly correlated with the total numbers of EAs being recruited from each source.
We also ran an ordinal regression on combined GWWC-career changes. GWWC and either an actual or expected career change were each coded as 1, giving each respondent a combined score of 0-2 (with 2 representing an EA who both took the GWWC Pledge and either changed or expected to change career). Backwards elimination using AIC produced a final model with AIC = 4103 and residual deviance of 4021. This compared favourably to a full model with AIC = 4160 and residual deviance of 3988 which included all factors of involvement, membership, studies, employment, country, politics and education. After stepwise selection we found the following significant marginal effects on level 2.
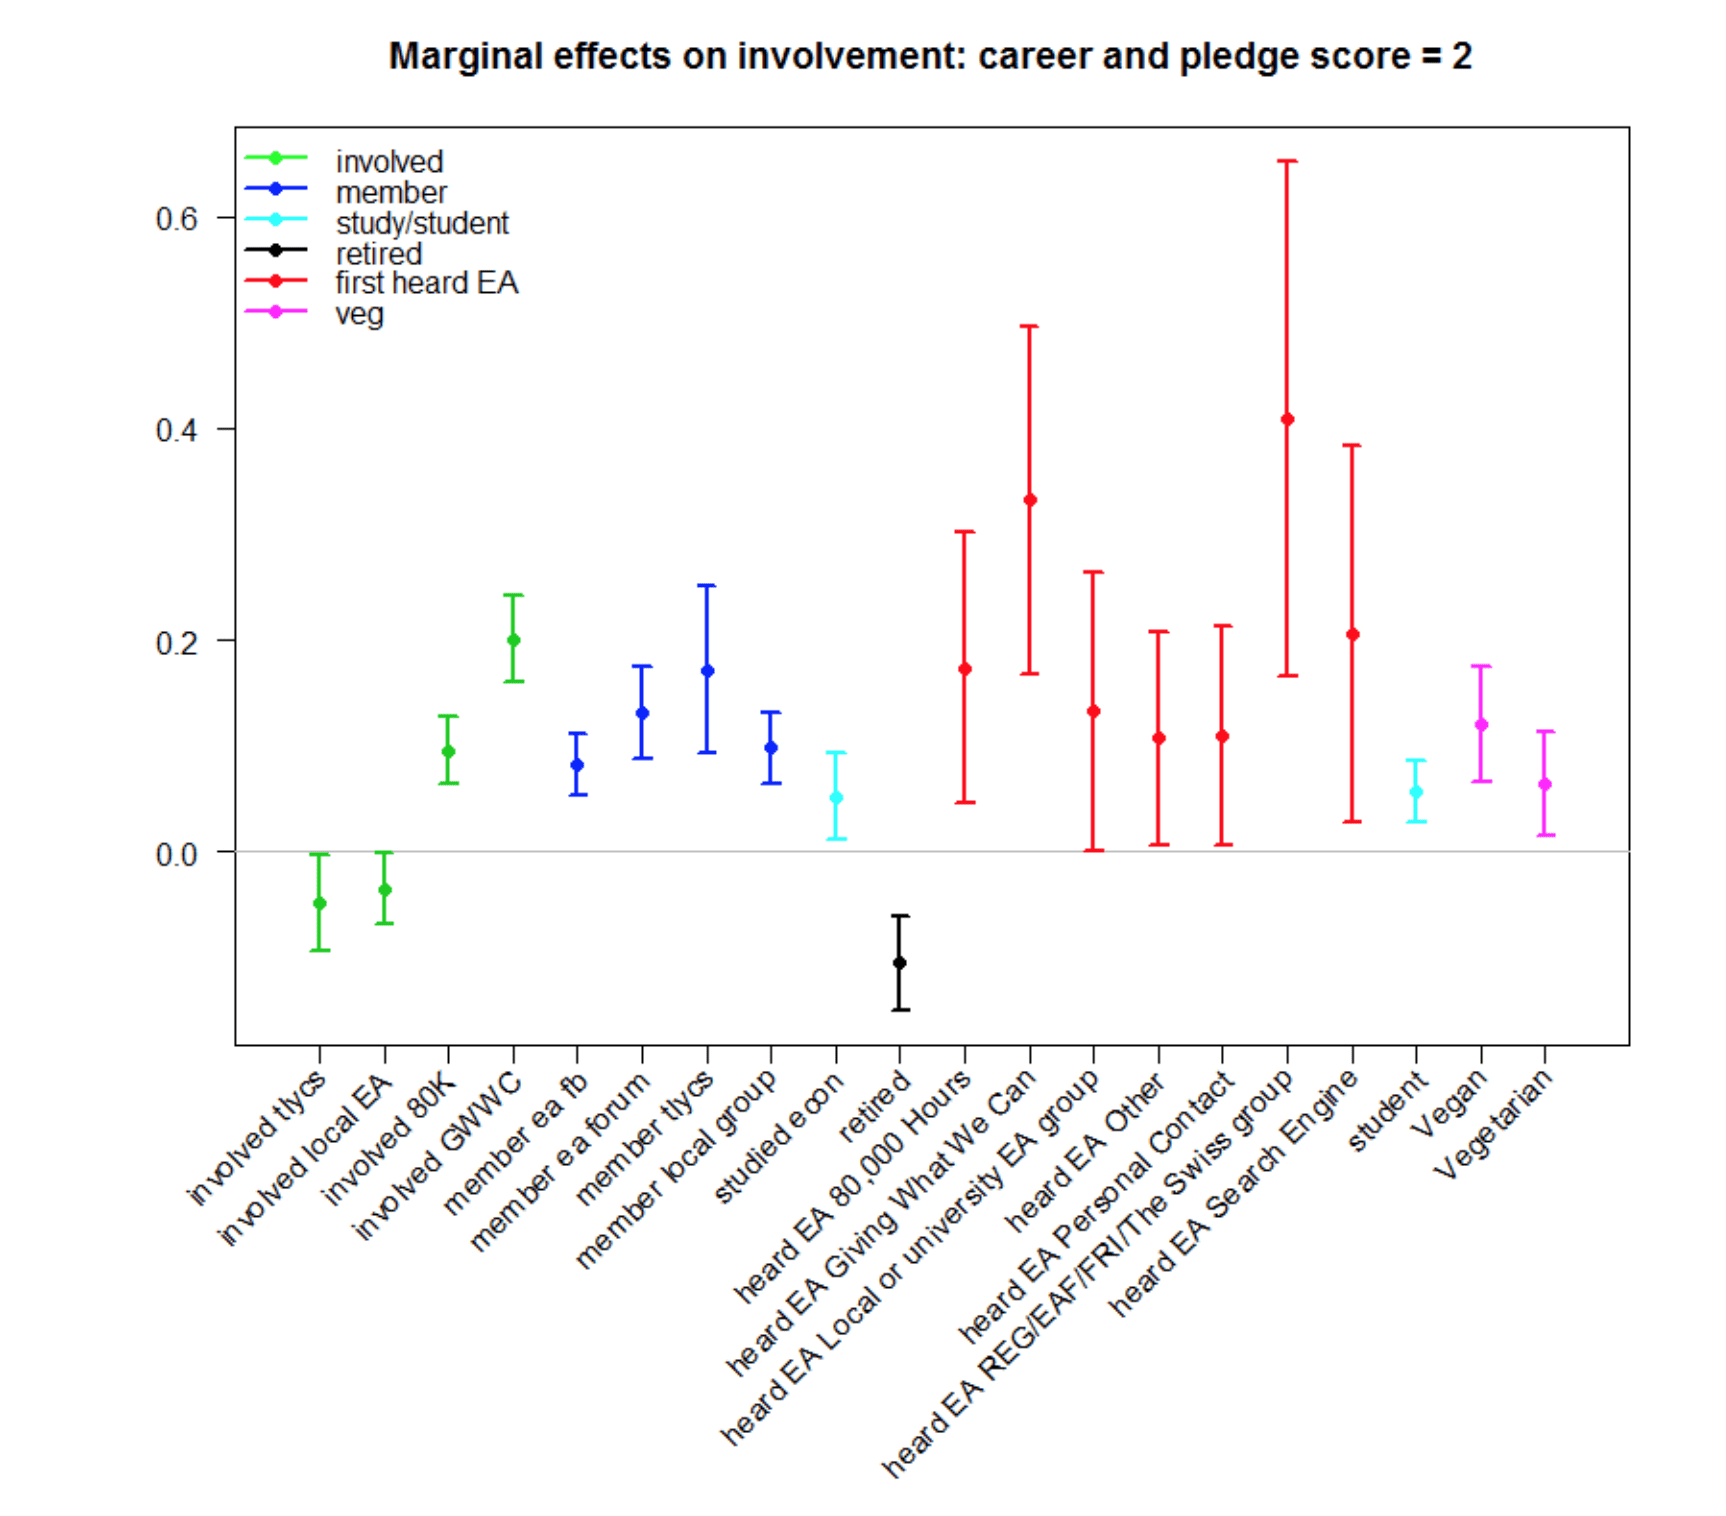
Among “where first heard of EA” options (compared to a base category of first hearing about EA via Facebook) the largest positive effect was for hearing about EA from EAF/FRI/REG etc. This was followed by hearing about EA from GWWC, 80,000 Hours, a search engine, a local group, Personal Contact or Other.
Reporting getting more involved in EA through 80,000 Hours or GWWC were both associated with making a career change or taking the Pledge. This should not be too surprising, since making a career change based on 80,000 Hours or taking the GWWC pledge could themselves both be considered forms of getting more involved with EA though each of these organisations.
Having taken the TLYCS pledge, and being members of EA Facebook, the EA Forum and a local EA group were each predictors of having taken the GWWC Pledge and made a career change.
Being a student was positively associated with taking the GWWC pledge and having made or expected to make a career change, whereas, unsurprisingly, being retired (and so in little position to make a career change) was negatively associated.
Studying economics specifically seemed to be a positive predictor of having both taken the GWWC pledge and made a career change. Notably, being a vegetarian and vegan (especially a vegan) were both significantly positively associated with having both taken the GWWC pledge and made a career change.
Other measures of involvement
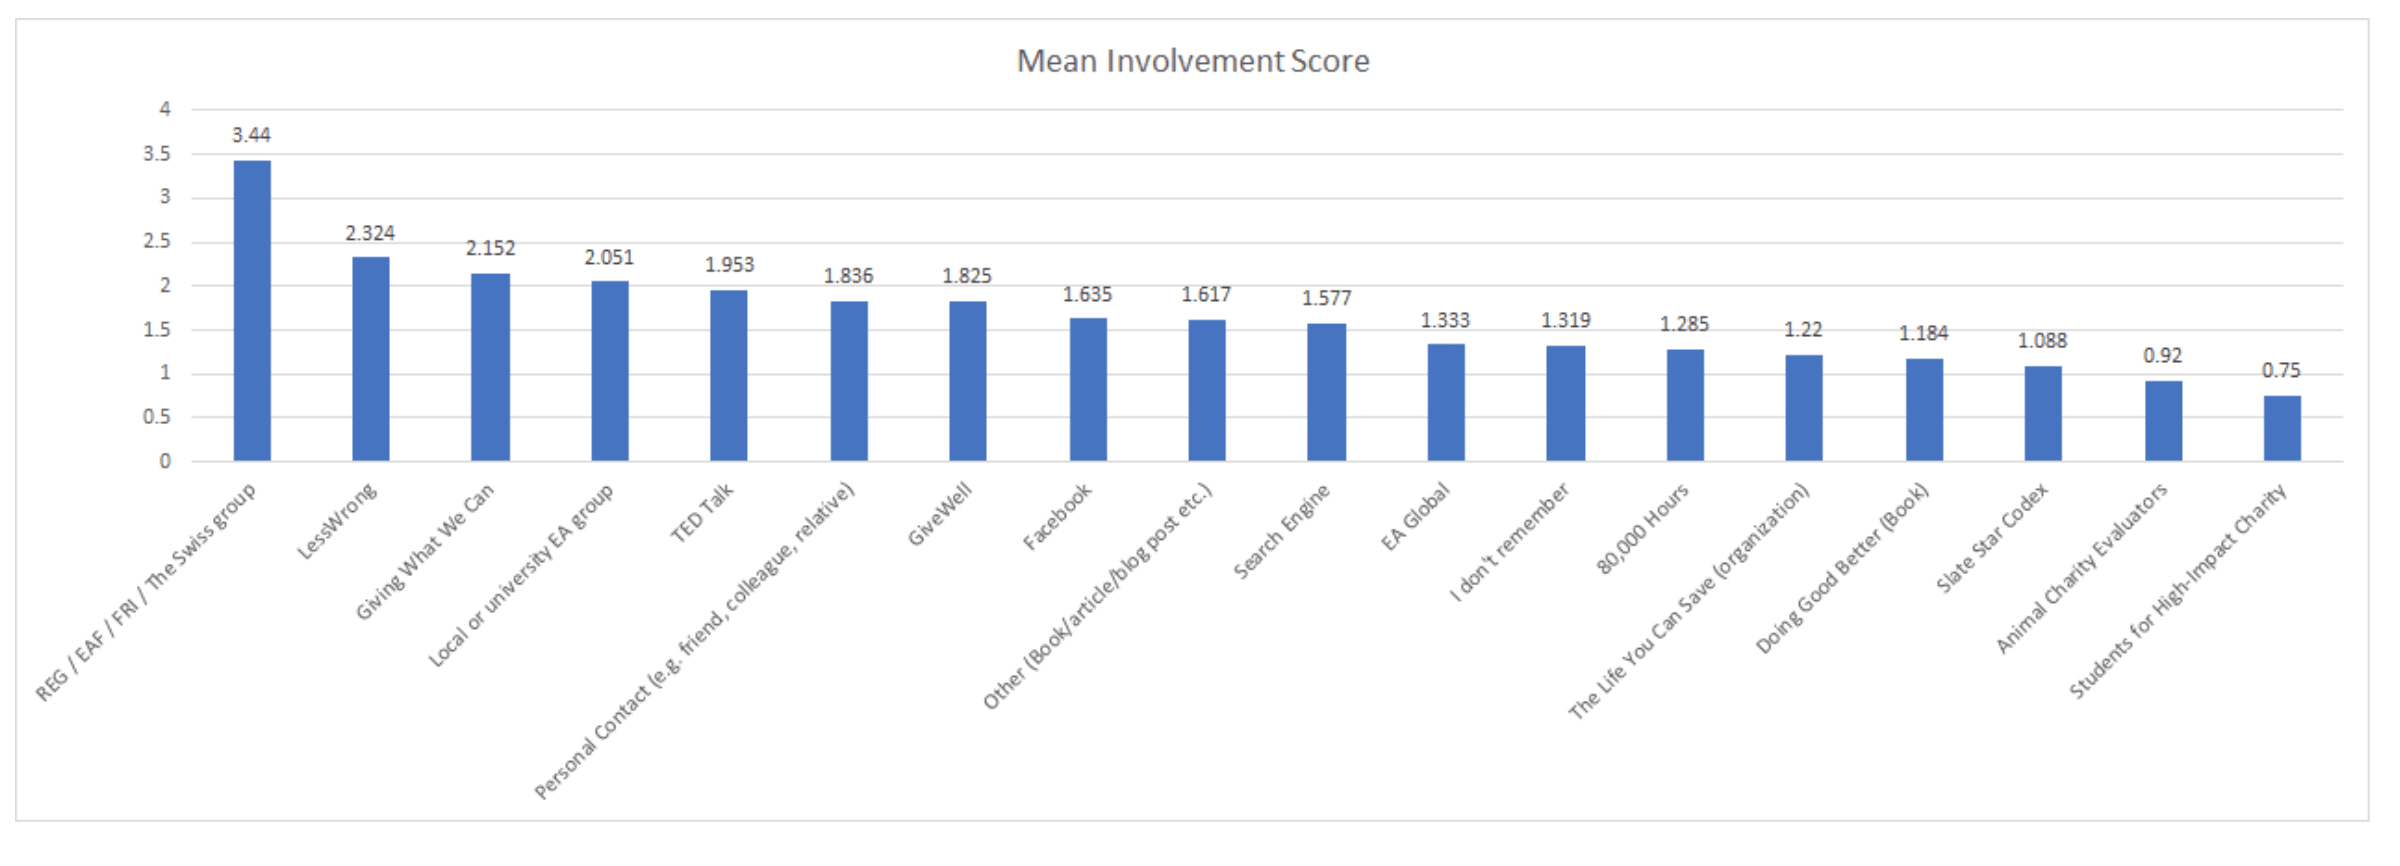
We also examined some alternative indicators of involvement. The first was an unweighted scale of membership across groups. Respondents were assigned a ‘score’ out of 6, where being a member of EA Facebook, the EA Forum, Giving What We Can (having taken the pledge), Local Groups, LessWrong or The Life You Can Save (having taken the Pledge) each counted for 1 point. Naturally, we would expect many EAs to think that some of these group memberships count as better proxies for (valuable) involvement in EA, which would require commensurate weighting of different memberships in a combined involvement score. However, as we would expect a variety of different views about what those weightings should be, which we cannot resolve here we simply present an unweighted score, where higher scores simply reflect involvement in a greater number of the listed groups, counting each group equally. In line with the other analyses above, those who first hear of EA from REG/EAF/FRI seem to be more likely to be involved in a wider variety of groups.
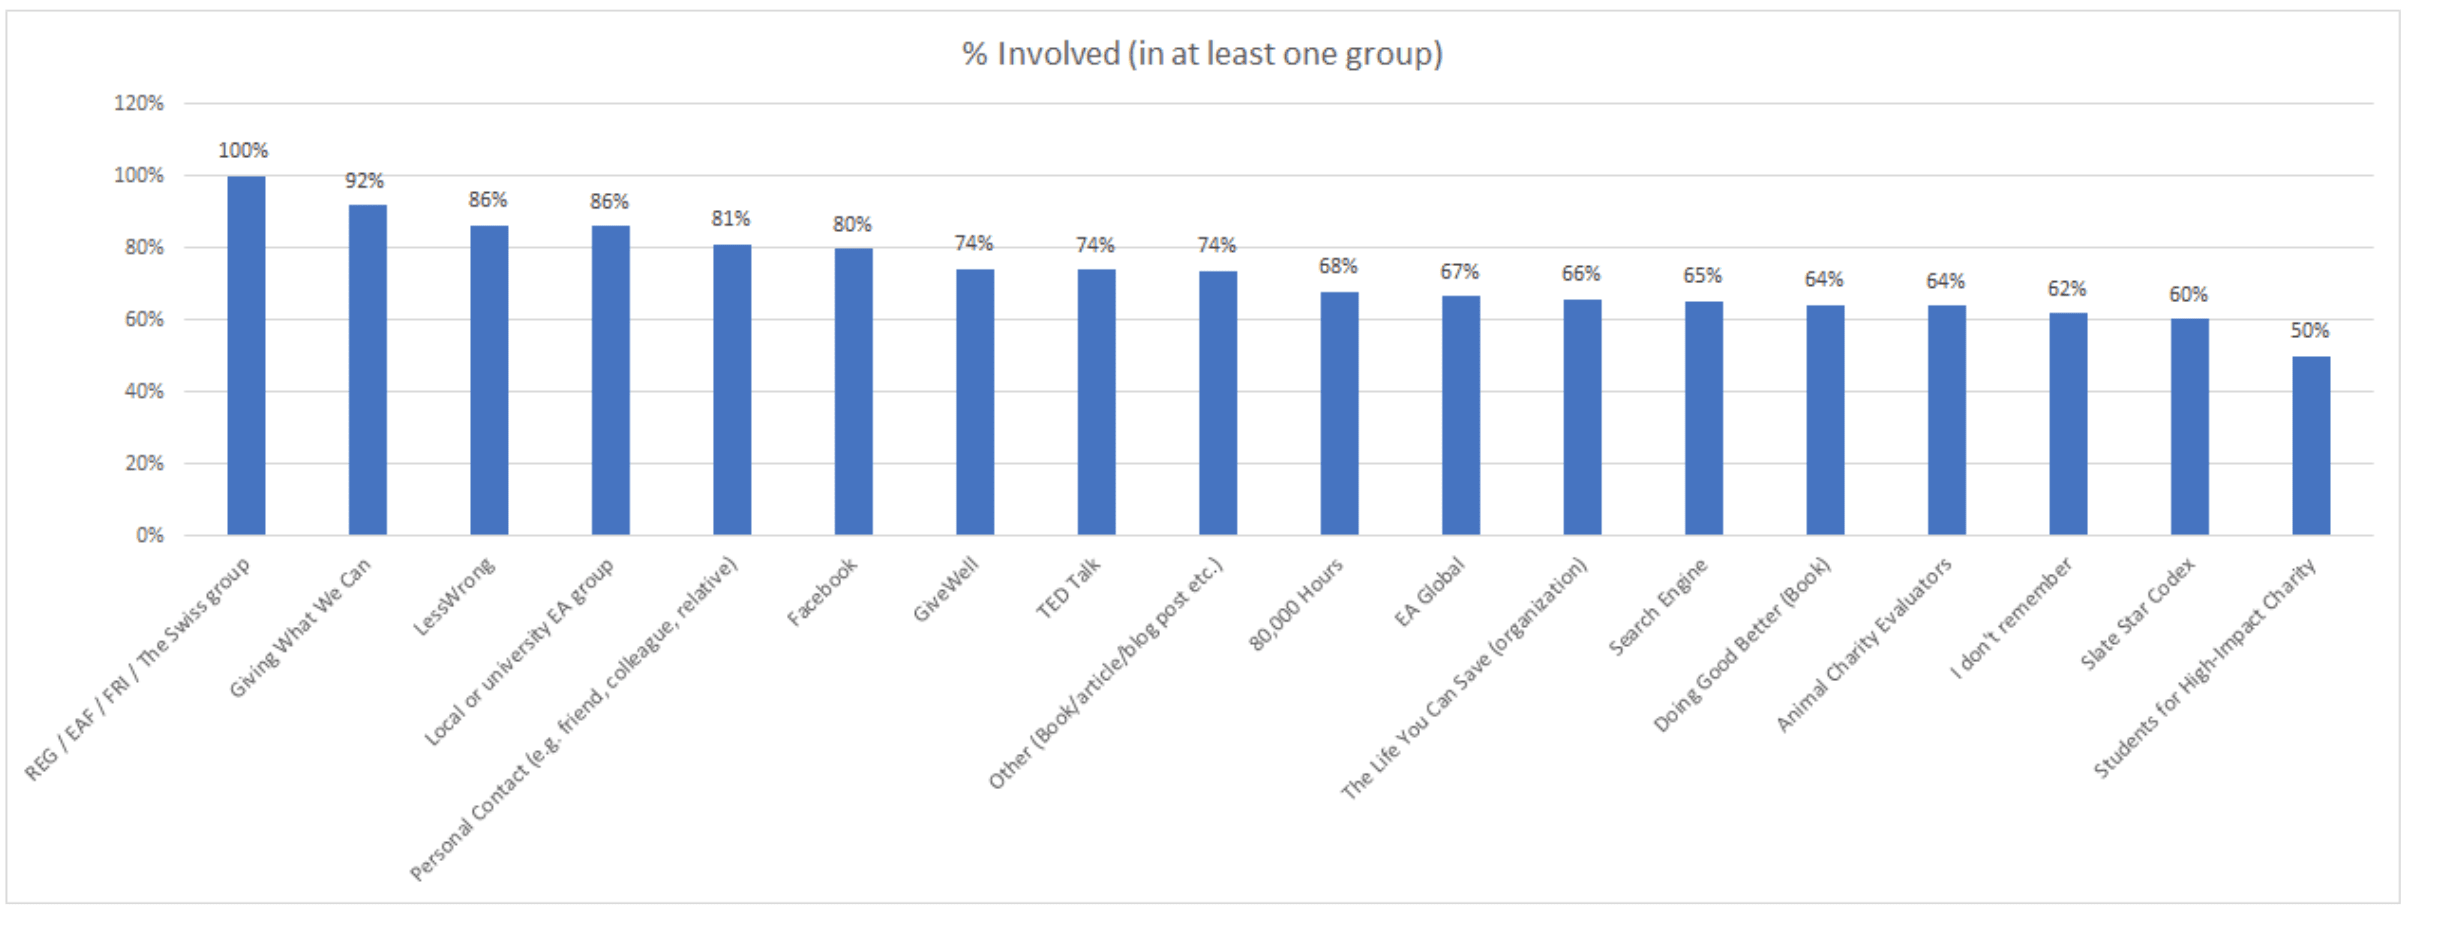
We also examine the percentage of EAs first hearing about EA from each source who are involved (in at least one of the EA groups listed above) versus not involved in any.
Conclusions
We examined the numbers and proportions of EAs who were members of the EA Forum and who had both made or expected to make a career change and taken the GWWC Pledge, across different routes into EA.
For the most part, we do not think that these results suggest significant differences between different places that people first hear of EA in terms of the proportion of ‘more involved’ EAs they recruit. The number of more involved EAs recruited from each source correlates extremely highly with the total number of EAs recruited from each source. There are some possible exceptions: EAG and REG/FRI/EAF both seem associated, across metrics, with a higher percentage of highly involved members, though very low numbers of EAs first hear about EA from these sources overall.
In future iterations of the EA Survey we will consider adding further potential proxies for higher levels of involvement in EA.
Credits
This post was written and with analysis by David Moss, Neil Dullaghan and Kim Cuddington.
Thanks to Tee Barnett for review and editing.
The annual EA Survey is a project of Rethink Charity with analysis and commentary from researchers at Rethink Priorities.
Supporting Documents
Other articles in the 2018 EA Survey Series:
I - Community Demographics & Characteristics
II - Distribution & Analysis Methodology
III - How do people get involved in EA?
IV - Subscribers and Identifiers
IX- Geographic Differences in EA
X- Welcomingness- How Welcoming is EA?
XI- How Long Do EAs Stay in EA?
XII- Do EA Survey Takers Keep Their GWWC Pledge?
Prior EA Surveys conducted by Rethink Charity
The 2017 Survey of Effective Altruists
The 2015 Survey of Effective Altruists: Results and Analysis
The 2014 Survey of Effective Altruists: Results and Analysis


Hi David,
Thank you very much for doing this (long!) analysis.
Your conclusion makes sense to me and is an interesting result.
It would be interesting to think about how the survey can be adapted to better pick up these differences in future years.
Ben
Thanks Ben!
Yes, I think next year one thing we will likely do is include some questions tracking EA knowledge (of specific concepts), which we included in the last Local Groups Survey, but have not included in an EA Survey thus far, as well as some other measures like "Have you read [such and such book]."
Something else we looked at, but which didn't really fit into the above post anywhere, was where supporters of AI/Long-Term Future causes in general first hear about EA. We basically just found that a very disproportionately large number first came from LessWrong (26% of AI supporters, compared to 12% of the sample as a whole), and not much difference anywhere else (except commensurately lower percentages from other sources). For Poverty (as you might expect) there was pretty much just the converse picture but with smaller differences.