Comments
This is going to be so useful for WANBAM. Thanks so much :) Your work is very impressive!
A bit offtopic, but if this isn't available yet, I'd be curious to see the distribution of "When did you join EA?" as an upper-bound estimate of the growth of the EA community.
See also this: https://forum.effectivealtruism.org/posts/MBJvDDw2sFGkFCA29/is-ea-growing-ea-growth-metrics-for-2018
Thanks Jonas!
You can see the total EAs (estimated from year first heard) and the annual growth rate here:

As you suggest, this will likely over-estimate growth due to greater numbers of EAs from earlier cohorts having dropped out.
I found this incredibly interesting and useful, in particular the "Engagement Level" section. Thanks! :)
(Btw, I think you can remove REG/FRI/EAF/Swiss from future surveys because we've deemphasized outreach and have been focusing on research. I also think the numbers substantially overlap with "local groups".)
Thanks. That makes sense. I try not to change the historic categories too much though, since it messes up comparisons across years.
I was thinking it's perhaps best to list it like this:
"Brian Tomasik's Essays on Reducing Suffering (or FRI/CLR, EAF/GBS Switzerland, REG)"
I think Brian's work brought several people into EA and may continue to do so, whereas that seems less likely for the other categories.
I also see the point about historic changes, but I personally never thought the previous categories were particularly helpful.
Perhaps surprisingly, given that LessWrong is often thought of primarily as an online community and forum, the next two largest response categories mentioned an in-person event (14%) or local group (14%).
The LessWrong community has had dozens (if not hundreds in total) of active meetup groups for almost a decade now, with a large number of people now very active in the community having come through those meetups. I am really quite surprised that you would say that it is surprising that people mention LessWrong meetups. They've always played a pretty big role in the structure of the EA and Rationality communities.
I think it's fair to say (as I did) that LessWrong is often thought of as "primarily" online, and, given that, I think it's understandable to find it surprising that these are the second most commonly mentioned way people hear about EA within the LessWrong category (I would expect more comments mentioning SlateStarCodex and other rationalist blogs for example). I didn't say that "surprising that people mention LessWrong meetups" tout court. I would expect many people, even among those who are familiar with LessWrong meetups, to be surprised at how often they were mentioned, though I could be mistaken about that.
(That said, a banal explanation might be that those who heard about EA just straightforwardly through the LessWrong forum, without any further detail, were less likely to write anything codable in the open comment box, compared to those who were specifically influenced by an event or HPMOR)
Yeah, that seems fair. I do think that "LessWrong meetups" are a category that is more similar to the whole "Local Group" category, and the primary thing that is surprising to me is that there were so many people who choose LessWrong instead of Local Group and then decided to annotate choice that with a reference to their local group.
Personal Contacts (14%), LessWrong (9.6%) and 80,000 Hours (9.6%) are still the main ways most people have heard of EA over time.
Shouldn’t Peter Singer be on this list? He showed up in 203 of the open ended responses (9.5% of 2137 total responses), and that doesn’t count any open ended comments that didn’t mention him by name or non-open ended responses that he’s associated with (e.g. the people who answered they heard about EA through TLYCS the organization, which I work for in the interest of disclosure).
Thank you for conducting and sharing this analysis!
Thanks Jon.
I agree Peter Singer is definitely still one of the most important factors, as our data shows (and as we highlighted last year. He's just not included in the bullet point in the summary you point to because that only refers to the fixed categories in the 'where did you first hear about EA?' question.
In 2018 I wrote "Peter Singer is sufficiently influential that he should probably be his own category", but although I think he deserves to be his own category in some sense, it wouldn't actually make sense to have a dedicated Peter Singer category alongside the others. Peter Singer usually coincides with other categories i.e. people have read one of his books, or seen one of his TED Talks, or heard about him through some other Book/Article or Blog or through their Education or a podcast or The Life You Can Save (org) etc., so if we split Peter Singer out into his dedicated category we'd have to have a lot of categories like 'Book (except Peter Singer)' (and potentially so for any other individuals who might be significant) which would be a bit clumsy and definitely lead to confusion. It seems neater to just have the fixed categories we have and then have people write in the specifics in the open comment section and, in general, not to have any named individuals as fixed categories.
The other general issue to note is that we can't compare the %s of responses to the fixed categories to the %s for the open comment mentions. People are almost certainly less likely to write in something as a factor in the open comment than they would be to select it were it offered as a fixed choice, but on the other hand, things can appear in the open comments across multiple categories, so there's really no way to compare numbers fairly. That said, we can certainly say that since he's mentioned >200 times, the lower bound on the number of people who first heard of EA from Peter Singer is very high.
Thanks David, that all makes sense. For future iterations of this analysis, I’d be strongly in favor of adding a sentence about Peter like you had in last year’s summary.
I just added him a mention of this to the bullet point about these open comments.

2137 (85%) respondents answered the “Where did you first hear about Effective Altruism?” question.[1]
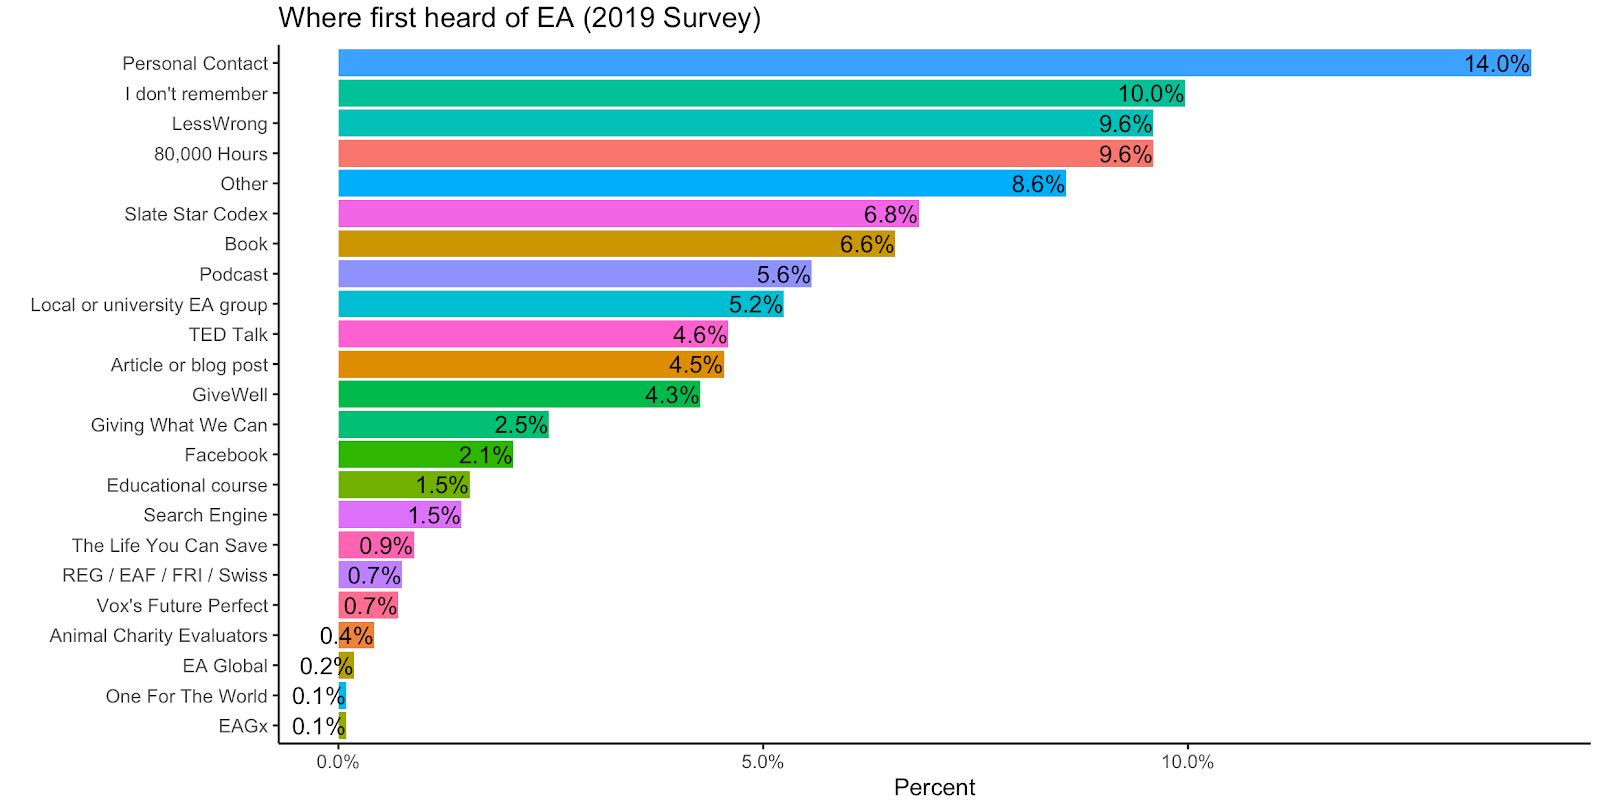
‘Personal Contact’ is quite far ahead of all other options (14%), followed by LessWrong and 80,000 Hours (each 9.6%). There are now substantially fewer responses in the broad ‘Other’ category (8.6%) than in 2018, but is still the fourth largest category.
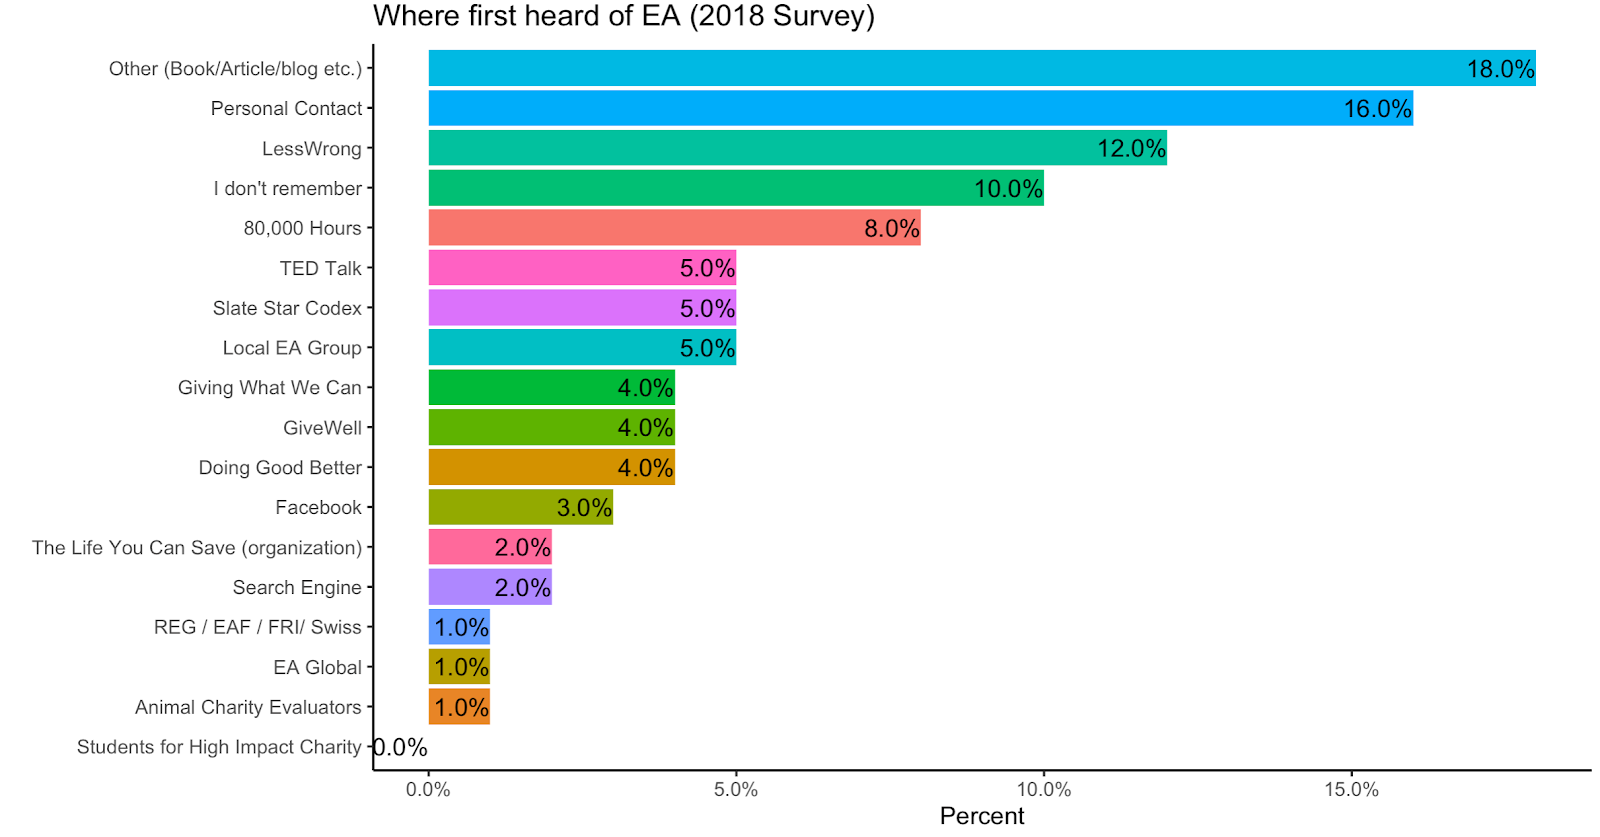
Due to changes to the categories, this year’s results are not directly comparable to the previous years. However, we can see that the results are quite similar. Personal Contact was the most selected option in both 2018 and 2019 (notwithstanding the ‘Other’ category in 2018), with 16% and 14% respectively. LessWrong (12% vs 9.6%) and 80,000 Hours (8% vs 9.6%) were the next most popular categories. Local EA Group (5% vs 5.2%) and Slate Star Codex (5% vs 6.8%) follow next, with Book (6%) and Podcast (5.6%), TED Talks (4.6%) and Article/Blog (4.5%) also receiving similar numbers of responses. New additions, Future Perfect and One For the World, received <1% of responses each.
We also analysed open comment data for the 8.6% of respondents who selected ‘Other’.
Out of the 183 respondents who selected “Other”, 50.8% were categorised as fitting into existing categories. Many of these wrote something like “I’m not sure, either LessWrong or 80,000 Hours”, so they cannot be unambiguously coded as any single category. Of those responses that seemed to fit single existing categories, 31 mentioned a Blog or Article, 24 mentioned a Personal Contact, 14 mentioned an Educational Course, 8 mentioned a Local Group, 6 mentioned LessWrong, 6 a Podcast, 4 80,000 Hours, 2 a Book and 1 Slate Star Codex.
Of those responses which did not fit a pre-existing category, the most mentioned was Peter Singer (38). 21 mentioned an other EA org (including FHI (4), CFAR (3), SPARC (2), MIRI (2) Effective Giving (1), SHIC (1), CEA (1), OpenAI (1), REG (1), MFA (1), GBS Schweiz (1), and Leverage Research (1)), 10 mentioned YouTube, 3 mentioned Radio, and 20 were uncategorised others including Felicifia (an old forum for discussing utilitarianism) (3), a rap (1) and a coffee shop (1).
As we noted last year, where people first hear about EA has changed significantly over time.[2]
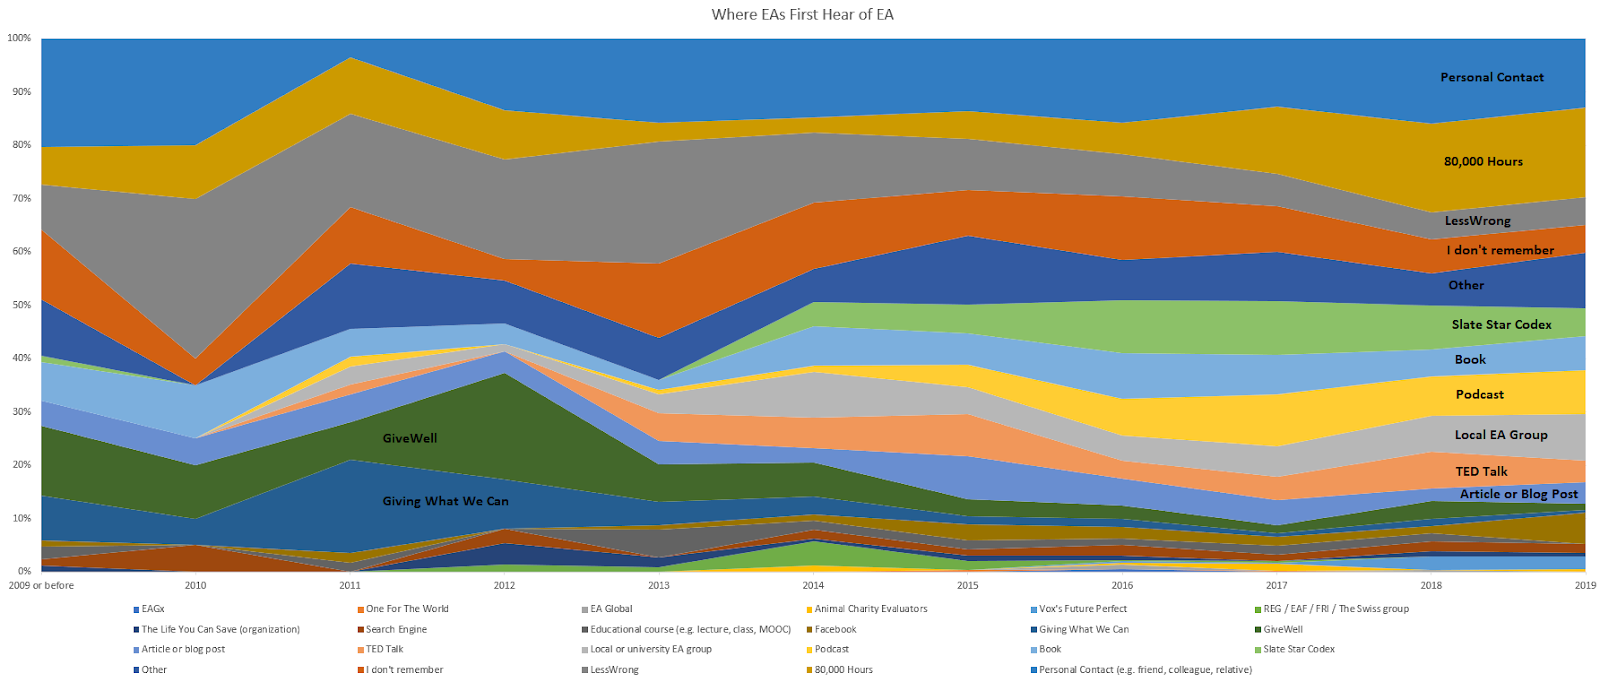
Link to full size image: https://i.ibb.co/0cp7ThS/image.png
Full table: https://docs.google.com/spreadsheets/d/1lLcWu3gdXqeNjmlBeQkn_ta6MXWtTDXwK3zjXsOsRhY/edit?usp=sharing
Categories are displayed in reverse order (i.e. options at the top of the graph are at the bottom of the legend).
While this graph is not easy to read due to the large number of options, we can see some of the major trends. Personal Contact, at the very top of the graph, has remained a significant influence throughout. 80,000 Hours, as we reported last year, has increased in influence with time and recruited 17% of new EAs in both 2018 and 2019 (almost double its total percentage over time). At the same time, LessWrong has clearly declined in influence. This broadly reflects the trends identified last year.
This year we also asked respondents to provide further details explaining their responses to the above question in order for us to identify more precisely where people first heard about EA.[3] This allows us to see which specific books or podcasts etc. are most commonly mentioned within these categories.
The categories below are ordered from those with the largest number of open comment responses to those with the least.[4] It is important to note that many of the categories towards the end have very small numbers of responses, such that a single respondent might represent multiple percentage points.
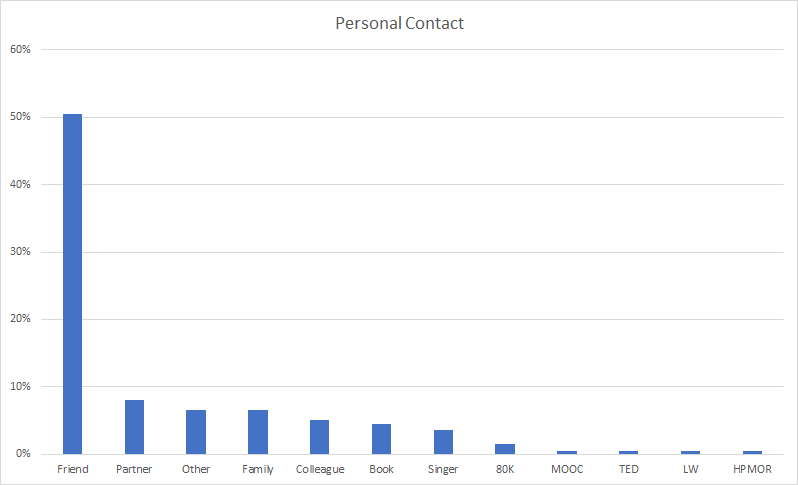
200 respondents offered open comments for this category.
Friend was by far the most commonly mentioned response category, mentioned in over 50% of responses. This was followed by partner (8%), other (7%), family (7%) and colleague (5%). 5% of responses also mentioned a book (e.g. a personal contact giving them a book).
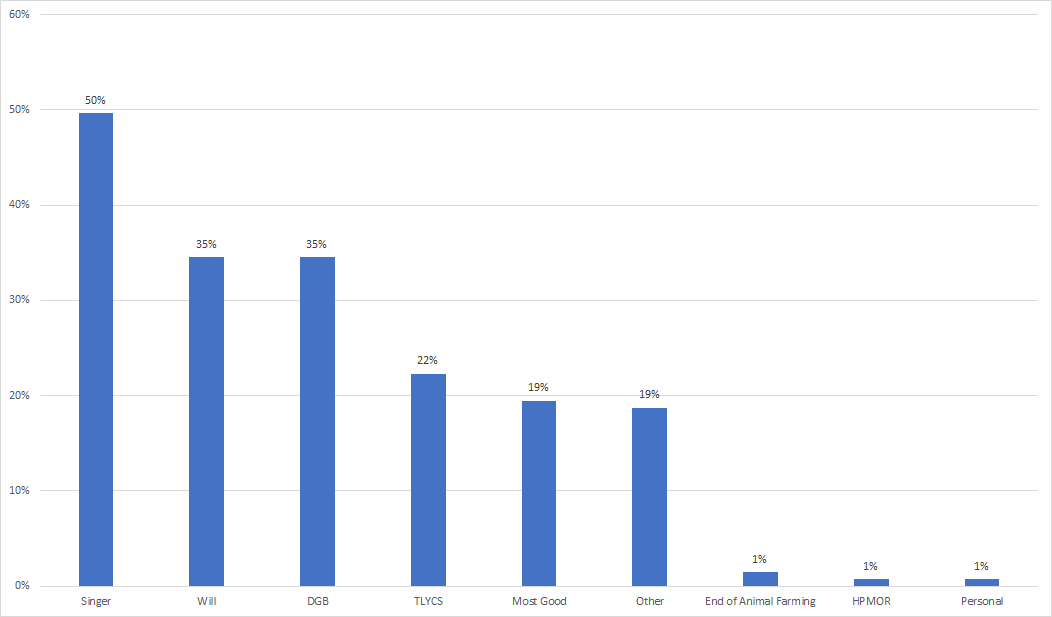
139 respondents offered further details within the Book category.
The largest category mentioned here was Peter Singer, being mentioned in 50% of comments, followed by Will MacAskill in 35% of comments. 35% of comments referred to Doing Good Better, whereas 22% mentioned The Life You Can Save and 19% The Most Good You Can Do. As many comments just mentioned “Peter Singer” without specifying which books, the true count for these individual books is presumably higher.
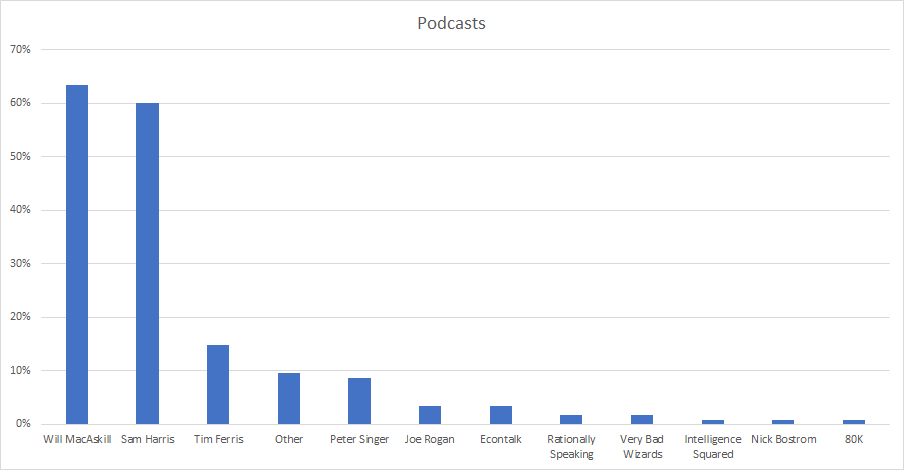
115 open comments were given for the category of podcasts.
63% mentioned Will MacAskill. 59% mentioned a Sam Harris podcast. 15% mentioned Tim Ferris. 9% mentioned Peter Singer. 3% mentioned Joe Rogan and 3% mentioned EconTalk. 2% mentioned Julia Galef’s Rationally Speaking and 2% David Pizarro’s Very Bad Wizards. 1% mentioned Intelligence Squared, Nick Bostrom and 80,000 Hours respectively.
It is worth noting that the low percentage of mentions of 80,000 Hours within the category of Podcasts may be due to the fact that there was a separate category for 80,000 Hours, which may have attracted these respondents. That said, there were also relatively few mentions of the 80,000 Hours podcast within the 80,000 Hours comments, so it may be that the podcast plays more of a role in the involvement of people who have already heard of EA, rather than as a place where people first hear about EA.[5]
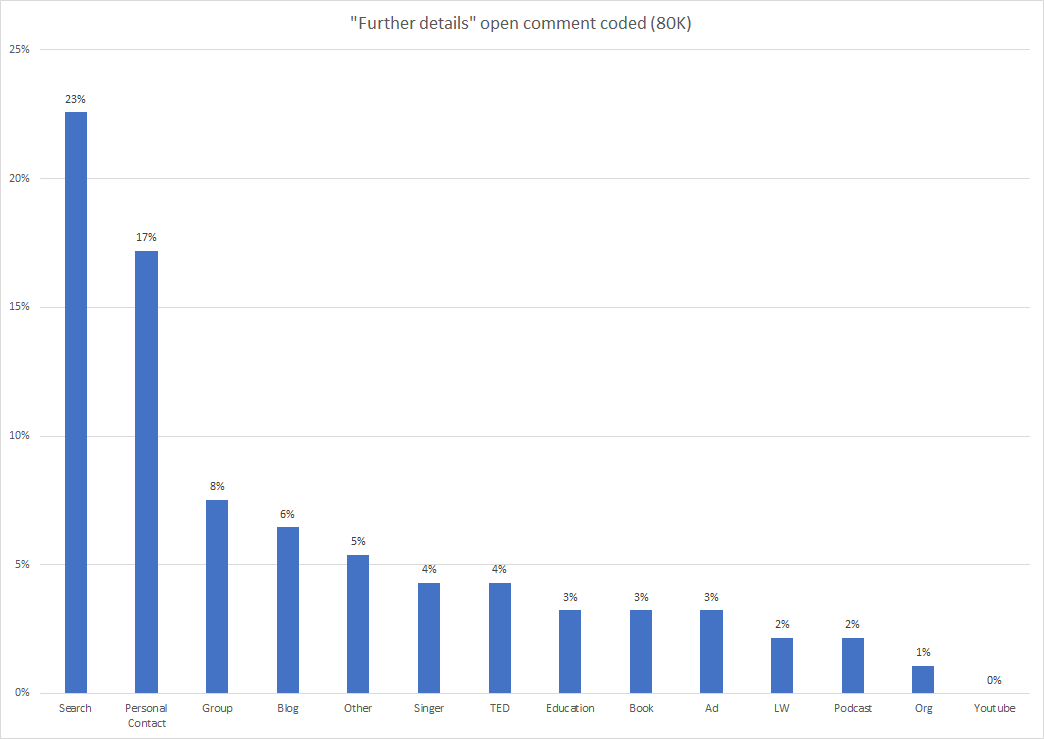
92 respondents who selected 80,000 Hours for the First Heard question offered further details about how they got involved.
23% of these described independently searching for something, such as “careers that do the most good” and finding 80,000 Hours. 17% described first hearing through a personal contact - e.g., a friend linking them to the 80,000 Hours websites. 8% reported the involvement of a local group (e.g., hearing about 80,000 Hours at a Fresher’s Fair), and 6% mentioned a blog (5 out of 7, mentioning “Wait But Why” specifically.
These results seem to suggest that (within this category at least) people independently searching for content which EAs have written about is particularly important relative to direct outreach by orgs. Personal contacts referring people to EA content is also highly important, being mentioned by slightly more than 1 in 6 of respondents within this category.
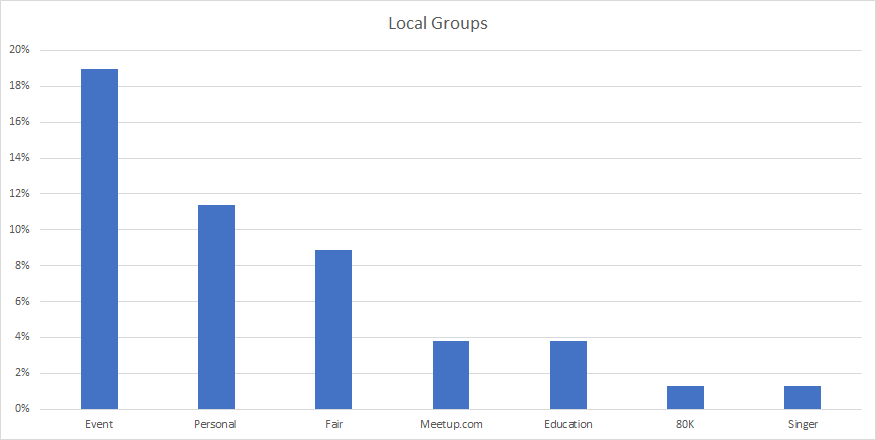
79 open comments were given for the local group category.
The most commonly mentioned category here was events (19%) followed by personal contacts (11%) and freshers’ fairs. 4% of responses mentioned Meetup.com specifically (which the 2017 Local Groups Survey found was a highly important source of new EAs for a small number of groups) and 4% mentioned Education or a course.
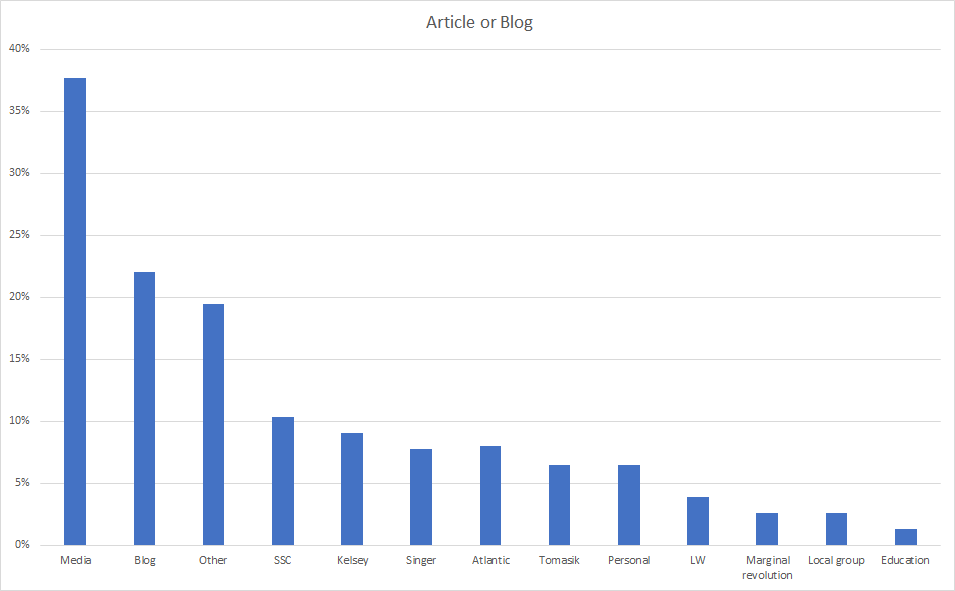
77 respondents gave further details within this response category.
This category was spread quite diffusely over different kinds of media and different specific articles, suggesting that no single one accounts for a large proportion of respondents.
38% of responses were coded as “Media” articles, referring to mainstream media such as newspapers, as opposed to private blogs. 22%, by contrast, were coded as involving blogs. The most commonly mentioned blog was Slate Star Codex (note that SlateStarCodex is also its own category) mentioned by 10% of all ‘Article or blog’ responses (not 10% of the 22% ’Blog’ responses), followed by Kelsey Piper’s blog (8%), Brian Tomasik blog (6%) and Marginal Revolution (3%). The most commonly mentioned mainstream media source was The Atlantic (8%). Peter Singer (8%), Personal Contacts, LessWrong (4%) and local groups (3%) were also mentioned.
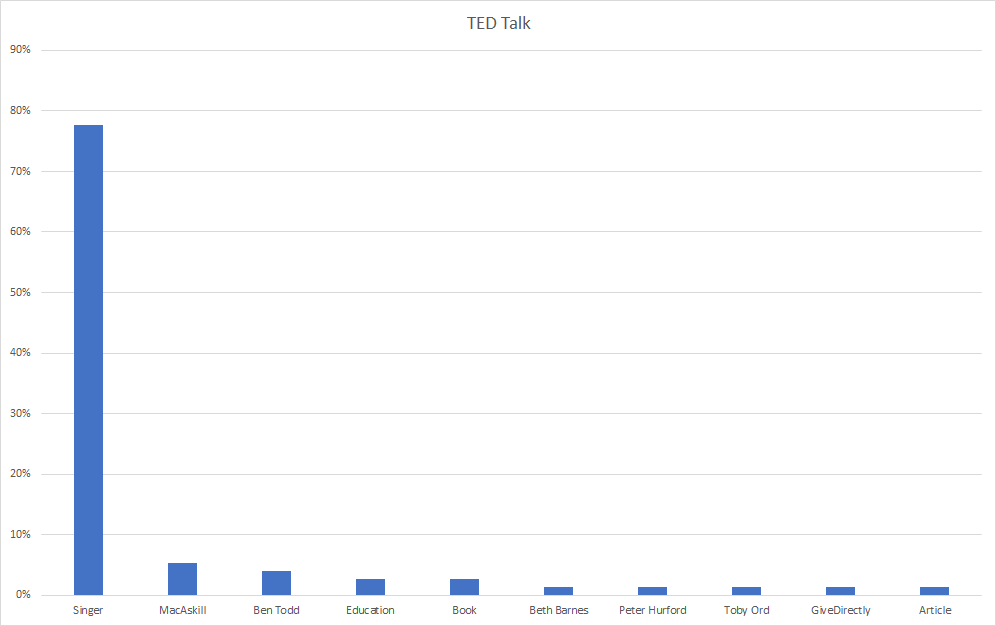
There were 76 open comments within the TED Talk category.
Peter Singer by far the most mentioned category, referenced in 78% of responses. This was followed by mentions of Will MacAskill (5%) and Ben Todd’s TED Talk (4%). 3% mentioned Education (e.g. first having encountered Peter Singer in a university course and then finding his TED Talk) and 3% mentioned a book. TED Talks by Beth Barnes, Toby Ord and Peter Hurford were each mentioned once.
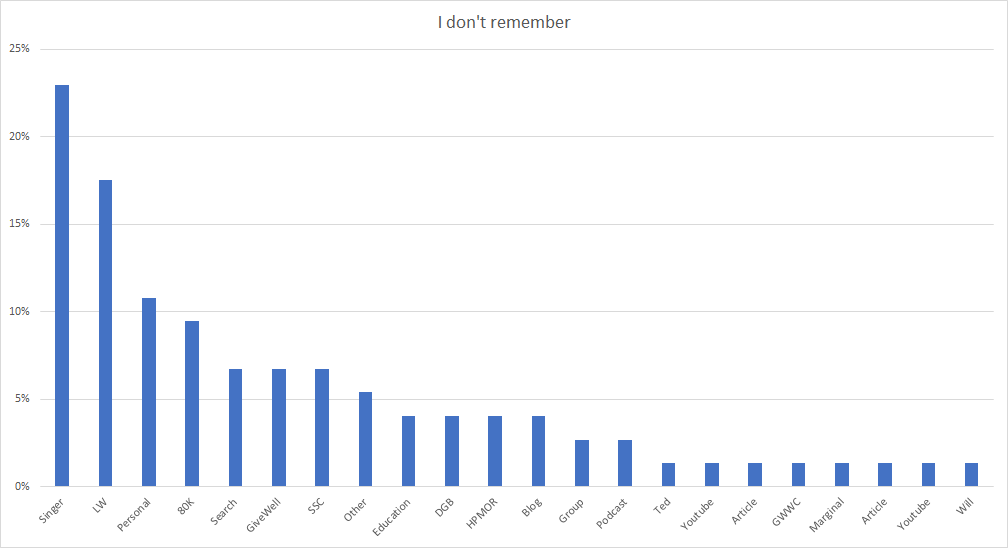
There were 75 responses within the “I don’t remember” category. Although this might sound paradoxical, most responses gave some specific details about where they first heard about EA, usually with a caveat about not being certain. In future years we might emphasise that respondents should give their best guess if they strongly suspect that it was one or another category.
Unsurprisingly, responses within this category were more heterogeneous than those within other categories. 23% of responses mentioned Peter Singer. 18% mentioned LessWrong. 11% mentioned a Personal Contact. 9% mentioned 80,000 Hours. 7% mentioned each of an independent search, GiveWell and SlateStarCodex.
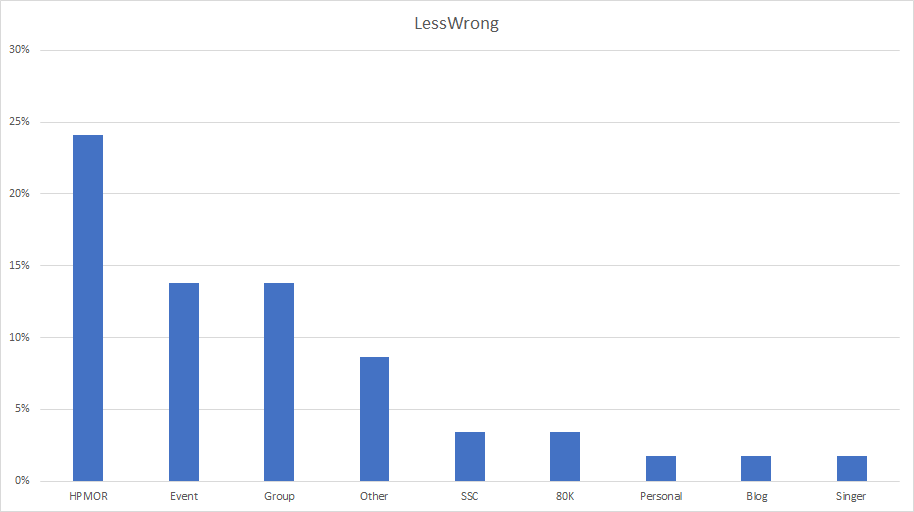
There were 58 comments within the category of LessWrong.
The largest number of these responses mentioned HPMOR (24% of responses). Perhaps surprisingly, given that LessWrong is often thought of primarily as an online community and forum, the next two largest response categories mentioned an in-person event (14%) or local group (14%). 3% each also mentioned SlateStarCodex or 80,000 Hours.
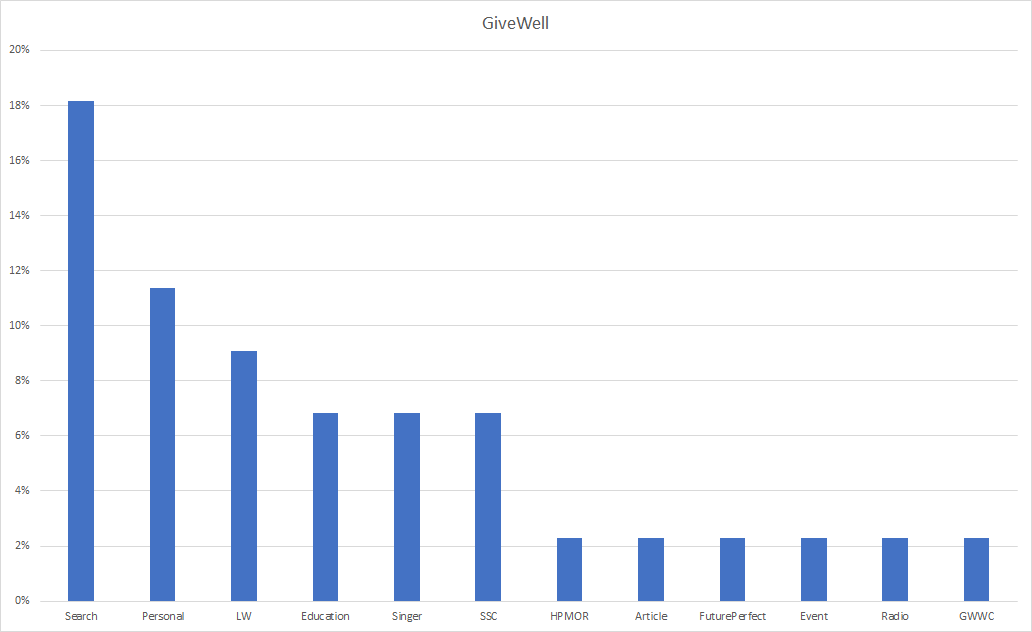
44 open comments were offered for this response category.
18% of responses mentioned an individual independently searching for information (e.g. about the best charities) and finding GiveWell. As with 80,000 Hours, this was the most commonly mentioned category. 11% mentioned a Personal Contact. 9% mentioned LessWrong (e.g. they heard about GiveWell through LessWrong). 7% mentioned Education or a course, 7% mentioned Peter Singer and 7% mentioned SSC. Harry Potter and the Methods of Rationality, an unspecified article, Future Perfect, an event, radio and Giving What We Can were each mentioned by 1 respondent.
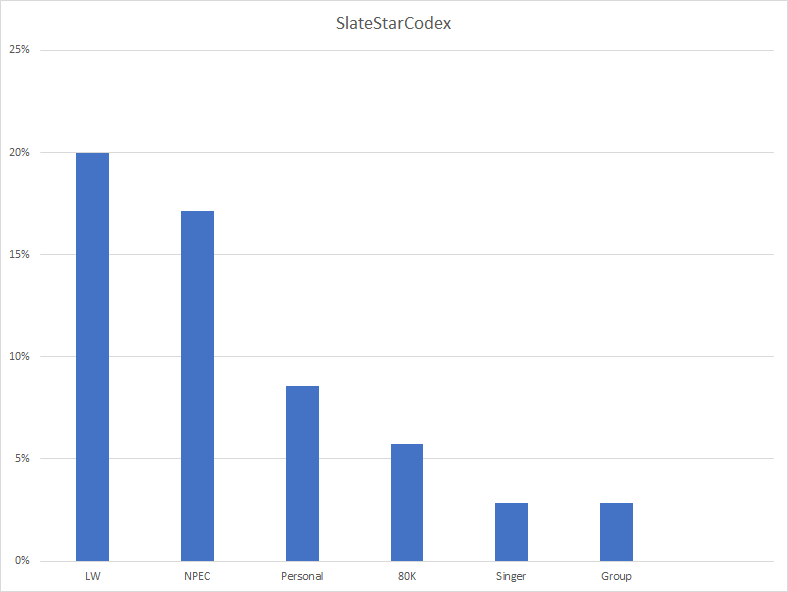
There were 35 open comments within the SlateStarCodex category.
20% of these mentioned LessWrong (some said that it was either SlateStarCodex or LessWrong from which they first heard about EA, others mentioned both). A full 17% of these responses mentioned the post “Nobody is Perfect, Everything is Commensurable”. No other specific posts were mentioned multiple times. 9% of responses mentioned a personal contact and 6% 80,000 Hours.
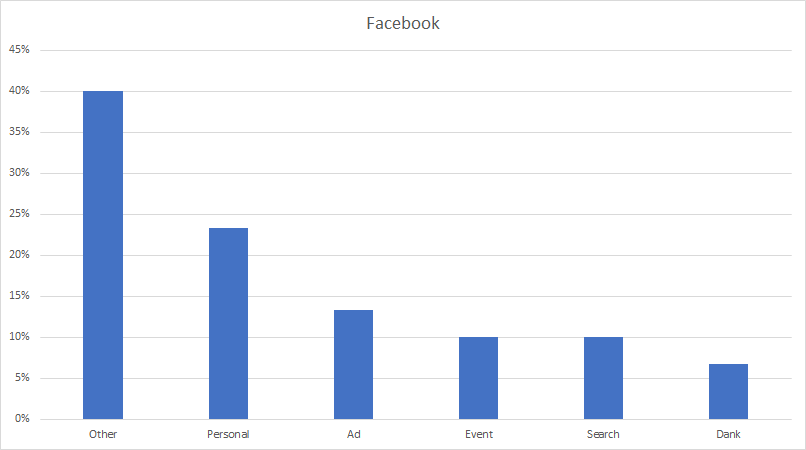
There were 30 open comments within this category.
23% mentioned a Personal Contact (e.g. a friend sharing something on their wall). 13% mentioned an ad on Facebook. 10% mentioned an event. 10% mentioned an individual independently searching for something and finding EA content. 7% mentioned Dank Memes and/or Optimal Memes for Cosmopolitan Teens.
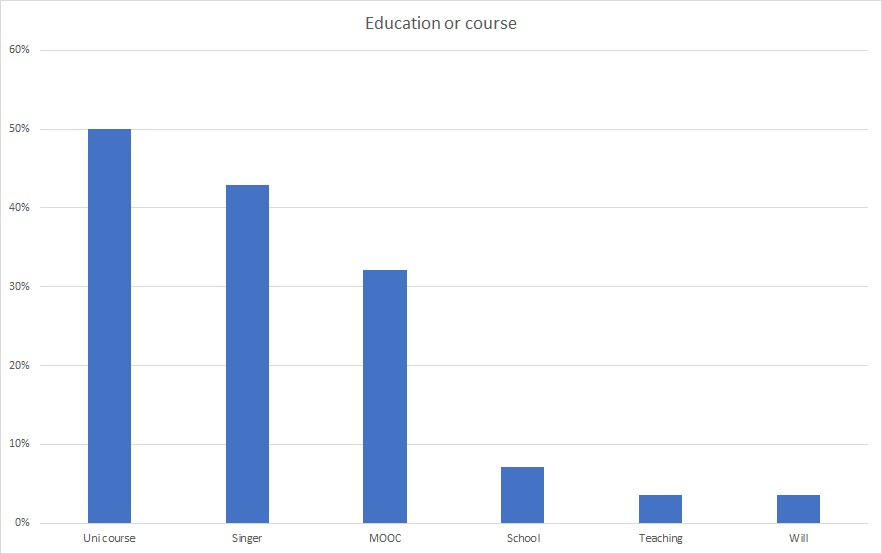
29 open comments were offered for this category.
50% of these mentioned a university course. 32% mentioned a MOOC. 7% mentioned high school classes and 4% mentioned the respondents own teaching. 43% mentioned Peter Singer, either with reference to his online course or his work being mentioned in other courses. 4% mentioned Will MacAskill.
25 responses were given for this category.
22% mentioned an article and 22% mentioned a personal contact. 15% mentioned an independent search and 15% mentioned Peter Singer and 11% mentioned the involvement of a local group.
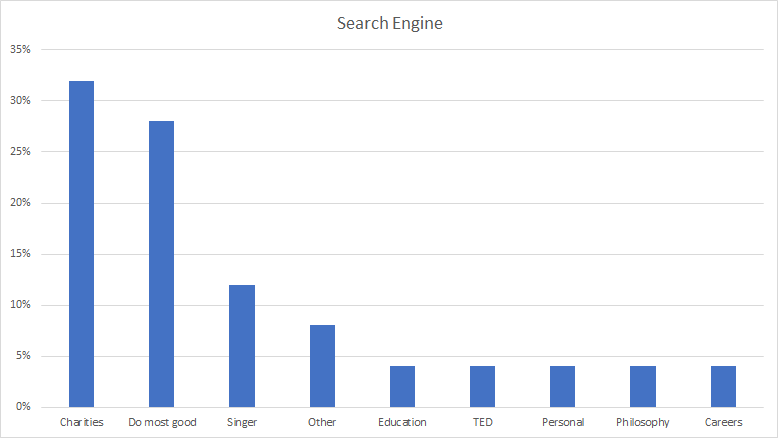
There were 25 open comments within the search engine category.
32% of these specifically mentioned searching for information about charities, while 28% mentioned searching generally for how to do the most good with one’s life or utilitarian ethics, while 12% mentioned Peter Singer.
There were only 10 open comment responses for this category. 4 (40%) of these mentioned a prior interest in Peter Singer, which then led them to The Life You Can Save. 2 mentioned a lecture by Peter Singer, 2 mentioned a book and 1 mentioned a local (The Life You Can Save) group.
There were only 5 open comments from this category. Of these 2 mentioned articles by Dylan Matthews, 1 mentioned Kelsey’s personal blog, 1 Future Perfect and 1 mentioned the Ice Bucket challenge articles specifically.
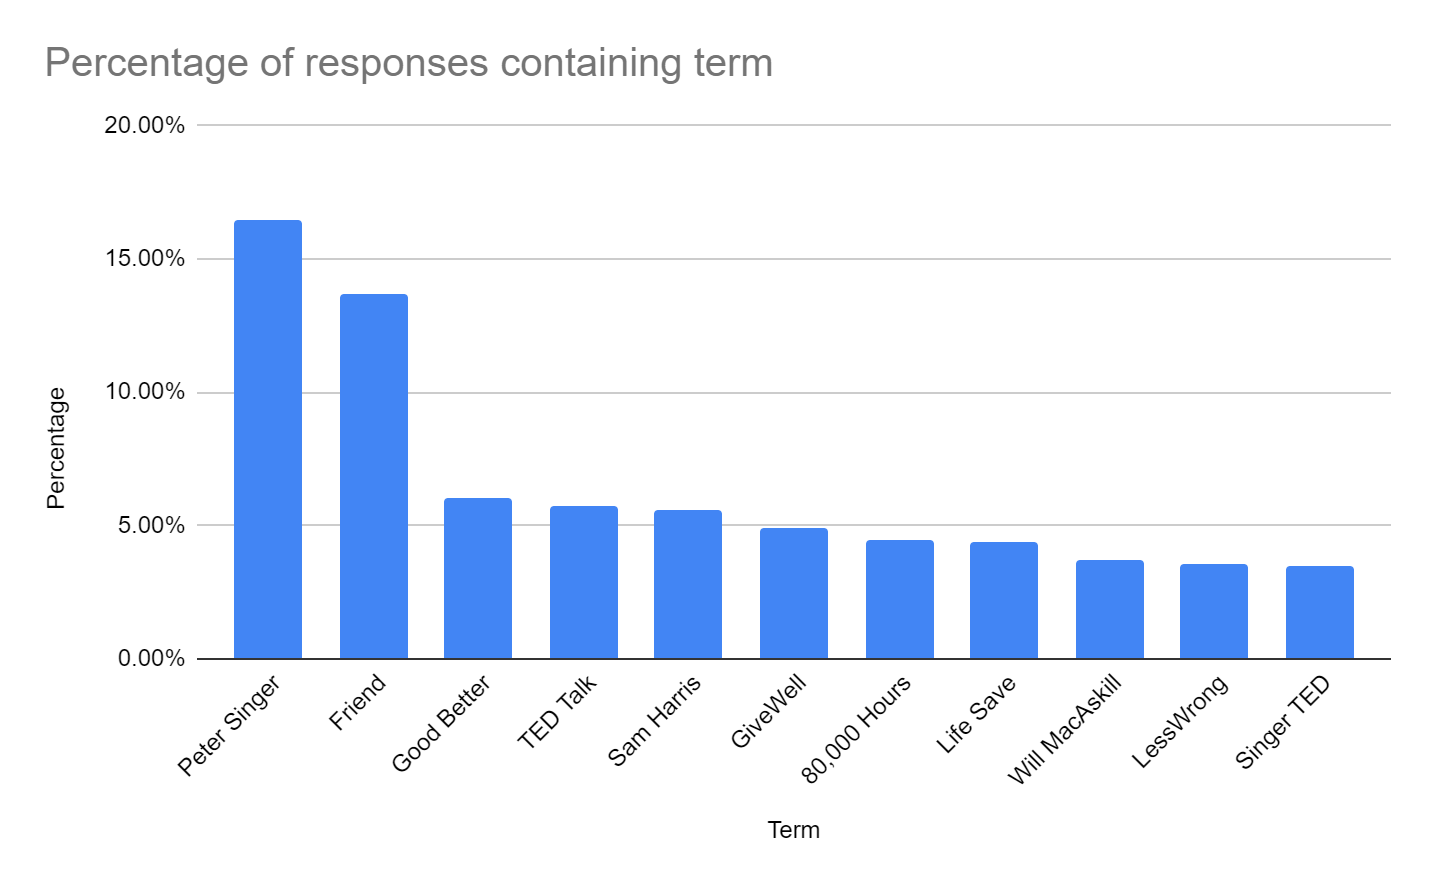
SurveyMonkey (the software we used to run the EA Survey) offers automatic text analysis of commonly recurring words in open comment data. While this is more crude than our hand-coded qualitative analysis, it offers a rough overview of all the open comment responses across categories,
The analysis below was automatically conducted by SurveyMonkey, but we removed likely uninformative word categories, such as “ea.” As in our analyses, the percentages reflects the percentage of responses the word or phrase appears in and, as such, they can collectively sum to move than 100%.
In line with our analyses above, Peter Singer and Personal Contact (Friend) appear as extremely influential categories, when aggregating across categories.

We also asked a multi-select question, “Which factors were important in 'getting you into' effective altruism, or altering your actions in its direction?”.
Since respondents could select multiple options, the percentages below represent the percentage of respondents who selected each option, not the percentage of responses, and can sum to more than 100%. We would expect this multi-select question to better capture the role that multiple overlapping factors might play in getting people involved in EA.
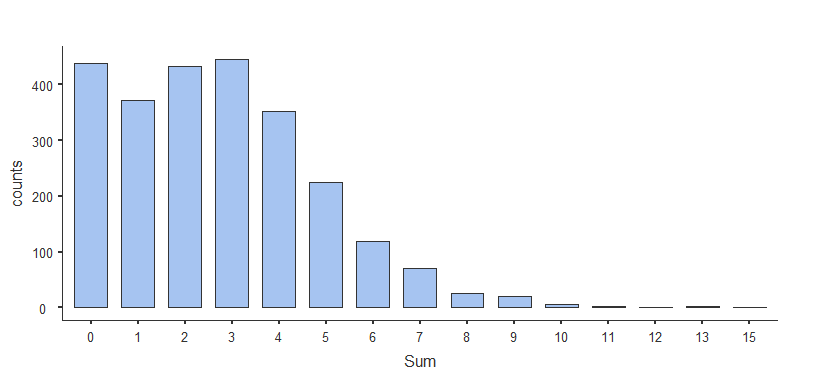
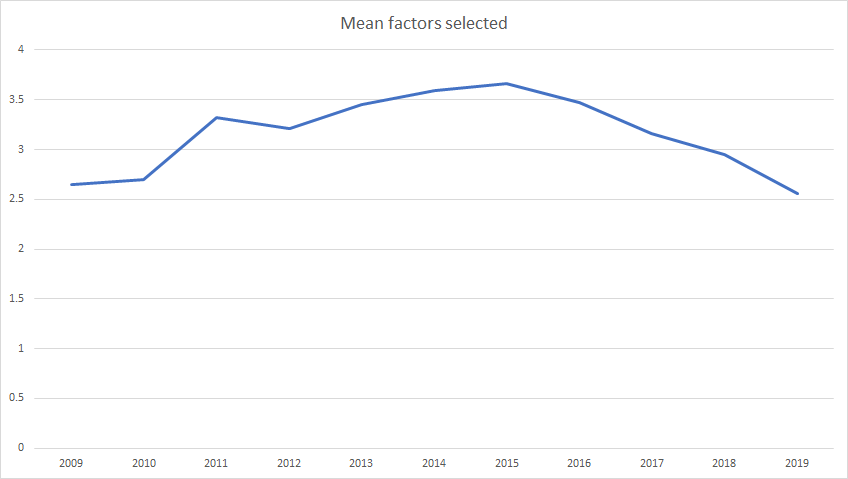
We find the vast majority of respondents selected between 0 and 4 factors as being important (mean 3.71, median 3), but a minority selected up to 15. The average number of factors being selected varied somewhat over time, with the EAs who heard about EA longest ago and most recently each selecting fewer factors as being important.
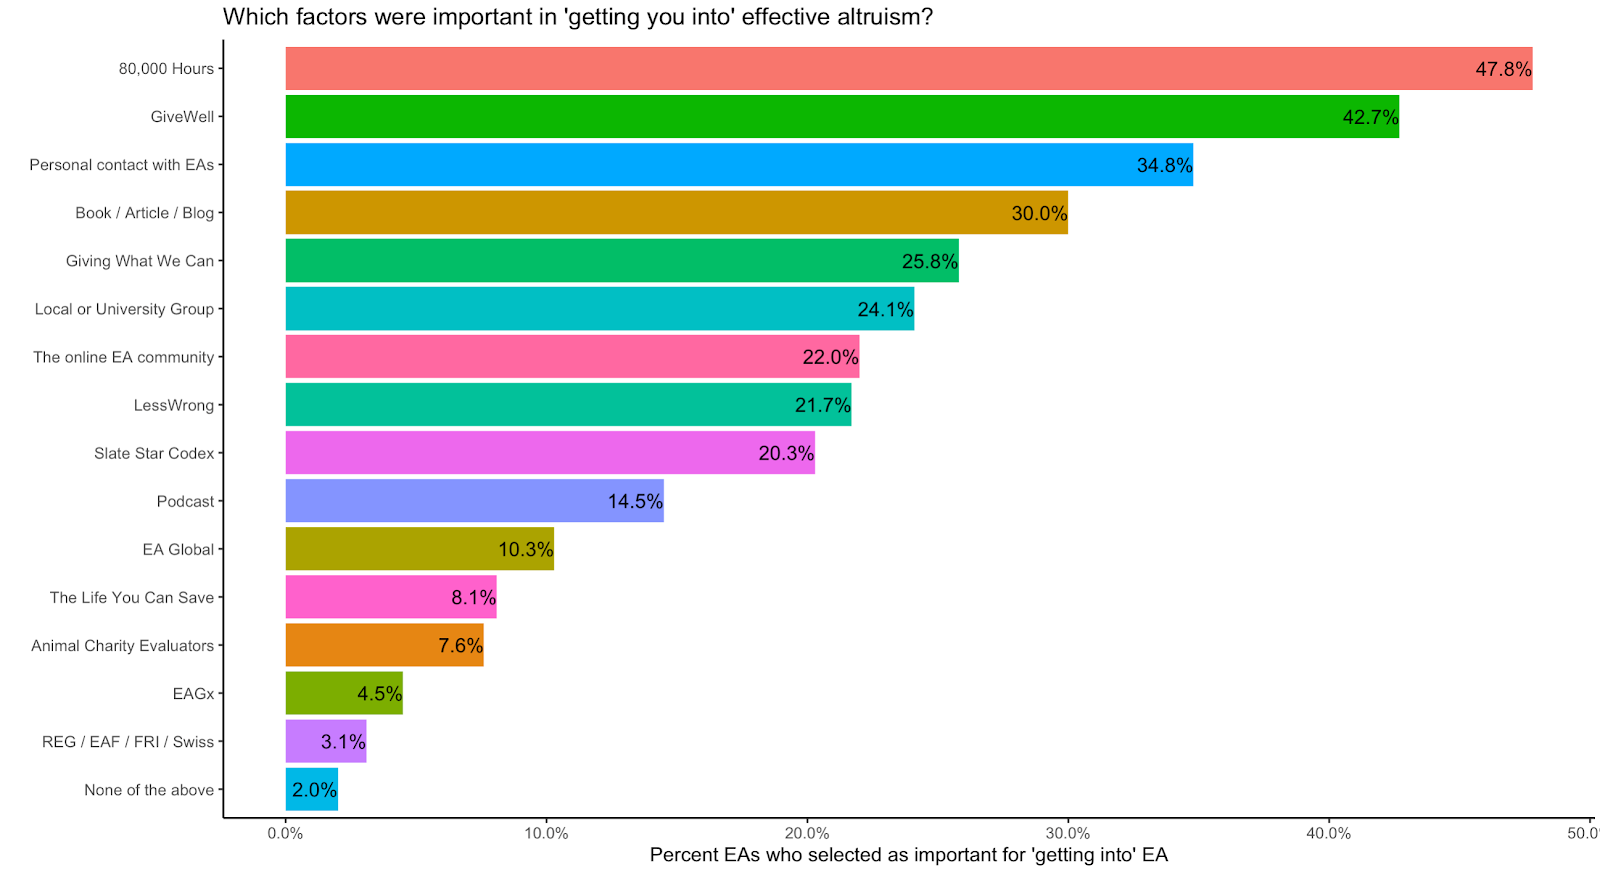
The ordering of the results here is somewhat different to where people first hear of EA. This makes sense, since where people first hear about EA might differ from what contributes to them getting more involved.
As we can see, almost half (46.6%) of respondents indicated that 80,000 Hours was responsible for getting them more involved with Effective Altruism, while 41.7% indicated that GiveWell was responsible for them getting involved, followed by Personal Contact being selected by 34% of respondents. This means that GiveWell, in particular, appears much more influential when EAs are asked which factors were important for getting them more involved than when asked where they first heard about EA.
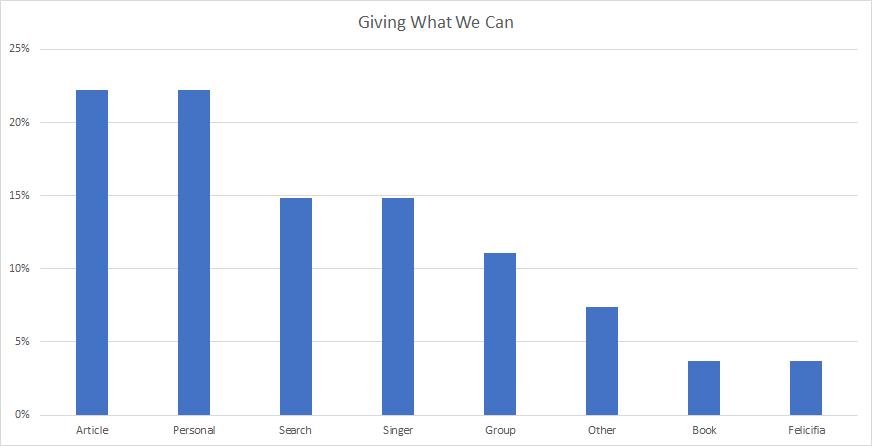
The percentages for each route into EA are notably higher than for the first heard question, reflecting the fact that even if a given factor is not where someone first heard about EA, it may still be important for them getting more involved. Of note, despite only 2.5% of EAs in the sample saying that they first heard about EA from Giving What We Can, 25.2% indicated that GWWC was important for getting them involved. Local EA Groups (23.5%) and the Online EA community (21.2%) were also selected as important by a similar number of respondents. EA Global, which was where only 0.2% of EAs first heard about EA, was selected as important by around 10% of EAs.
As in the case of where people first heard of EA, the percentages of people selecting different factors varies across cohorts of EAs who joined EA in different years.
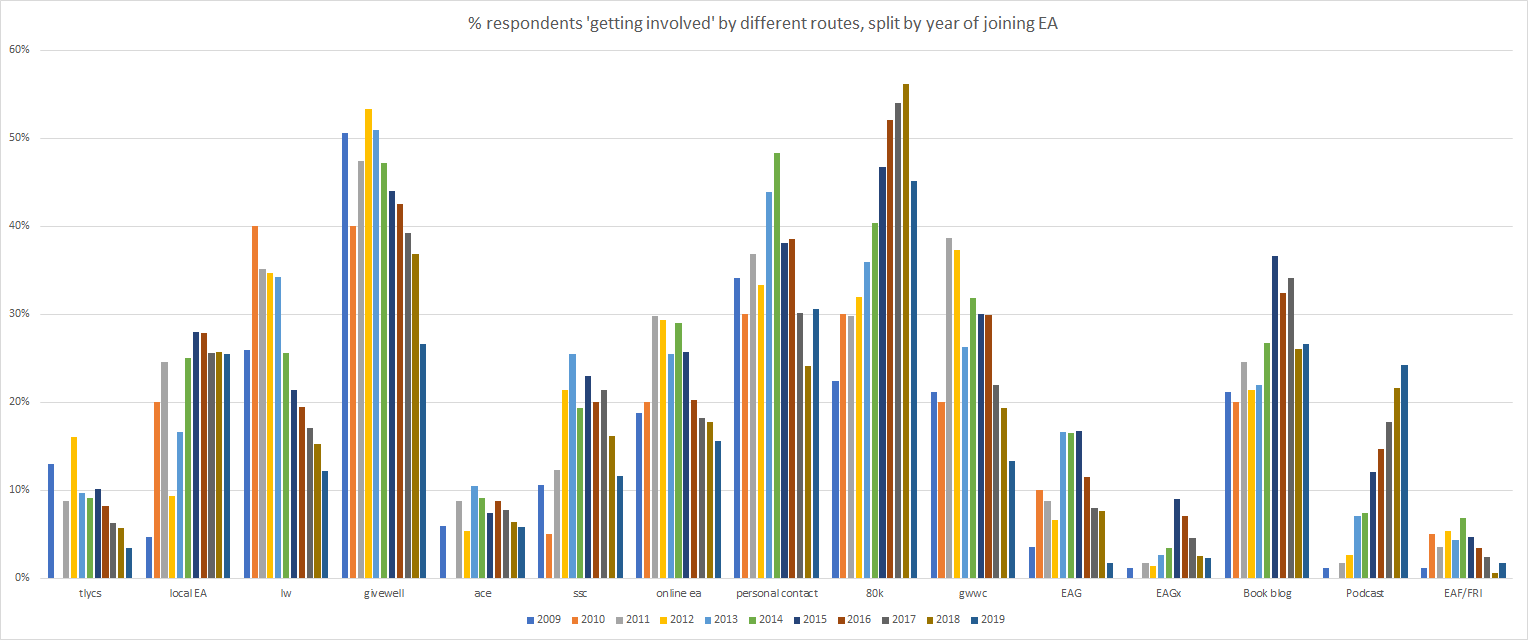
Full image: https://i.ibb.co/WFcSpRY/image.png
Here there appear to be particularly clear trends across time for LessWrong, which has declined dramatically in influence (mirrored in the First Heard data) and for 80,000 Hours which continues to increase in influence across newer cohorts of EAs. The percentage of EAs selecting Podcasts has also increased dramatically across time, with around 24% of respondents indicating that they were important in the 2019 cohort.
We also examined differences in the levels of engagement in EA of people who first heard of EA from different sources. Last year we found few signs of significant differences. The full crosstab for levels of engagement and different sources of EA is here.
For simplicity, we classify EAs into only two groups based on level of engagement (those who selected 1-3 or 4-5 on the engagement scale[6], which divides respondents into two roughly equal-sized ‘low’ and ‘high’ engagement groups respectively). One thing that is important to bear in mind is that these results are likely confounded by the time when different routes into EA recruited most people. As newer EAs are likely to be less engaged on average, routes which recently recruited more EAs in recent years will likely have relatively fewer highly engaged EAs. Indeed, in a regression analysis which we will present in a later post looking at engagement in EA, we did not find where EAs first heard to be a significant predictor of engagement levels. Nevertheless, we can still examine where highly engaged EAs have historically heard of EA.
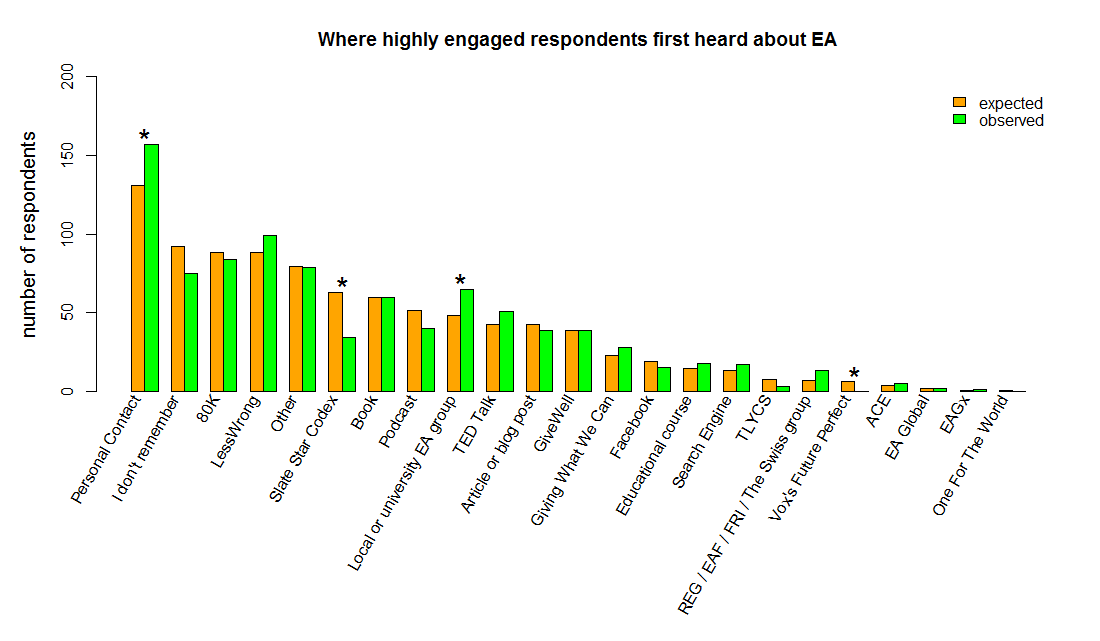
We find that significantly more highly engaged EAs first heard of EA from a Personal Contact (which is also the route through which the largest number of people heard of EA overall) as well as from Local Groups. Significantly fewer came from Slate Star Codex or Future Perfect. The confounding influence of time likely explains at least in part, why SlateStarCodex (which recruited almost all of the EAs in recent years) recruited a relatively smaller portion of highly engaged EAs and likewise 80,000 Hours’ total is likely suppressed due to this factor. Local Groups, in contrast, appear to have a disproportionately high number of highly engaged EAs having first heard about EA from them, perhaps due to local groups being a ‘high fidelity’ medium for people to engage with EA.
One thing to bear in mind, of course, is that this data is based on looking at the current number of highly engaged EAs who first heard about EA from each source. As such higher or lower numbers could reflect different numbers of EAs who have dropped out. It is hard to see why first hearing about EA from a given source would likely cause EAs who are higher or lower in engagement to drop out at different rates relative to other sources. It is also possible for differences to be driven by first hearing about EA from a given source causing EAs to become more engaged than EAs who first heard from another source who were otherwise equally likely to become engaged. Again, for the most part, it is hard to see why first hearing about EA from a given source would likely influence how engaged EAs go on to be among those who continue to be involved in EA. But in the case of local groups specifically, there is a potential confounder: people who first hear about EA from a local group may be more likely to be in a local group and being in a local group might lead to you becoming more engaged. As such we cannot conclude that different recruitment sources are recruiting EAs who are more (apt to become more) engaged, but only that those current EAs who first hear about EA from a source are more likely to be highly engaged.
The graph below displays this data in another way, plotting the total number of highly engaged EAs who heard about EA from each source against the total number of EAs who first heard about each source.
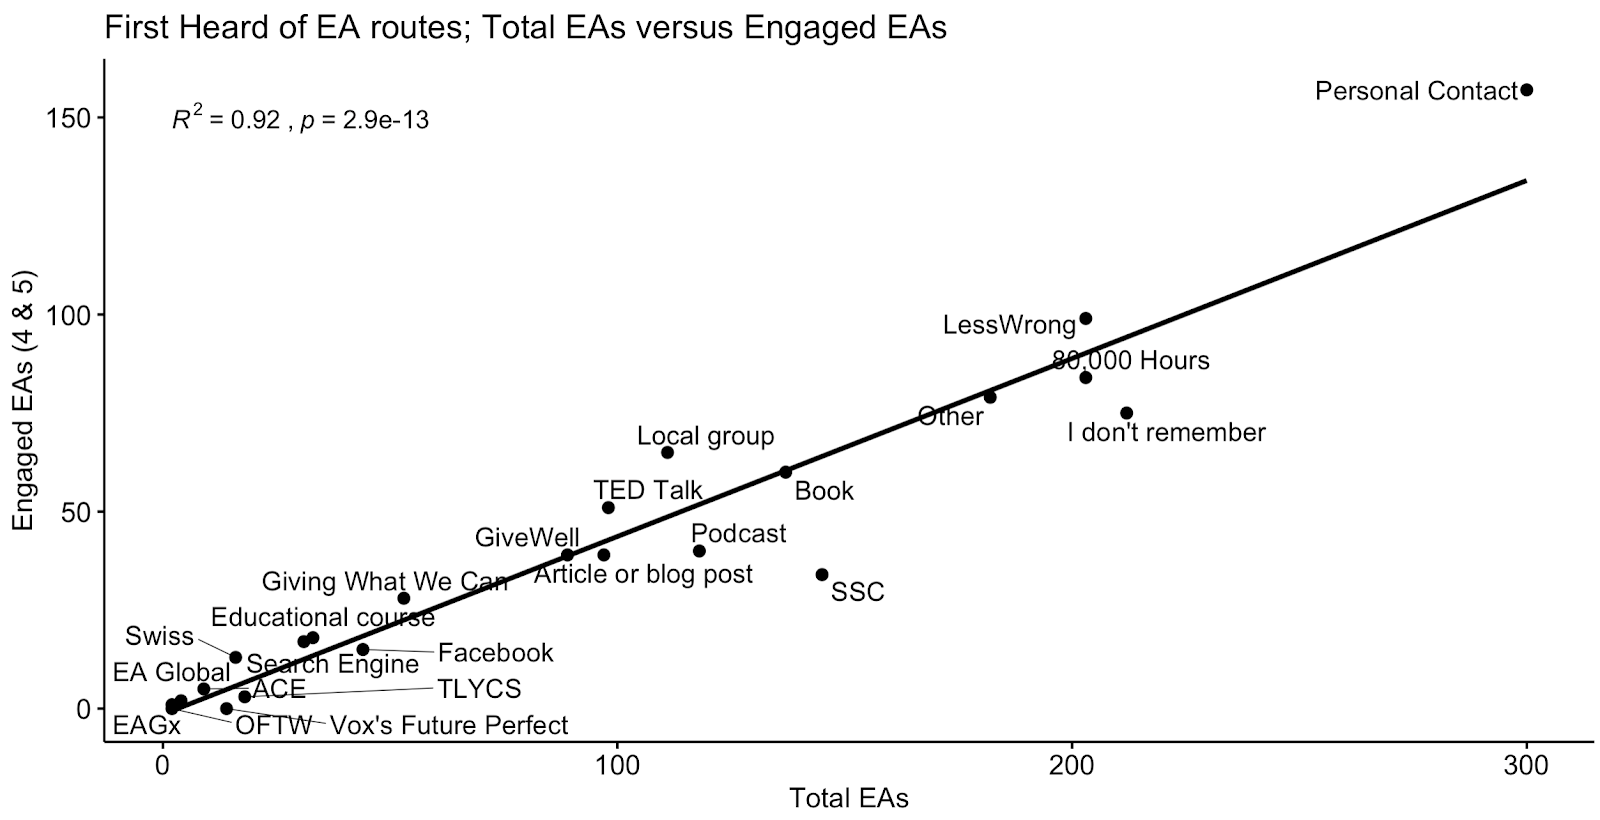
The absence of indications of substantial differences in engagement across different places where people might first hear of EA seems significant in light of the considerable attention that the EA community has placed on the importance of recruiting only people who will engage deeply with EA, rather than recruiting a larger number of people who engage with it more shallowly. These analyses suggest that there is little difference between the different routes in terms of the proportion of highly engaged EAs they recruit, with most routes recruiting highly engaged EAs roughly in line with the total numbers of EAs they recruit. This at least suggests that no particular routes are flooding EA with a disproportionate number of individuals who do not engage deeply with EA (although it is technically possible that low engagement EAs could be being recruited to EA and then quickly dropping out before showing up in the EA Survey, it would be surprising if there were no signs of this in the EA Survey, since we tend to see a large number of new <1year recruits in our samples). Of course this cannot tell us that if different means of recruiting EA were to be scaled up to try to recruit more individuals, this would lead to a proportionately higher number of highly engaged EAs being recruited. It seems likely that scaling up outreach, in many circumstances, would eventually lead to lower proportions of highly engaged EAs being recruited. For example, if EAs made a concerted effort to recruit more personal contacts towards EA, it seems plausible they would first approach those who seem most promising and might increase the number of highly engaged EAs in EA, but eventually would only be able to seek to recruit people with lower and lower inclination to engage with EA.
Although this could be taken to suggest that the EA community could (and perhaps should) engage in more aggressive outreach, rather than only focusing on more niche high fidelity sources, there is also arguably contrary evidence. Looking at the absolute number of EAs recruited (both high and low in engagement) we can see that routes into EAs which we might associate with more ‘mass outreach’ (e.g. Future Perfect) are associated with almost no people being recruited to EA. That said, what lessons you draw from this depends crucially on what outreach methods one considers mass or popular outreach or low or high fidelity. For example, one might think 80,000 Hours, given its podcast, and podcasts in general, could be considered forms of mass outreach. Therefore, drawing such conclusion requires considering what you think explains why certain outreach methods were successful or not, which is beyond the scope of this post.
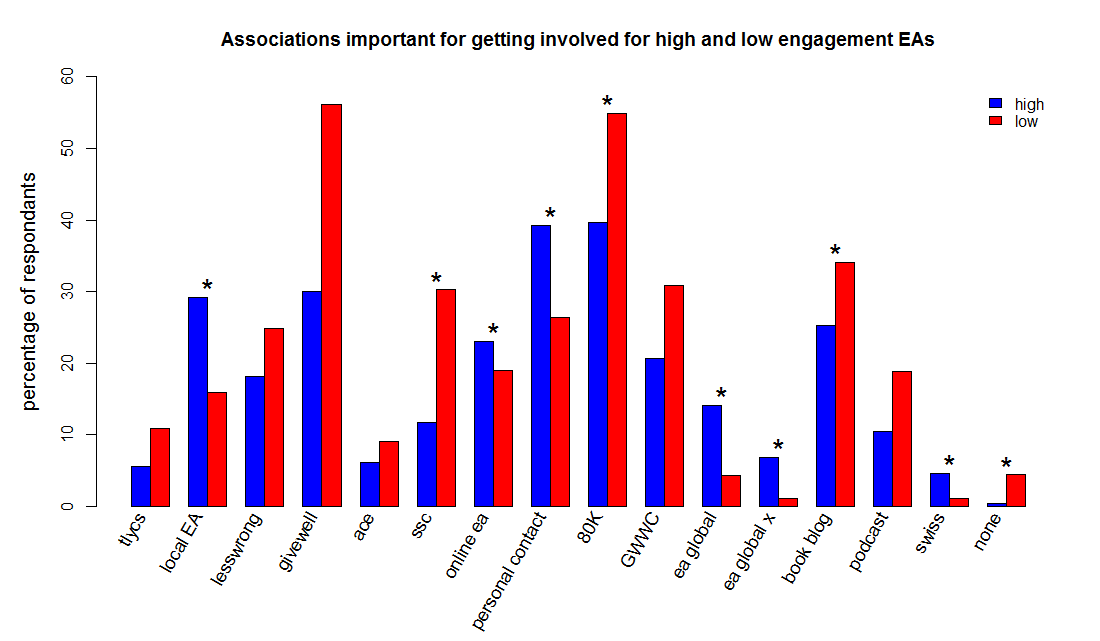
We also examined whether there were differences in what low vs high engagement EAs indicated was important for their getting involved in EA. Note that this could also reflect the influence of EAs in these groups having been in EA for different numbers of years. Some of this may also be explained by selection effects (e.g. only more engaged EAs get to attend EAG, while newer EAs are more likely to have only encountered EA through a book or article. We find that personal contacts, local groups, the online EA community, EAF/REG, EAG and EAGx were more often selected by highly engaged EAs, whereas 80K, SSC and book/article/blog were more often selected by less engaged EAs.
Examining the proportions of respondents from different genders first hearing about EA from different routes could offer an important source of information about reasons for the particular gender balance that we see in EA. For example, if a particularly high number of EAs were recruited from LessWrong and LessWrong is disproportionately male, this might partly explain there being a high number of men in EA. Similarly a particularly uneven proportion of genders coming from a particular route might highlight certain problems with recruitment via this route, or conversely a higher percentage of women finding EA through a certain source might point to which strategies would be promising if we aimed to recruit more women.
Some of the categories where people might first hear about EA had a very small number of respondents, which would preclude meaningful analysis of the gender differences in these categories. In order to run a chi squared test of association, we use a Monte-Carlo Simulation that produces a reference distribution, based on randomly generated samples which will have the same size as the tested sample, in order to compute p-values. The significance test consists of the comparison of the observed data with random samples generated.
The results of this chi squared test of association between gender (male, female)[7] and where people first heard of EA found a significant difference (x<sup>2</sup>= 119.07, p<0.0001, 1000 simulations). This suggests that gender and where people first heard about EA are not independent.[8] Of course, with so many categories it is hard to know from this test exactly which difference is driving this association.
The graph below shows the number of women that would be expected in each category (assuming that gender and the first heard categories were independent) and the number of women actually reporting to have first heard about EA in each category. Where the number observed is higher than the number expected if we assumed women were uniformly distributed across ways of hearing about EA, this means there are disproportionately more women than one would expect, and where the observed bar is lower than the expected bar, this means there are fewer women than you would expect. The number expected is based on the number of women and men across all categories, not an expectation that there would be an even number of women and men across all categories.
The graph shows the total number of women, not the percentages of women, in order to better illustrate where the numbers in some categories are exceptionally low. Bars are ordered by most women expected to least women expected (i.e. the largest to smallest categories overall).
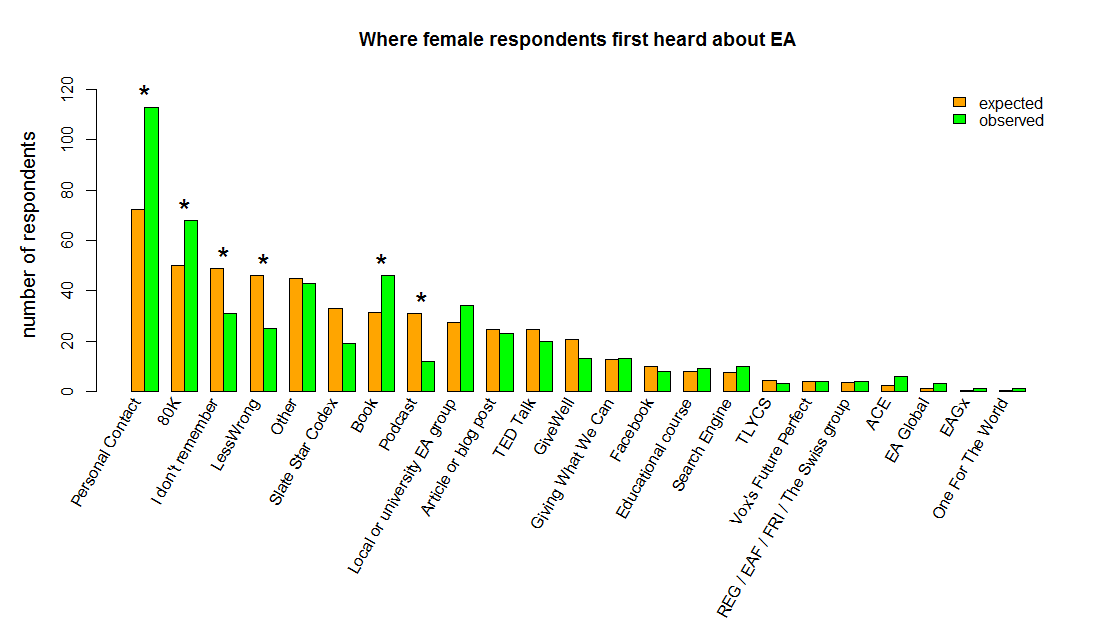
This graph shows that there are substantially higher number of women than one would expect who first hear about EA from a Personal Contact (43%), 80,000 Hours (37%), a Book (40%). In contrast, there are significantly fewer than expected in the LessWrong (15%) and Podcast (11%) categories.
A comparison of the percentage of women coming from LessWrong and SlateStarCodex to the proportions in their source populations is potentially instructive. The most recent SlateStarCodex survey found that only 11.1% of its respondents were female, whereas the most recent LessWrong survey (from 2016) found only 16% women (dropping ‘Other’ responses to allow comparison to our data above). As such, the proportion of EAs coming from these sources is roughly in line with what one might expect (and, in fact, there seem to be slightly more women coming from SlateStarCodex than one would expect). While the population of podcast listeners as a whole is apparently more gender-balanced (Weprin, 2019), the most commonly mentioned podcast, by a large margin, was Sam Harris’s. We do not have figures for the gender composition of his audience, he has reported that only 16% of his Twitter followers are women, which may go a long way to explaining these low numbers.
One question this might suggest is how different EA’s gender ratios might look overall if not for these specific recruitment sources not recruiting relatively higher numbers of men (not that we are suggesting that it would be better to turn away EA from these sources). Removing all respondents who heard about EA through LessWrong, SlateStarCodex or a podcast, the % of women in EA overall would only increase modestly to 31%, this is because, despite the observed differences, only a consistently small percentage of women appear to be recruited across almost all routes.
We also examined gender differences in responses to the question about which factors helped get people more involved in EA. In this case the ability of the same participant to select more than one type of involvement means that a classic chi-square test for independence cannot be completed (i.e., frequencies will sum to greater than one). Instead we used a bootstrap method to generate a probability distribution that accounted for subject dependence, and found that there was a significant difference in the pattern of choices for men and women (p<0.0005).
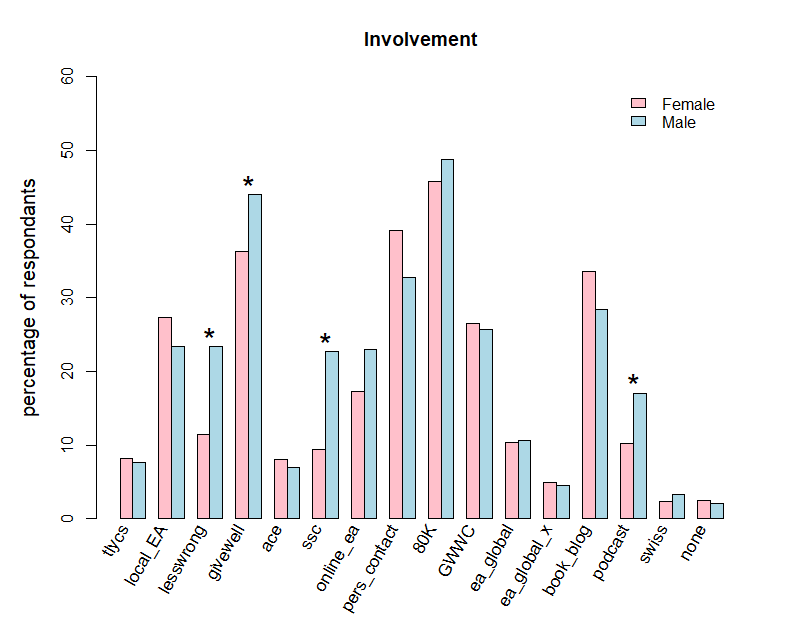
Note that online EA is not sig after Bonferroni adjustment (adjusted p=0.12), nor are personal contact or book blog (p=0.15 and p=0.49 respectively)
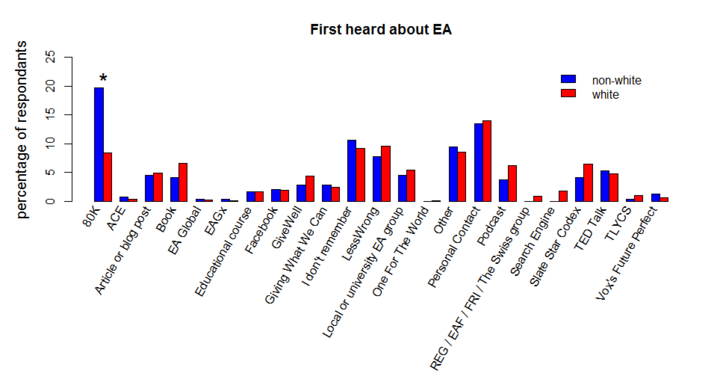
We also examined differences in where people first hear about EA across white and non-white respondents. As the question about race/ethnicity was multi-select, with small numbers for each individual category other than white, we examined a simple white (selected white) vs non-white (did not select white) binary variable. We then replicated these analyses using a ‘selected only white’ vs ‘selected something other than white’ variable and found a similar pattern of results.
As we can see from the graph below, the only clear difference across categories is that 80,000 Hours is associated with a higher percentage of non-white EAs.
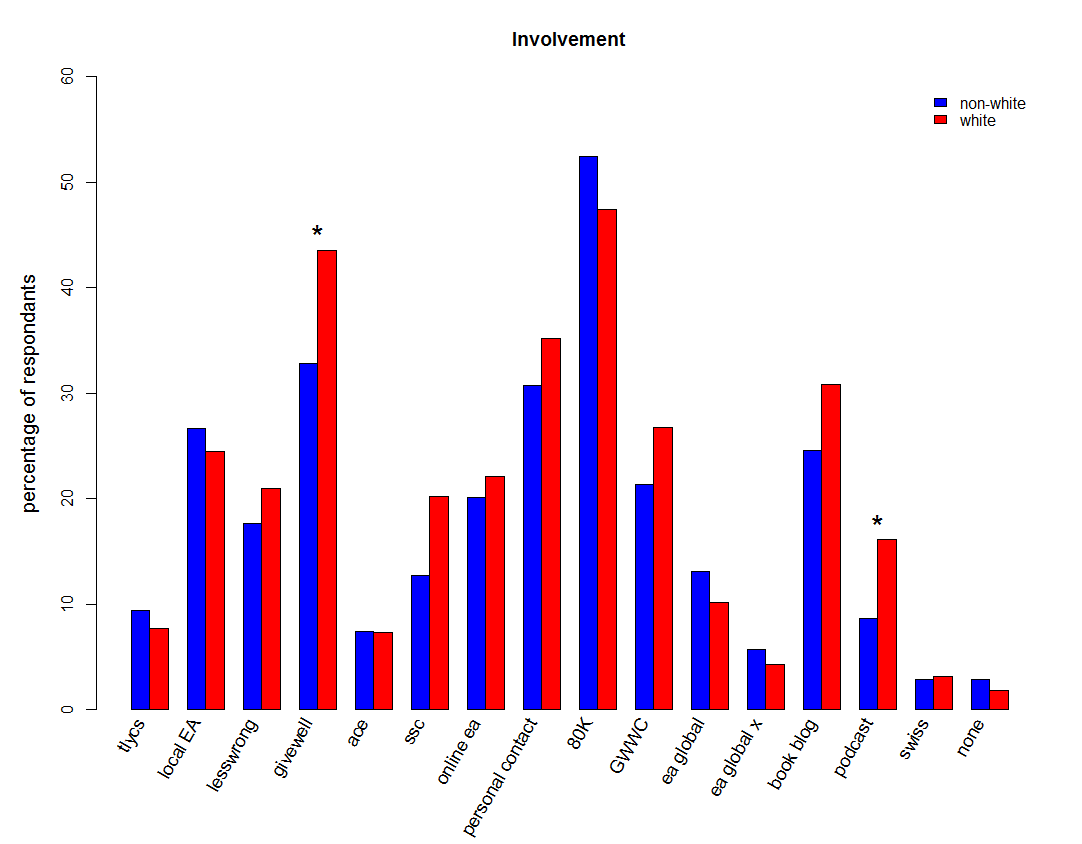
We then examined the numbers of white and non-white respondents selecting different factors as important for their involvement. Here we found significantly higher numbers of white respondents indicating that GiveWell and podcasts were important, but no other significant differences.
These results mostly show similar results to last year, along with continuing trends, where 80,000 Hours appears to be increasing in influence.
Our qualitative data also adds, for the first time, important new information about which specific podcasts, books, TED Talks etc. are leading people to EA, as well as more general information about how people first hear about EA. In particular, it emphasises that often multiple factors are involved in people first hearing about EA, with personal contacts being particularly common. We think more detailed qualitative research about how people become involved with EA could be useful, though this would fall beyond the scope of the EA Survey.
We also report, for the first time, data on the relationship between where people first hear about EA and gender and racial composition, which may warrant further consideration and research.
![]()
The annual EA Survey is a project of Rethink Charity with analysis and commentary from researchers at http://rethinkpriorities.org/. This essay was written by David Moss, with contributions from Kim Cuddington and Neil Dullaghan. Thanks to Aaron Gertler, Ben Todd, Peter Hurford, Daniela Waldhorn and Jason Schukraft for comments.
We would also like to express our appreciation to the Centre for Effective Altruism and the EA Meta Fund for supporting our work. Thanks also to everyone who took and shared the survey.
If you like our work, please consider subscribing to our newsletter. You can see all our work to date here.
Other articles in the EA Survey 2019 Series can be found here
This year we ran the same question described in the 2018 EA Survey. However, this year, we added ‘Podcasts’ and ‘Educational Course (e.g. lecture, class)’ due to their prevalence in 2018’s open comment responses. We also split out ‘Book’ and ‘Article or blog post’ from last year’s ‘Other (Book/article/blog post etc.)’ option, and dropped ‘Doing Good Better’ as a standalone book option. We also added ‘One For The World’ and ‘Vox’s Future Perfect’ as these were both new initiatives, with an outreach focus. ↩︎
Note that we would expect these results to be somewhat noisier in the earlier years, when relatively few respondents were recruited to EA. Ordinarily we would expect results from the year the survey was run to be somewhat less reliable, due to the EA Survey being distributed part way through the year. However, we would expect this to be relatively less of an issue for the 2019 survey, which was distributed relatively late into the year (September-October). We nevertheless tend to find substantially lower absolute numbers of respondents from the year the survey is run, perhaps because people who first heard of EA in the most recent year are less likely to have heard of and take the EA Survey. ↩︎
Simple content analysis was applied. Comments were coded for mentions of recurring categories, which were iteratively developed throughout the coding process. No actual comments from respondents are reported below, only schematic examples are given.
Comments could be coded as involving multiple categories. This could be because a comment mentioned more than one factor being involved together (e.g. “a friend [Personal contact] recommended a book [Book] to me”) or separately (e.g. “80,000 Hours and The Life You Can Save and also my local group”) or uncertain responses (e.g. “It was either LessWrong or SlateStarCodex”). We also coded simultaneously for superordinate and subordinate categories where the subordinate categories were particularly common (e.g. “I read Peter Singer’s, The Most Good You Can Do” [Singer; Book; The Most Good You Can Do]. As such, percentages across categories could sum to more than 100%, although more commonly they sum to far less than 100% due to some responses being uncodeable. Percentages reported are the percentages of comments which mention each category, not the percentages of codes assigned assigned to each category. To make the analysis more manageable we coded qualitative comments for each fixed response category (e.g. Personal Contact, LessWrong, Book) separately. As such, each analysis is more useful for understanding the responses within each category (which vary substantially in size) than for understanding the prevalence of different kinds of responses across the whole dataset. At a later date we may conduct a further analysis generating coding categories across the entire dataset. ↩︎
This diverges a little from the total number that selected each category, as people seemed more willing to write open comments for categories where this was fairly straightforward (e.g. book, podcast) than for other categories. ↩︎
In fact, the 80,000 Hours podcast was widely referenced in the open comments for a later question in the survey discussing factors that were important for retaining people within EA. This will be discussed in a later post. ↩︎
This engagement scale is described in more detail in our forthcoming post on engagement. Level 5 corresponds to the description “I am heavily involved in the effective altruism community, perhaps helping to lead an EA group or working at an EA-aligned organization. I make heavy use of the principles of effective altruism when I make decisions about my career or charitable donations” and level 4 to “I’ve engaged extensively with effective altruism content (e.g. attending an EA Global conference, applying for career coaching, or organizing an EA meetup). I often consider the principles of effective altruism when I make decisions about my career or charitable donations.” ↩︎
We used a binary gender variable, dropping “Other” responses, for these analyses because the very small number of “Other” responses (2% of responses) would preclude a meaningful analysis of differences across subgroups. ↩︎
The test results indicate that, if the null hypothesis of no difference is true, we have observed data that should be considered surprising. For example, a p-value of 0.01 means our data is in the top 1% of unusual results. ↩︎
Summary: I think the post mostly holds up. The post provided a number of significant, actionable findings, which have since been replicated in the most recent EA Survey and in OpenPhil’s report. We’ve also been able to extend the findings in a variety of ways since then. There was also one part of the post that I don’t think holds up, which I’ll discuss in more detail.
The post highlighted (among other things):
Implications
I think these findings have a lot of implications for the EA community. Many of them seem fairly obvious/straightforward implications of the data (i.e. which factors have or have not been important historically). This is not to imply that there aren’t important caveats and complications to the interpretation of this information, just that the direct implications of some of the results (e.g. a lot of people being recruited by 80,000 Hours compared to some other sources) are fairly straightforward. Important factors influencing the interpretation of this information would include methodological ones (e.g. whether the survey recruits more people from 80,000 Hours and this influences the result) and substantive ones about the community (e.g. how many resources are spent on or by 80,000 Hours, what is the average impact of people recruited from different sources (which is indirectly addressed by the data itself). In the main EA Survey posts we consciously err on the side of not stating some of these implications, aiming instead to to present the data neutrally and let it speak for itself. I think something important would be lost if the EA Survey series lost this neutrality (i.e. if it came to be associated with advocating for a particular policy, then people who disagreed with this policy might be less likely to take/trust the EA Survey), but this is definitely not without its costs (and it also relies on an assumption that other movement builders are working to draw out these implications).
One area where we discussed the possible implications of the results more than usual, while still holding back from making any specific policy proposals, is the finding that there seemed to be relatively little difference in the average engagement of EAs who first heard of EA from different sources. One might expect that certain sources would recruit a much larger proportion of highly engaged EAs than others, such that, even though some sources recruit a larger total number of EAs others recruit a larger number of highly engaged EAs. One might even speculate that the number of EAs recruited and the proportion of highly engaged EAs recruited would be negatively correlated, if one supposes either that broader outreach leads to less highly engaged recruits (on average) or that all diminishing returns mean that later recruits from a source tend to be less engaged than the ‘low hanging fruit’.
I think the 2019 EA Survey results (and likewise the 2018 and 2020 results) present evidence suggesting that there are not particularly large differences between recruitment routes in this regard. This is suggested by the analysis showing that there were a small number of significant, but slight, differences in the proportion low/high engagement EAs recruited from different sources. To give a sense of the magnitude of the differences: there were 164 highly engaged who first heard about EA from a personal contact, whereas we would expect only 151 if there were no difference in engagement across different routes into EA (a difference of 13 people).
Although I think the substantive conclusion stands up, one aspect of the presentation which I would change is the graph below:
This was an indirect replication of a graph we included in 2018. This offers a neat, simple visual representation of the relationship between the number of total EAs and number of highly engaged EAs recruited from each source, but it risks being misleading because the two variables (total EAs recruited and highly engaged EAs recruited) are not independent (the total includes the highly engaged EAs). As such, we’d expect there to be some correlation between the two, simply in virtue of this fact (how much depends, inter alia, on how many highly engaged EAs there are in the total population).
As it happens, when we repeated the analysis looking at the relationship between the number of low engagement EAs and the number of highly engaged EAs independently (which I think is a less intuitive thing to consider), we found a very similar pattern of results. Nevertheless, although the simplicity of this presentation is nice, I think it’s generally better to just not include any variants of this graph (and we dropped this graph from EAS 2020) and just include analyses of whether the proportion or average level of engagement varies across different recruitment sources. Unfortunately, I think these are less intuitive and less striking (see e.g. the models included here), so I do worry that they are less likely to inform decisions.
New findings since 2019
I think most of these findings have only gained further support through being replicated in our 2020 post.
Since 2019 these results have also been supported by OpenPhil’s 2020 survey of “a subset of people doing (or interested in) longtermist priority work”. OpenPhil found very similar patterns to the EA Survey 2019’s results despite using different categories and a different analysis (for one thing, OP’s allowed percentages to sum to more than 100% whereas ours did not).
In addition, part of this difference is likely explained by the fact that OP’s post compared their select highly engaged sample to the full EA Survey sample. If we limit our analysis to only self-reported very highly engaged EAs the gaps shrink further (i.e. highly engaged EAs were more likely to select personal contact and less likely to select SlateStarCodex.
Overall, I have been surprised by the extent to which OP’s highly impactful longtermist data aligns with the EA Survey data, when adjusting for relevant factors like engagement.