Vasco Grilo🔸
Bio
Participation4
I am a generalist quantitative researcher. I am open to volunteering and paid work. I welcome suggestions for posts. You can give me feedback here (anonymously or not).
How others can help me
I am open to volunteering and paid work (I usually ask for 20 $/h). I welcome suggestions for posts. You can give me feedback here (anonymously or not).
How I can help others
I can help with career advice, prioritisation, and quantitative analyses.
Posts 228
Comments2865
Topic contributions40
I would model the weights of the models as very wide distributions to represent very high model uncertainty.
In particular, I would model the weights of the stances as distributions instead of point estimates. As you note in the report, there was lots of variation across the 13 experts you surveyed
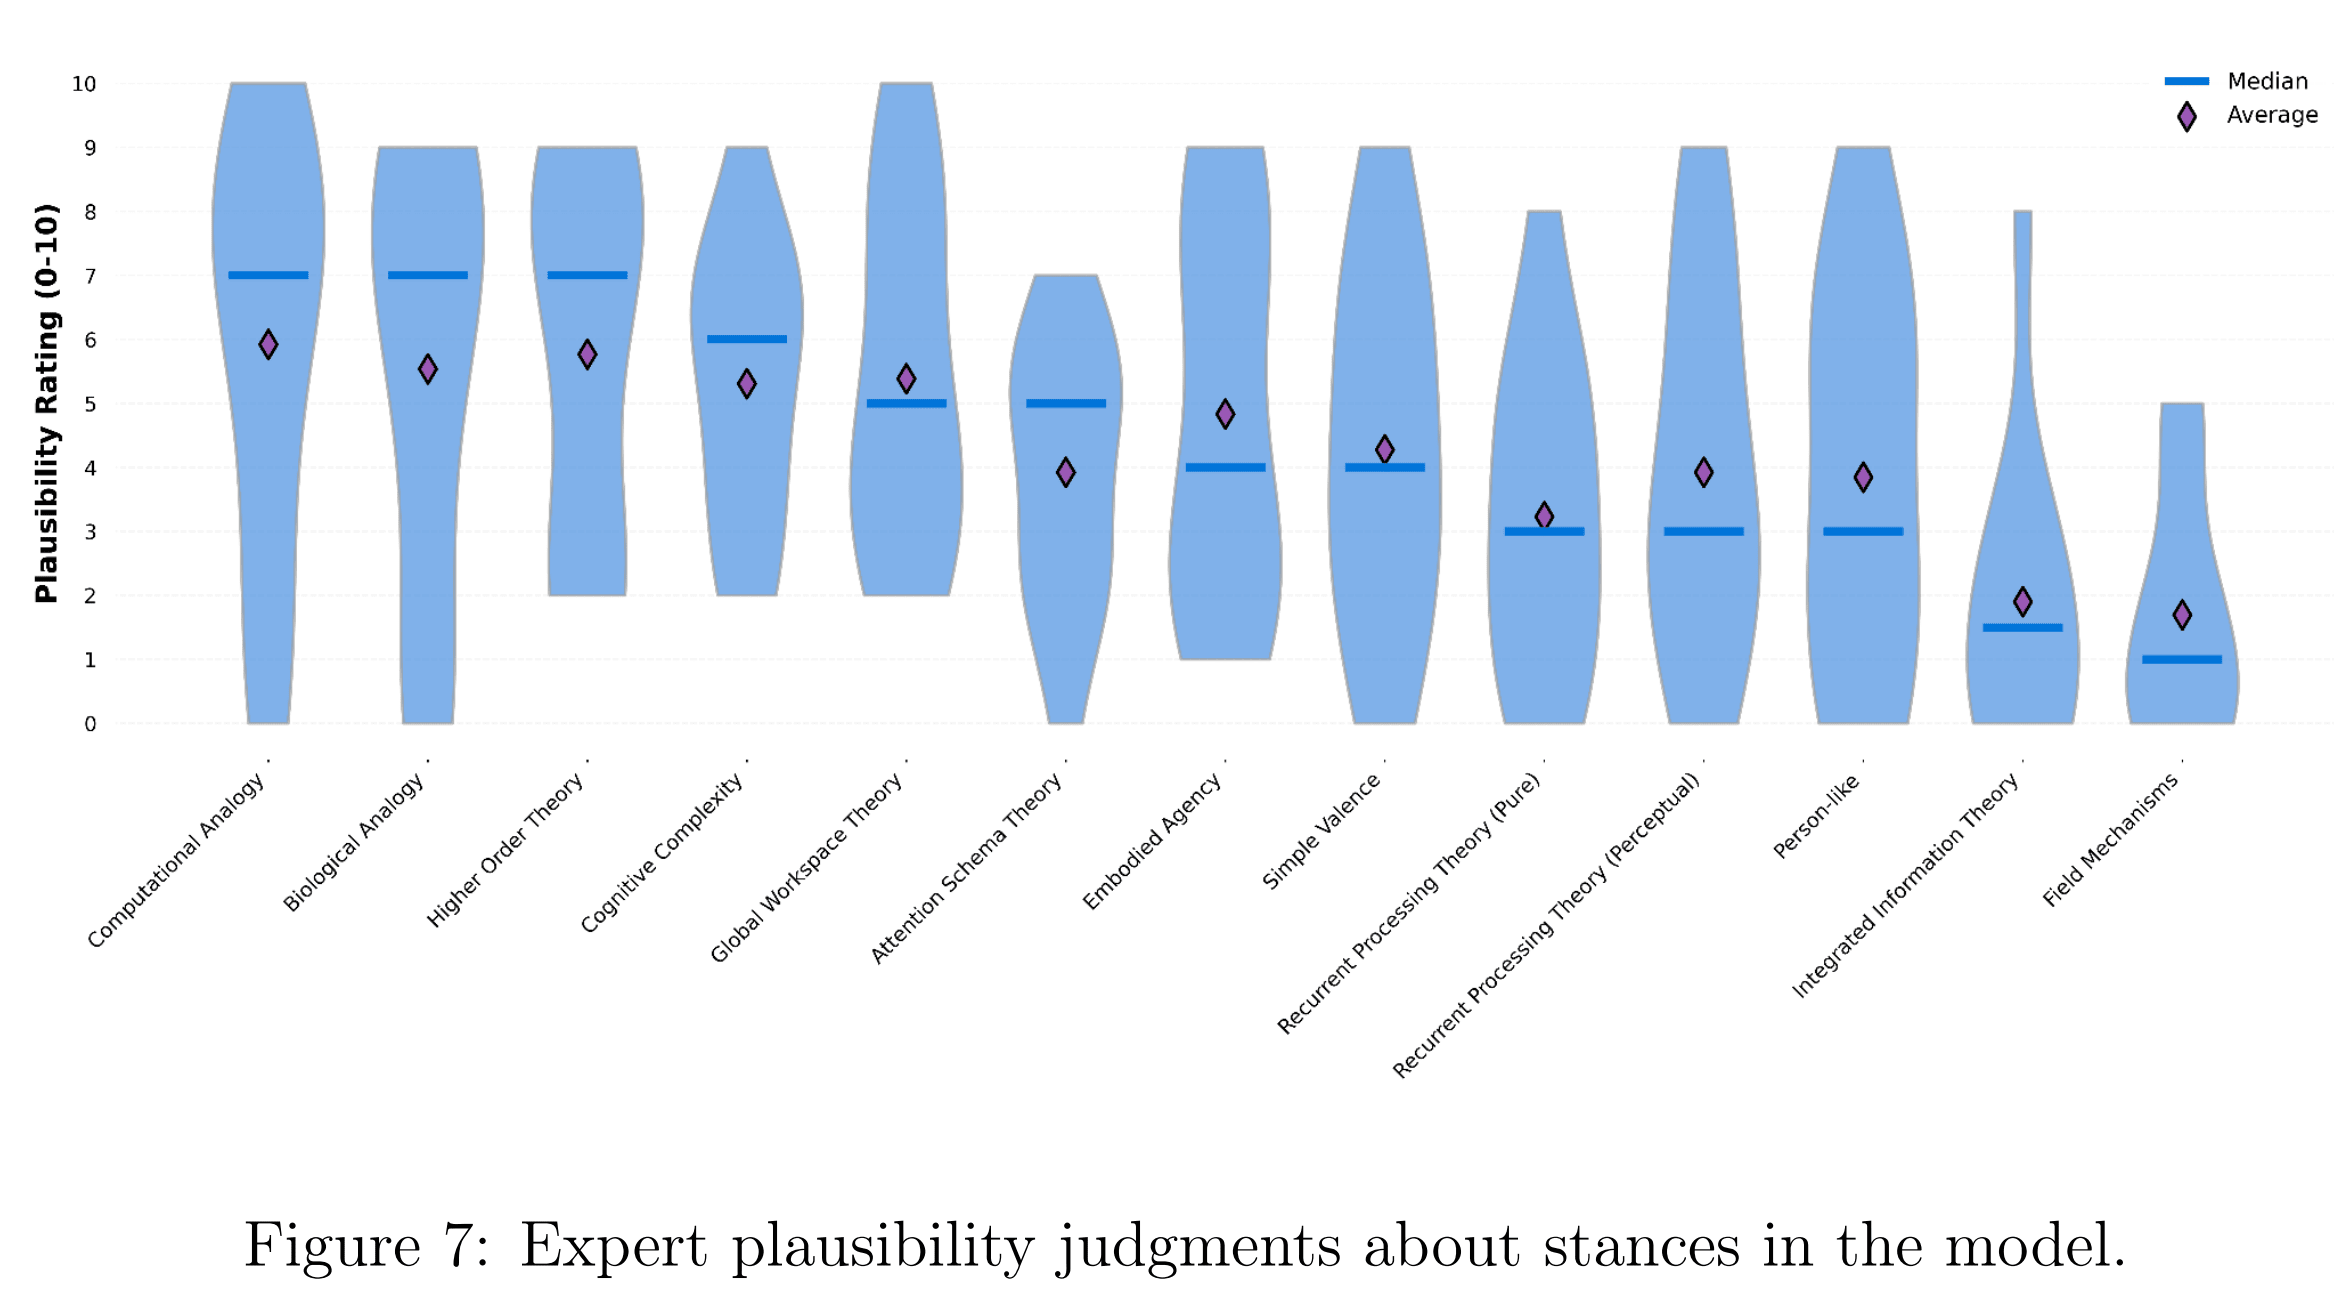
I wonder what exactly you asked the experts. I think the above would underestimate uncertainty if you just asked them to rate plausibility from 0 to 10, and there were experts reporting 0. Have you considered having a range of possible responses in a logarithmtic scale ranging from a weight/probability of e.g. 10^-6 to 1?
Thanks for sharing, Angelina.
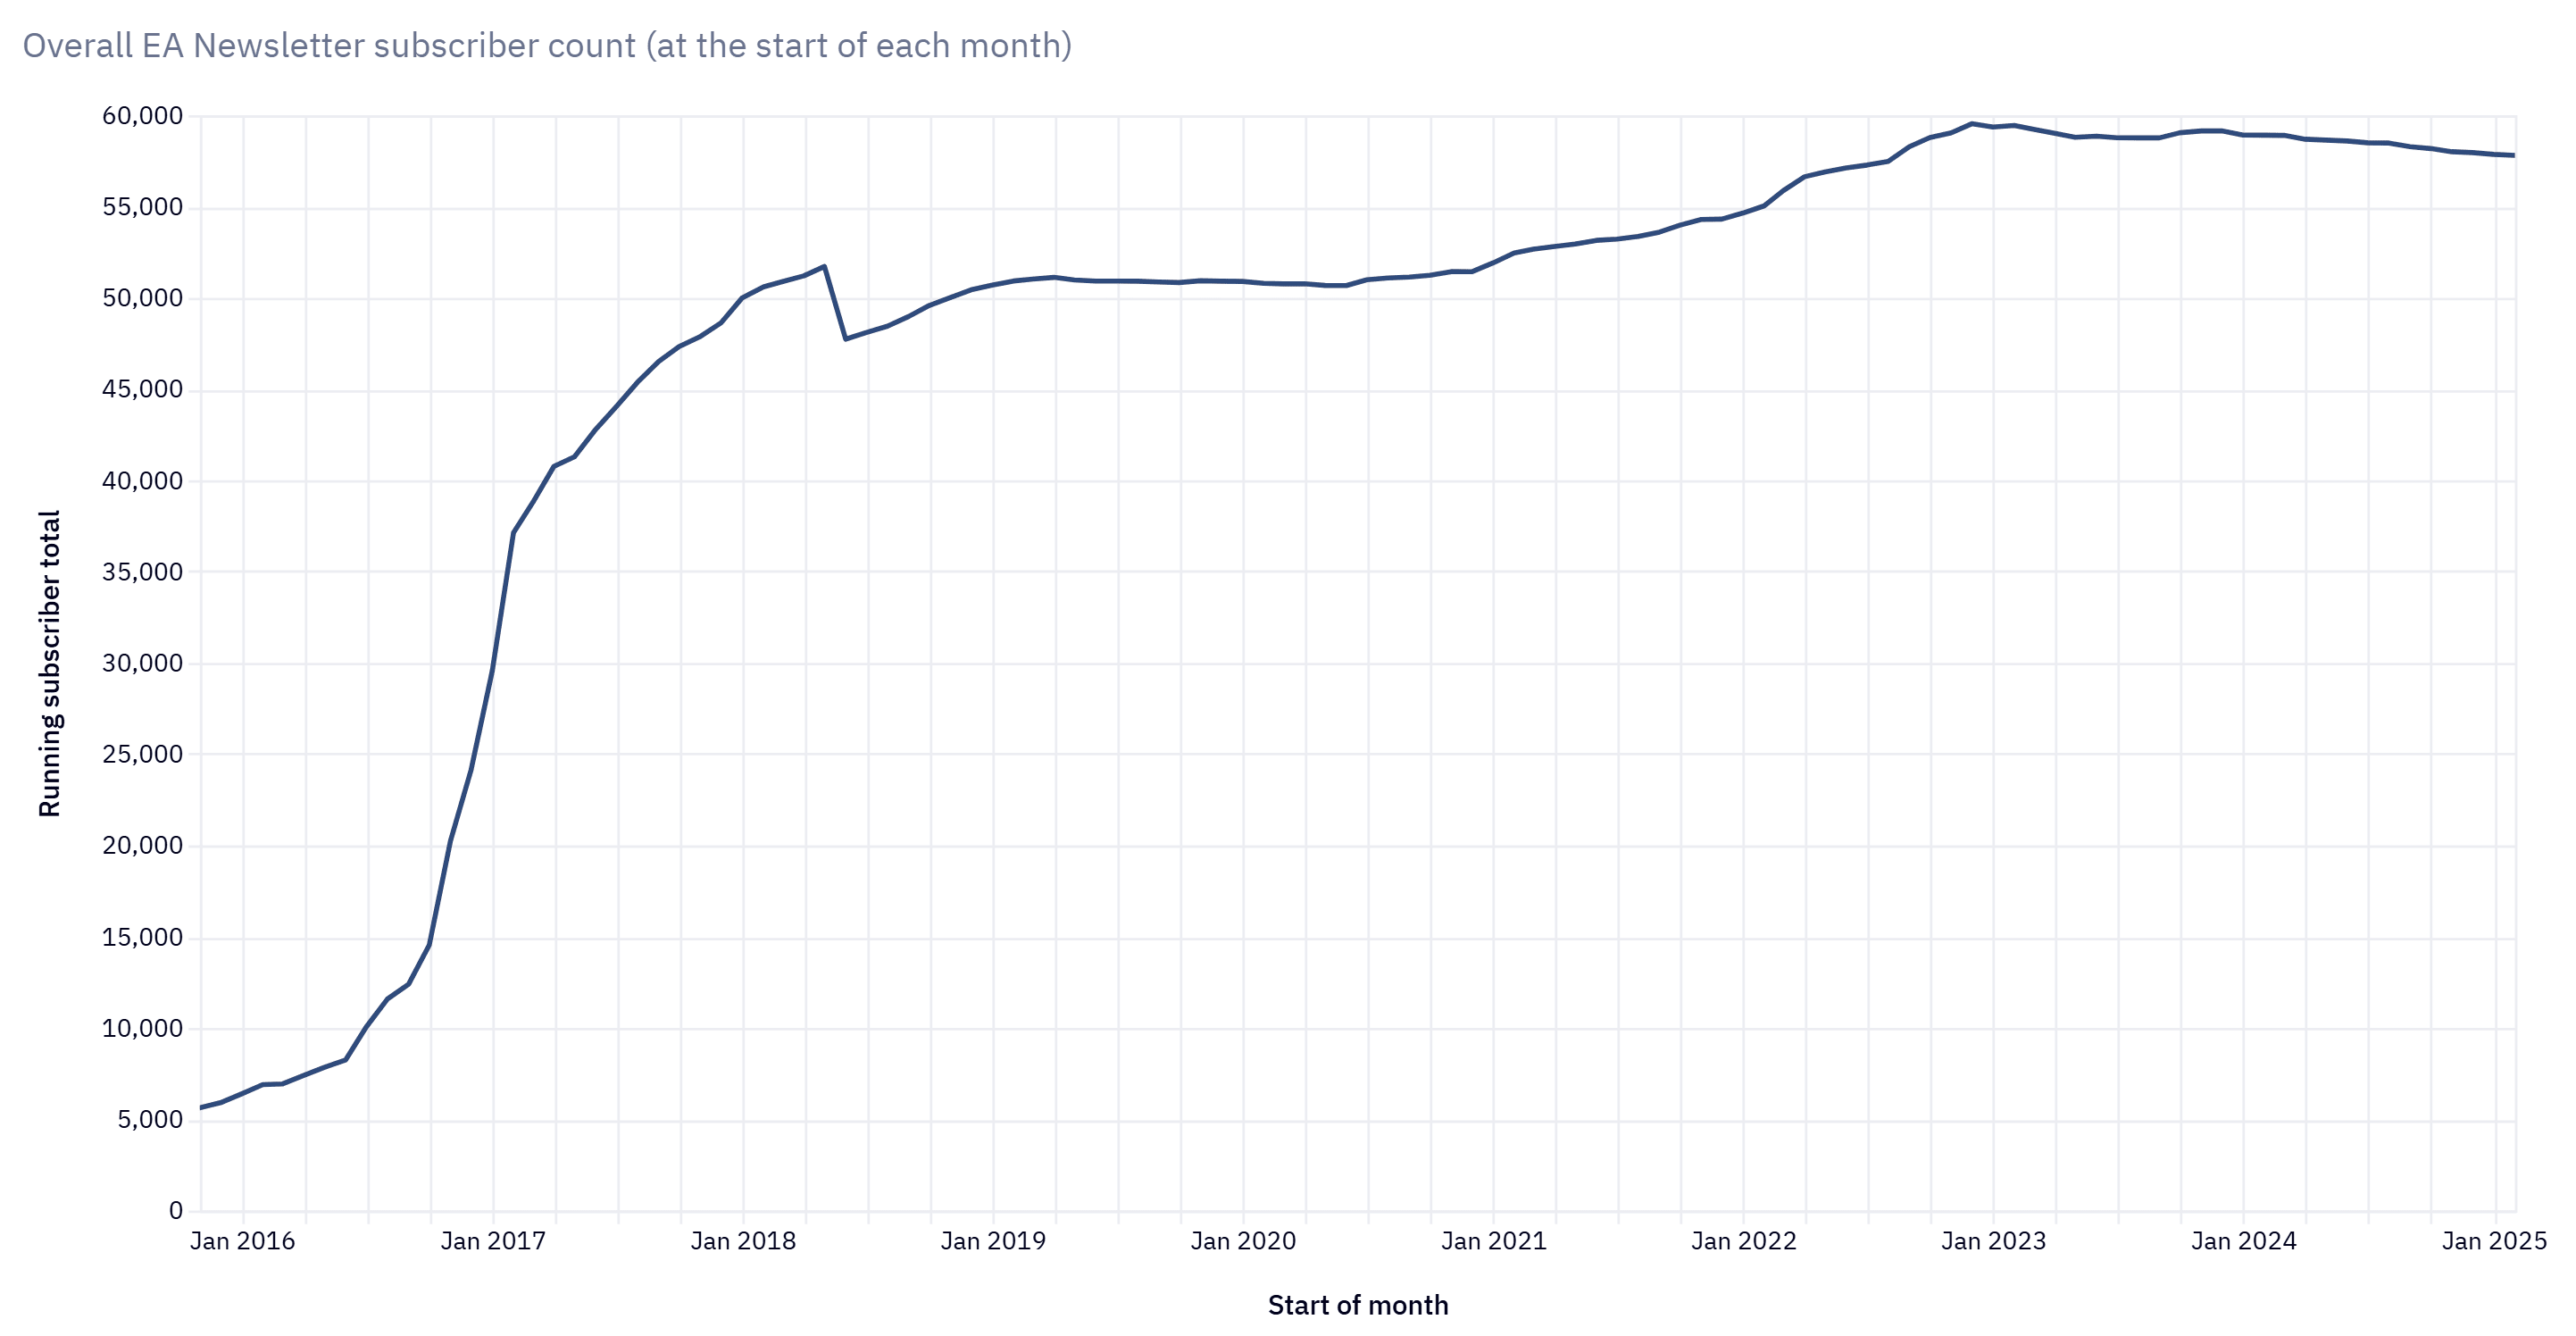
It is nice to see significant growth of the number of subscribers over 2025, especially considering the downwards trend over 2023 and 2024.
I agree "flow" metrics are a better proxy for current impact, and that the number of actively engaged subscribers is a better metric than the number of subscribers.
I like the dashboard because it is a way of quickly getting a rough sense of the impact of CEA's programs. The number of people engaging in each tier may well track progress better, but they cannot be so easily interpreted as concrete metrics like the number of subscribers of the EA newsletter.
I think it would also be helpful to see the number of people engaging in each tier across time. There are numbers in the post for 2024 and 2025, and the numbers for 2025 were better than for 2023 ("reversing the moderate decreases in engagement with our programs throughout 2023-2024"). However, the meaning of this depends on the stability of past trends. Many past annual changes in engagement up or down of 10 % to 20 % would make a 25 % increase from 2024 to 2025 less impressive relative to a past downwards trend of a few years.
Thanks for the update.
Have you considered assessing your impact in terms of changing careers and increasing funding?
How did the number of subscribers of the EA newsletter change over 2025? CEA's dashboard only shows data up to February 2025.
Thanks for sharing.
Infected animals experience excruciating pain, stop eating, and die slowly over days to weeks.
Do you mean excruciating pain as defined by the Welfare Footprint Institute (WFI)? In this case, excruciating pain is "not normally tolerated even if only for a few seconds". Here is the clarification of what this means from Cynthia Schuck, WFI's scientific director.
By not tolerated we mean that Excruciating pain can't be sustained for long (e.g., hours, as opposed to minutes) without neurological shutdown. It will tend to overrides an organism's ability to function or respond coherently, with even powerful opioids providing minimal relief, or desperate attempts to escape pain even at the risk of death . Examples would include severe burning in large areas of the body, dismemberment, or extreme torture.
Thanks for clarifying, Arvo.
I wonder how people decided between a plausibility of 0/10 and 1/10. It could be that people picked 0 for a plausibility lower than 0.5/10, or that they interpreted it as almost impossible, and therefore sometimes picked 1/10 even for a plausibility lower than 0.5/10. A logarithmic scale would allow experts to specify plausibilities much lower than 1/10 (e.g. 10^-6/10) without having to pick 0, although I do not know whether they would actually pick such values.
Yes, this is what I had in mind. Denoting by W_i and P_i the distributions for the weight and probability of consciousness for stance i, I would calculate the final distribution for the probability of consciousness from (W_1*P_1 + W_2*P_2 + ... W_13*P_13)/(W_1 + W_2 + ... W_13).
I think the mean of the final distribution for the probability of consciousness would be very similar. However, the final distribution would be more spread out. I do not know how much more spread out it would be, but I agree it would help track uncertainty better.