I pretty much agree with your broad points. Some quick thoughts on each section from an "insider" point of view:
Short-term impacts of treatment: The problem with these studies is that they study "apps" as a category, but apps are 1. extremely different from one another and vary drastically in quality and 2. are constantly improving. The best apps are probably 10-100x better than the worst mental health apps. Also, functionality of the best apps today are very different than the best apps from a few years ago when these studies were run. In the future, they'll probably be even more different. I don't think we're close to peak mental health app effectiveness.
Self-guided app adherence: Apple actually has made benchmarks available! I can grab them for you. For health and fitness apps which rely on a subscription business model, here are the 25th / 50th / 75th percentiles.
Day 1: ~16% / ~25% / ~34% Day 7: ~3% / ~7% / ~13% Day 28: ~0.75% / ~2.5% / ~6%
Note: The exact percentages vary by a little bit depending on which week is selected.
User acquisition costs: I can confirm there are huge differences in cost per install between US iOS (in the range of $1-2 per install) vs low-income country Android ($0.02 - $0.10). Although of course, ads aren't the only way to get app downloads. Organic app downloads are $0.00!
Development costs: If you were to put us on your comparison, we'd be at 2 employees (my wife and I) @ ~8,000,000 downloads across all of our apps. I can confirm that service and hosting costs are basically negligible.
How to improve: I agree that marketing to low-CPI regions could be a great impact opportunity. I'm most excited about improving drop-off rates / effect sizes (two sides of the same coin). I can absolutely imagine a world where a self-guided mental health app is 10x more effective than the best one available now.
Again, great overview! Let me know if I can be helpful!
Short-term impacts: Mmm, this has made me realise I wasn’t explicit about the assumptions I made there—I should either make that effect size bound a bit wider or model it as an exponential (or possibly a beta). I think this CEA is best interpreted as ‘if you built an evidence-based product, what would its cost-effectiveness be?’ but even that should probably have a wider bound. And there’s the new update in Linardon et al. (2024) that will be worth incorporating.
Adherence: Thank you! That roughly tracks with the decay curves from SimilarWeb, which is good validation. Although you raise a good point—decay probably depends a lot on whether you’re feature-gating after a trial period or not. Do you have a ballpark for the ratio of installs to DAU?
CPI: Those are lower CPIs than the estimates I had—good to know! Are those on Facebook, Tik Tok, elsewhere? I was also assuming organic traffic is negligible after the first hundred thousand or so, but do you still see an effect there?
Dev costs: Lovely! Having worked in industry, I definitely have the sense that there are good incentive reasons why headcounts might be unnecessarily bloated 🙃
Opportunities: I won’t ask what your roadmap looks like, but it’s very promising that you have this hunch. In my own experience as a user, I can definitely concur.
I’ll mull for a bit and update the OP with some adjustments. I might also shoot you a DM with some curiosity questions later. Thank you again! 😍
Ratio of Installs to DAU: Hmm, that's an interesting metric...the way I think about retention is like a layered cake, kind of like the baumkuchen I just ate for breakfast, but linear instead of round. Anyways, there's time on the X axis and users on the Y axis. For any given day, there's a sizeable layer of cream at the top which are the Day 0 users. And then right below that, a smaller layer of Day 1 users, etc. etc. Ultimately there are hundreds of layers of users from older daily cohorts. You can track each daily cohort through time and it'll start big and then shrink rapidly, following the retention curves, until eventually it flatlines at some point (ideally above 0).
So you could look at overall installs to DAU, but that gives an advantage to new apps because they don't have a lot of old installs from years-old cohorts that have left. Or you could compare daily installs to DAU, but that gives an advantage to old apps because they'll have a lot of users from old cohorts.
A better metric could be DAU / MAU ratio, which measures like out of all of your active users, how many of them use the app every day. Here ~25% would be exceptional with an average of probably around 10%. But that's also biased based on how many new users you're bringing in each day.
CPI: Yes, those numbers are from Facebook / Instagram / TikTok ads.
In terms of organic traffic, it's also a measure of time. Say for example you're bringing in 1000 organic users a day. After a year, that's 365k users. After 5 years that's 1.8M users. Of course, the app still has to remain good to continue getting organic downloads. Since the definition of good is always improving, the app would need to be consistently updated.
I'd say estimate around 2/3 of our lifetime installs are organic, but it really depends on the app. I speculate that Daylio might be closer to 100% organic while Breeze is probably closer to 0%.
Hmm—good points. Getting Installs/DAU wrong could meaningfully affect the numbers, I guess longer-term retention per install is probably a better way of accounting for it. It was unclear to me whether to model retention as having a zero or nonzero limiting value, which would change some of the calculations.
Improving organic install rate would be promising if you could get it above 50%, I think (your apps sound very effective!). I suspect a lot of that is, as you say, about consistently building a good user experience and continuing to add value. (I see a lot of Daylio users complaining about the lack of updates & the increased ad load.)
Welcome to the forum! Thanks so much for taking the time to dig into this question and sharing your findings. The treatment gap in global mental health is enormous and apps are an essential tool for addressing this challenge.
I didn't have time to review your calculations in detail, but I have a few general reflections that may be useful.
1) There is a brand new meta-analysis on the efficacy of mental health apps which includes 176 RCTS (Linardon et al, 2024). They conclude that "apps have overall small but significant effects on symptoms of depression and generalized anxiety, and that specific features of apps – such as CBT or mood monitoring features and chatbot technology – are associated with larger effect sizes."
2) There is a substantial difference in efficacy between self-help and guided self-help apps. Kaya Guides (incubated by Charity Entrepreneurship) is using WhatsApp to pilot the WHO's guided self-help intervention in India. Their founder wrote an excellent summary of their work here.
3) Be careful with using a single WELLBY number for AMF. The wellbeing effects of life-extending interventions vary widely depending on philosophical choices, so it is better to use the range of possible outcomes rather than a single figure (see The Elephant in the Bednet).
4) John Torous is a leading researcher and thought leader in digital mental health. If you'd like to spend more time learning about this topic, I recommend looking at his recent publications.
5) The current market for mental health apps is completely unregulated and there are major concerns about privacy and data protection. Wellcome recently awarded £1.8m to MHRA and NICE to explore how the market could be regulated more effectively to protect patient safety.
Thank you for finding that update to Linardon, that looks very useful & I can pretty easily incorporate it. Will do ASAP and update the OP.
Guided self-help is interesting, of course, as a related flavour. I am much less familiar with the mechanics and cost structures. I suppose I also have general moral qualms about interventions that rely on low-cost labour to reach cost-effectiveness, but that’s a post for another day.
Yep, aware of Elephant in the Bednet. I deliberately chose the highest estimate of cost-effectiveness I could find for steelpersoning purposes, but for just evaluating cost-effectiveness head-to-head it would be inappropriate.
Will go through Torous’ work—thank you for the recommendation!
Yeah, I am very concerned about that aspect of the current market and a few other papers I reviewed suggested numbers in the range of 30% of users made download decisions based on privacy. I think there’s a lot here!
Thank you again, particularly for the extra research directions. Will analyse further :)
Executive summary: Self-guided mental health apps like Headspace provide significant wellbeing improvements, but remain much less cost-effective than cash transfers due to high operating costs. Reducing these costs could make them competitive.
Key points:
Self-guided apps have a small effect size on depression/anxiety symptoms (0.15-0.31 SD).
This translates to ~0.21 WELLBYs per user at post-test, but few users continue long-term.
User acquisition and development costs are high, making them 1.5-12.7σ less cost-effective than cash transfers.
Reducing hiring needs and marketing to low-CPI regions could significantly improve cost-effectiveness.
Increasing retention rates and effect sizes would also help close the gap with cash transfers.
More research is needed, but there is potential for self-guided apps to become highly cost-effective.
This comment was auto-generated by the EA Forum Team. Feel free to point out issues with this summary by replying to the comment, andcontact us if you have feedback.
Self-guided mental health apps aren’t cost-effective… yet — EA Forum
Self-guided mental health apps aren’t cost-effective… yet
This is a crosspost from the new Animal Welfare Alignment Newsletter by Anima International. You can subscribe on Substack if you are interested in following these efforts. Audio reading also available on Substack.
The goals of this post are to:
1. Raise a question I see as crucially important to the goal of aligning AI to animal welfare...
Hello! I'm Justin Portela. I got hired by GWWC to make YouTube videos after AI in Context did such a kickass job.
My channel is using that same cinematic, high-production value beauty to talk about everything in the EA universe that isn't AI.
...
I used AI to fix transcription errors, rerrarange the ideas, and suggest tweaks to the title and some sentences.
Three of the most exciting projects to come out of EA in recent years are, in a vague sense, CEA spinouts:
* Kairos is directly a spinout of CEA and now handles most support for university AI safety groups. Basically everyone I've found who knows them is really excited about what they do
* NEST is an opinionated ideas-fi...
TL;DR: An app like Headspace does provide strong improvements on wellbeing, but remains ≥2σ below cash transfers due to high costs. Reducing those costs may bring mental health apps in line with cash transfers or group therapy. The linked Observable notebook allows you to interact with the estimates yourself.
Software provides enormous benefits to cost-effectiveness; there is zero marginal cost of supplying a software service to a new user (only acquisition costs). There are very few health interventions that have this property, as most health issues require physical treatment, usually from paid experts. As software has made content delivery orders of magnitude more cost-effective, it might also have this effect on non-physical health treatments.
I am interested in understanding if delivering fully self-guided, software-based mental health interventions might have a similar cost-effectiveness to GiveWell’s estimates for wellbeing improvements (selecting these because they’re a higher bar to clear than most other estimates of wellbeing improvement, and generally agreeable to the community).
I’m not interested in this being the most comprehensive CEA; this is purely exploratory, to diagnose whether this is an issue worth pursuing. I will usually try to underestimate benefits and overestimate costs throughout, and I’m only interested in getting within an order of magnitude or two of the most cost-effective interventions. The only way to really test these apps would be to run experiments in collaboration with them, which is much, much harder.
I’ll define ‘self-guided mental health app’ broadly, as anything vaguely intending (explicitly) to improve mental health, and self-guided as anything with zero 1:1 contact with other people to guide you (i.e. an app that provides a library of guided meditations is self-guided).
To estimate the cost-effectiveness, let’s break it down into:
What is the short-term impact of a short treatment course on mental health symptoms?
How does that impact translate to other measures?
How many users will continue to use an app in the long term?
What is the customer acquisition cost of such an app?
What is the development cost of such an app?
Prior Art
I’m extremely grateful to the long history of the mental health topic on this forum. I found 2 specific CEAs/discussions that focused on mental health app development:
Stan Pinsent & CEARCH’s analysis of self-administered psychotherapy: Finds a 12% chance of being as effective as a GiveWell top charity. I find a lower chance that existing apps are as effective, due to lower effect sizes for self-guided interventions (I think). We both agree that effectiveness is only achieved on the long tail and that our assumptions are shaky.
George Bridgwater & Charity Entrepreneurship’s 2-hour CEAs for promising mental health interventions: Specifically, they analyse guided self-help workbooks, gratitude journalling apps, apps for CBT, and apps for mundane, sub-optimal happiness. For a CBT app, they estimate lower retention, but lower cost-per-install, and achieve a much higher cost-effectiveness (possibly on the order of cash transfers or group therapy).
I wanted to dive deeper specifically on self-guided mental health. I hope also by including distributional estimates (which Pinsent does) that we can gain some clarity on where the uncertainty is, and what levels we can pull to increase effectiveness.
Short-term impacts of treatment
(We will focus specifically on depression as a health outcome. It is the largest mental health category by incidence and health burden, and the most studied. By narrowing in this way we can only serve to underestimate total impact; although, as below, self-guided app-based treatments for depression seemingly generalise to anxiety and vice-versa.)
Linardon et al. (2019) appears to be a very well-conducted, well-cited meta-analysis of RCTs of smartphone apps that aim to treat mental health conditions (a broad definition, but one which is sub-divided later in the analysis). Further research uncovered other meta-analyses, but this was more robust in all relevant aspects (comprehensiveness, bias/quality checks, etc.), which I hope excuses the singular focus on the study (ex. it specifically aimed to improve Firth et al. (2017) by including ~50 more RCTs).
They analysed 54 RCTs of apps that were measured against depressive symptoms and found a pooled standardized mean difference of 0.21–0.36. When adjusting for potential publication bias using trim-and-fill, the SMD increased to 0.32–0.49 (but only had data for 37 RCTs).
For anxiety, it was 0.20–0.40 (k = 39) and adjusted to 0.28–0.49 (k = 31)
For stress, it was 0.21–0.48 (k = 27) and adjusted to 0.30–0.57 (k = 22)
For quality of life, it was 0.29–0.42 (k = 43) and adjusted to 0.32–0.46 (k = 37)
There was no statistically significant difference between whether apps targeted depression or anxiety directly; they had comparable uplift effects on both measures regardless. This indicates we may be able to generalise between conditions, which seems to be supported by the similarity in effect sizes above.
Apps which included professional guidance had a larger depressive symptom SMD (0.34–0.62; k = 15) than those which didn’t (0.15–0.31; k = 37; difference Q = 0.002).
For anxiety, it was 0.36–0.70 with (k = 12), and 0.12–0.30 without (k = 27; difference Q = 0.001)
For stress, it was 0.35–0.79 with (k = 10), and 0.12–0.36 without (k = 17; difference Q = 0.010)
For quality of life, it was 0.39–0.64 with (k = 13), and 0.22–0.35 without (k = 30; difference Q = 0.001)
We don’t have adjusted SMD for the self-guided condition. However, since trim-and-fill only improved the SMD in the overall condition, we can be conservative and just use the direct values for self-guided interventions.
FWIW, I’ll display charts of some of my estimated distributions for each parameter with their code. This makes more sense in the original Observable notebook, but I hope they’re also generally clear here.
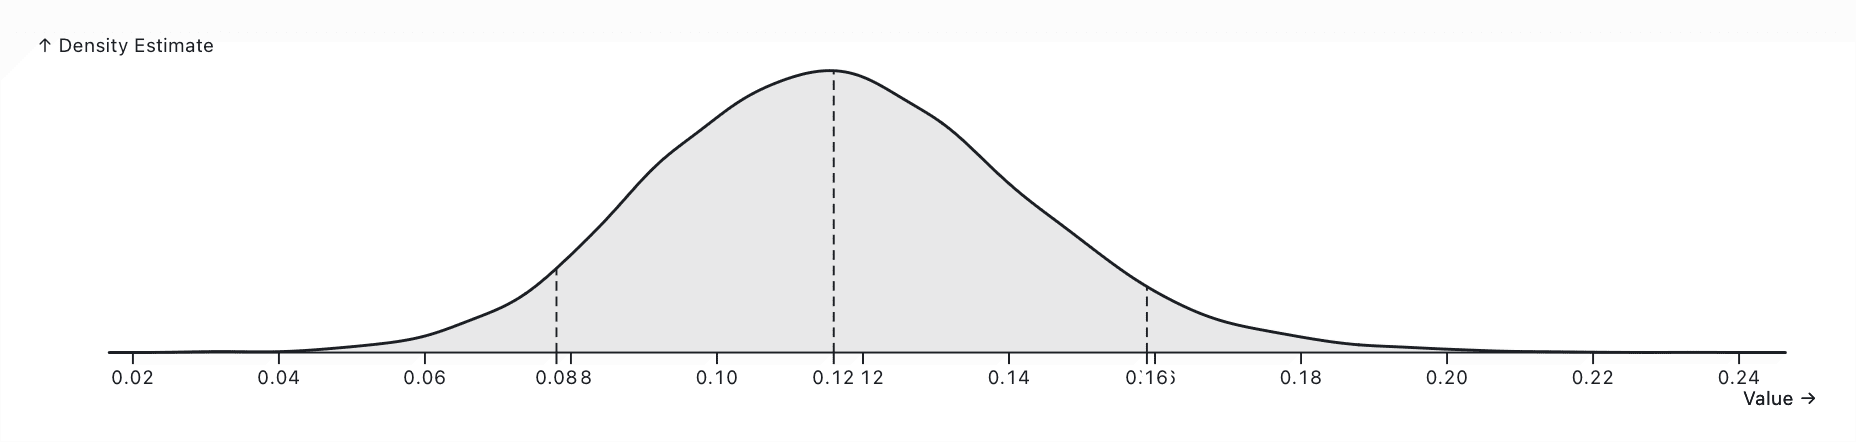
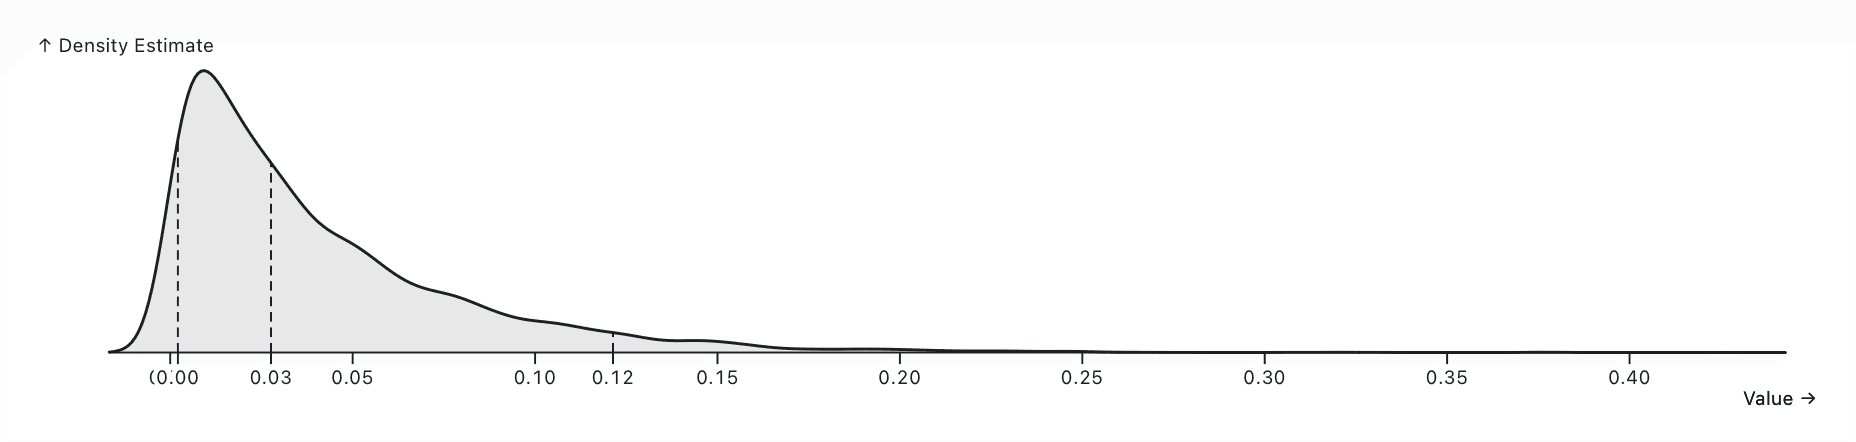
Estimated distribution of the SMD of a self-guided mental health app on depression (0.15–0.31)
GiveWell (2023) estimate the cost-effectiveness of direct cash transfers, group psychotherapy, and bednet distribution, providing us with a useful benchmark.
They apply the following discounts:
0.7–0.9 for study social desirability bias
0.75–0.9 for publication bias
0.7–0.85 for lower effectiveness at scale / outside trial contexts
A lower ‘effect multiplier’, which doesn’t directly apply to our analysis as it accounts for decay of effects over time (which we will do later with our own dropout analysis).
I believe it is reasonable that the first three multipliers have an effect here, so we can include them before making our comparison.
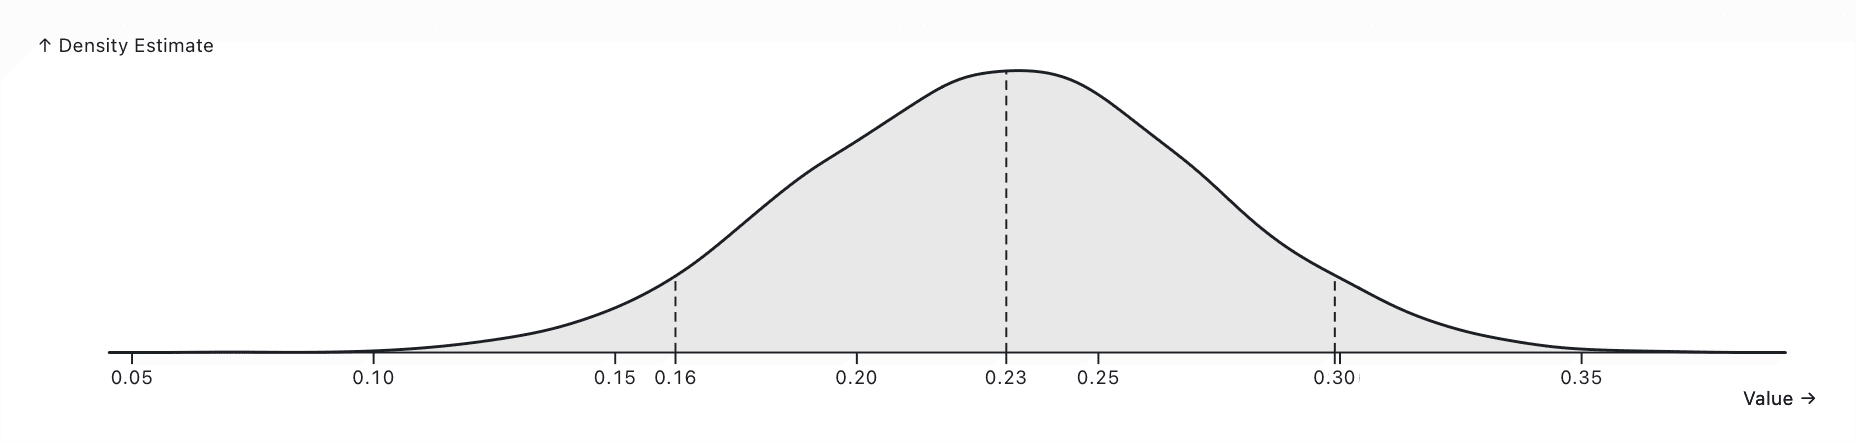
Estimated distribution of the SMD of a self-guided mental health app on depression, accounting for GiveWell’s discounts (0.08–0.16)
const selfGuidedDepressionSMDDiscounted = dist`${selfGuidedDepressionSMD} * (0.7 to 0.9) * (0.75 to 0.9) * (0.7 to 0.85)`
Translating impacts to life-satisfaction-point-years (WELLBYs)
Unfortunately, there isn’t much literature on the relationship between a standard-deviation improvement in depression symptoms and quality- or disability-adjust life years (QALYs/DALYs), which are an extremely well-studied measure of disease burden. The GBD’s calculations for these numbers are confusing at best.
Instead, WELLBYs are a somewhat standard measure that complement (QALYs/DALYs) in cost-effectiveness analyses. A treatment that improves a condition by one WELLBY increases the individual’s life satisfaction by a single point for the length of a year.
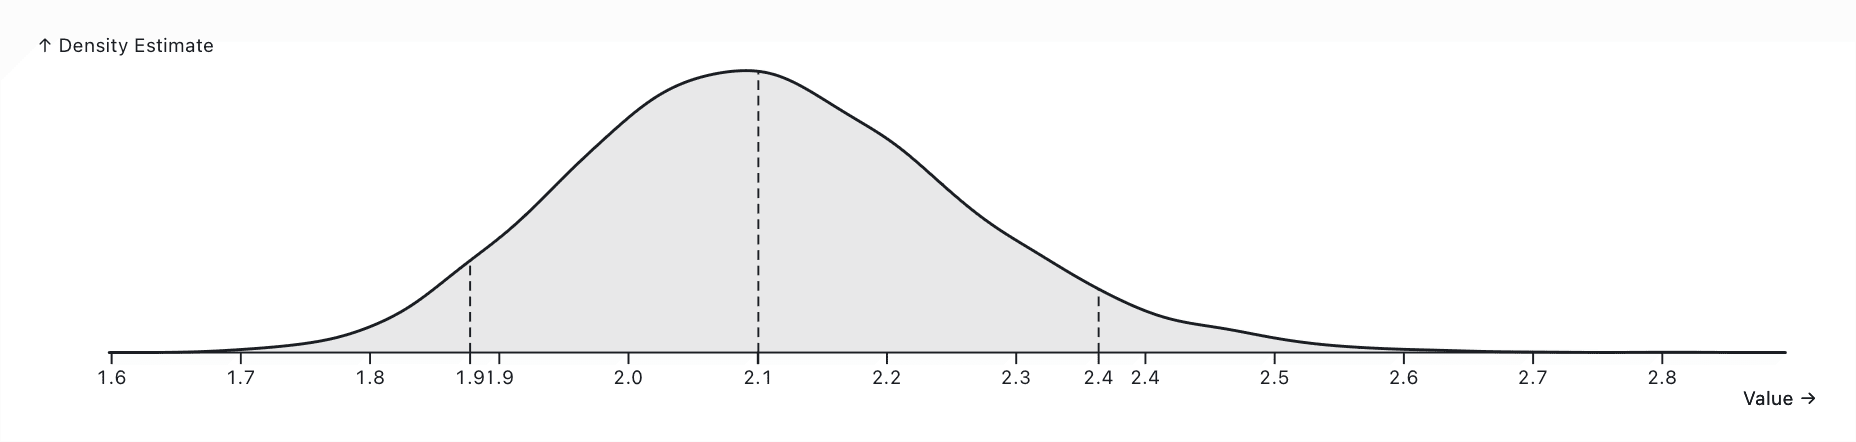
The best expert guess on the standard deviation of life satisfaction as a whole is about 2.108, which comes from this GiveWell analysis combining extensive satisfaction data from high-income countries with other surveys from low-income countries.
Estimated distribution of the standard deviation of life satisfaction (1.9–2.4)
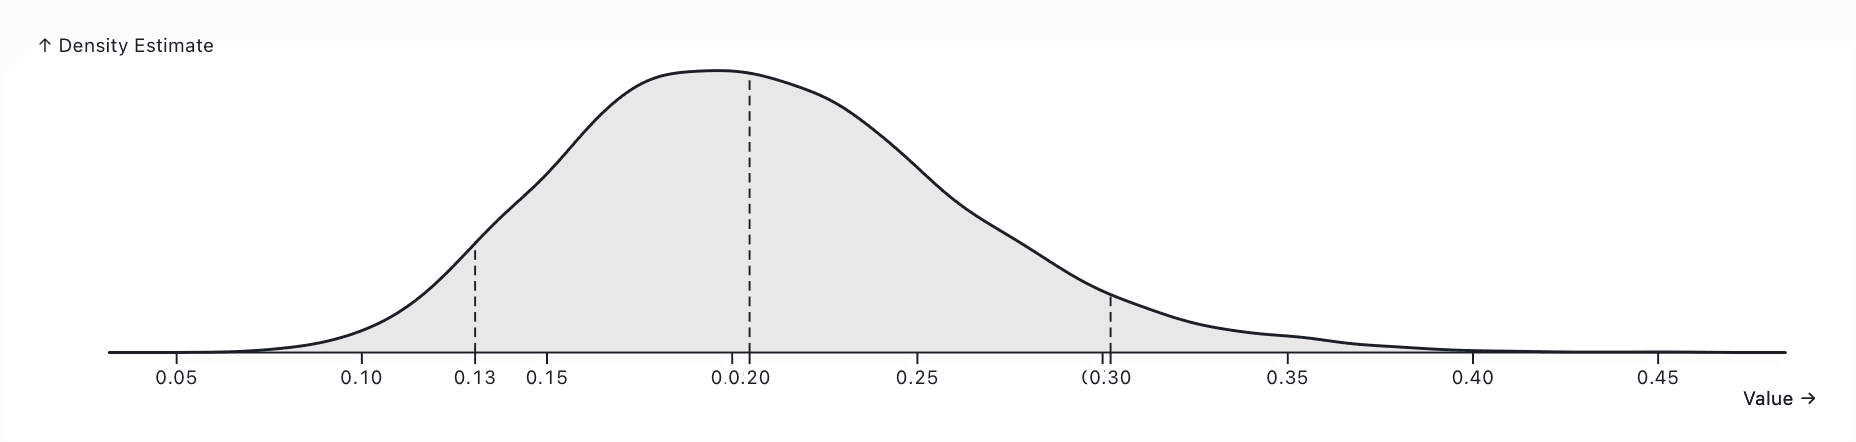
Finally, how should an standard-deviation decrease in depressive symptoms correspond to a standard-deviation increase in life satsifaction? It’s not clear that this is a 1:1 relationship. Plant & McGuire (2023) discuss possible discounts. We will make a conservative estimate of 0.7–1, as GiveWell do.
We can put these together to find an average value of 0.21 WELLBYs caused by using a self-guided mental health app consistently (at post-test).
Estimated distribution of the WELLBY increase of using a self-guided mental health app consistently
const selfGuidedWellby = dist`${selfGuidedDepressionSMDDiscounted} * ${expertLifeSatisfactionStdev} * (0.7 to 1)`
Our model doesn’t assume any ‘spillover’ effects. GiveWell strongly adjust them downward because they are very hard to estimate and there isn’t a lot of evidence for them. To save myself effort, I’ve omitted them entirely in the hopes that it will steelperson my argument a bit better; but even if we believe they’re significant I really doubt they will change the final order of magnitude of cost-effectiveness.
Self-guided app adherence
Under our model, the above WELLBYs are only achieved at post-test in studies that account for dropout rates. In reality, a huge proportion of users will pick up an app, use it a couple of times, and never open it again. The remainder tend to become long-term users.
Baumel et al. (2019) systemtically review Android mental health apps using SimilarWeb data, which have a 3.3% 30-day retention rate (IQR 6.2%)
Apptopia reports a 6.29% 30-day retention rate on health and fitness apps, with Headspace and Calm at 7.65% and 8.34%. They also noted top iOS apps tend to have a ~30% higher retention rate than top Android apps.
Forbes report Insight Timer has a 16% 30-day retention rate (via Apptopia)
(As an aside, a lot of this data is obtained through user deception and privacy violations. I did not pay for the pro versions of these products so that I could access more up-to-date information, at the risk of lower-quality data. There may also be a sampling bias inherent to this collection as some of the identified data collectors are wellness-focused apps such as screen time trackers.)
Baumel et al. (2019) also found full decay curves for apps across categories, and the daily percentage open rate for installations (calculated by dividing an estimate for total installs by daily active opens). For all mental health apps, this was 4.0% (IQR 4.7%), suggesting that this is approximately the limiting retention. This implication concurs with the decay curve plot from the paper, and our intuitions about habit-building (some number of users will reach a sort of ‘escape velocity’ and stick with the app for the long term).
Comparing Baumel et al. (2019)’s data against Apptopia’s, it seems wise to assume mental health apps have a lower retention rate than health & fitness overall. We should also increase the estimate slightly to account for iOS apps making a good share of total users.
A ~4.0% mean retention isn’t an awful guess, and we can then assume that a 99th-percentile retention would be Insight Timer’s 16% (evidenced by its newsworthiness). We should assume an exponential distribution; most apps should achieve no retention.
Estimated distribution of the proportion of downloads that use a mental health app daily (mean 4%)
In our model, we do not assume that continuing to use such an app has diminishing returns over time. Rather, continuing to use the app ‘tops up’ the effect, and neglecting to use it doesn’t have any meaningful decay rate. This is in line with other mental health interventions such as therapy or exercising, where continued use is required for the effect to continue.
We can now compute the number of WELLBYs per new user of the app.
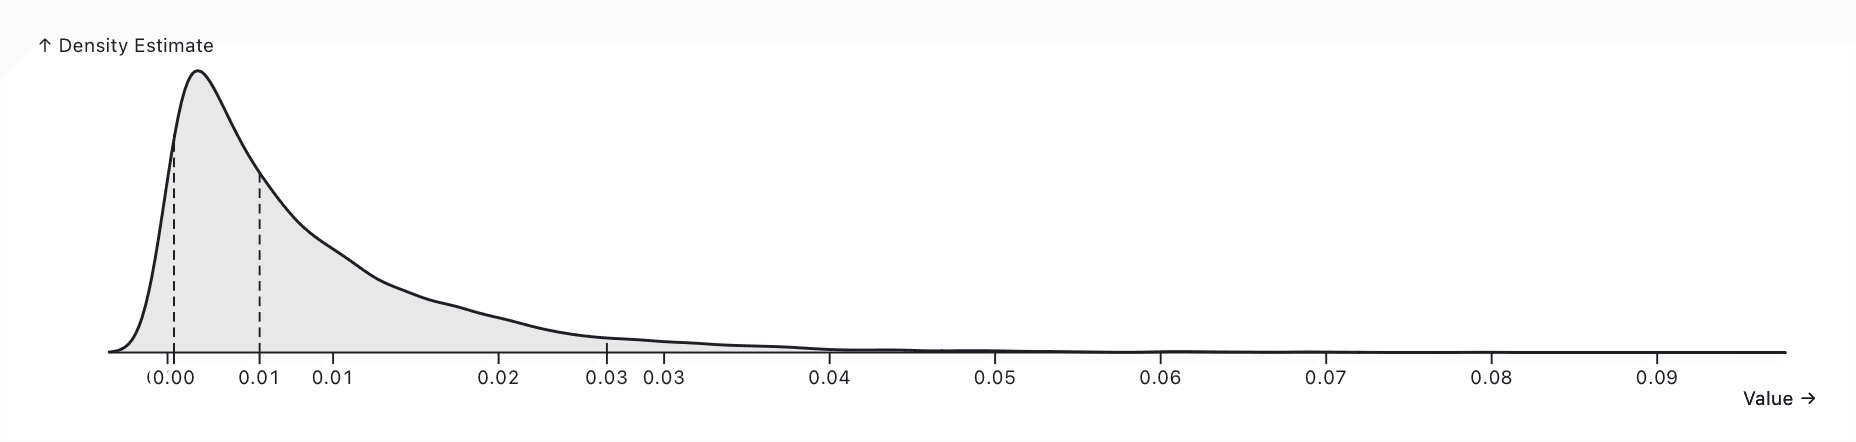
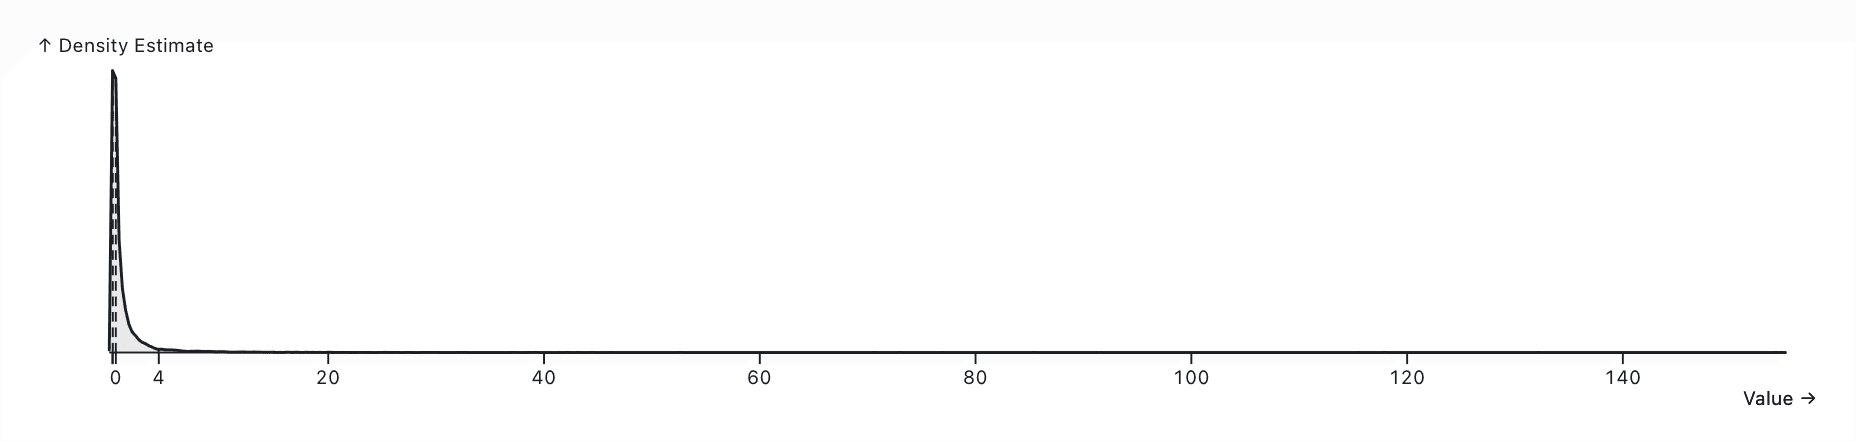
Estimated distribution of the number of WELLBYs created per new user of a mental health app (mean 0.005)
We are specifically interested in CPI (Cost Per Install). It’s hard to get good data on CPI, since most ad networks don’t publish it (and it obviously depends on a huge number of factors).
Skimming various other sources through search engines generally concurs with this
Notably, CPI is dramatically lower in poorer countries (less crowded markets with less potential ROI). It’s not clear what the CPI is for the health category. We can also note that Facebook and other ad networks provide extremely good optimisation tools that can even take a desired Return On Ad Spend (ROAS) and deliver as much breadth as possible.
All of this is to say that I am not confident we can produce a narrower estimate without empirically verifying this with data from a real app in our exact category and market.
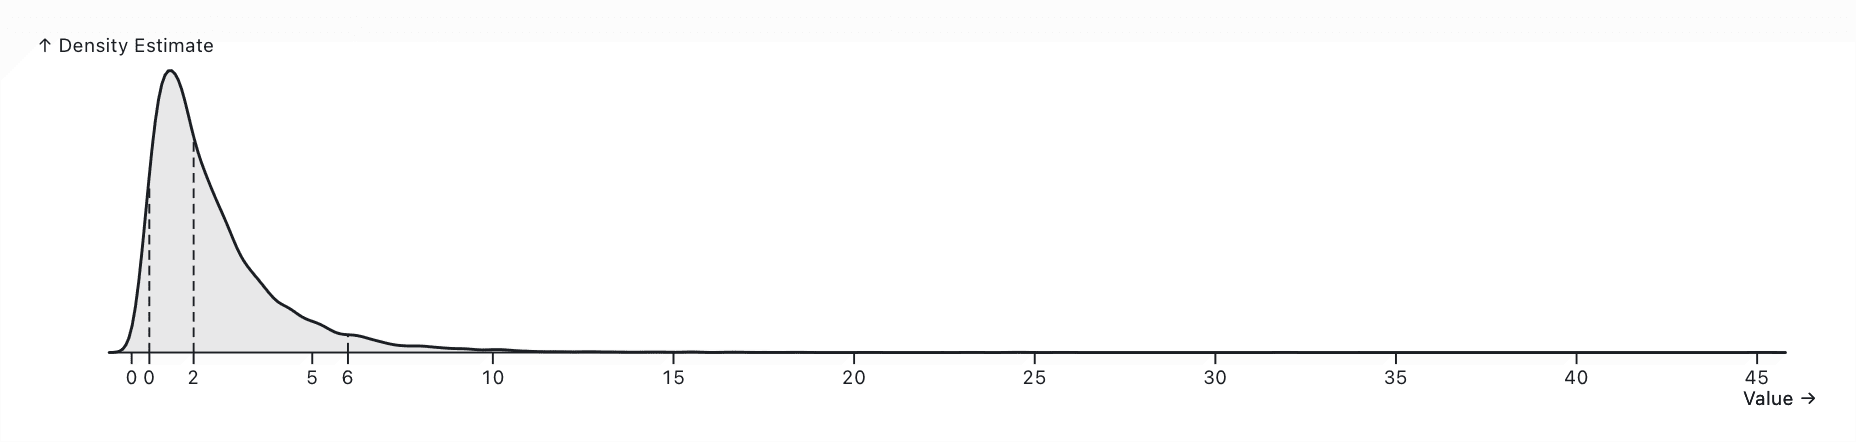
Estimated distribution of the cost-per-install of an average mobile app (mean $1.71)
const marketingCostPerDownload = dist`(0.5 to 6) * ${acquisitionCostAdjustment}`
Development costs
(Note: We assume zero service costs, as apps run on device and use free OEM services for things such as syncing. Most content apps will host their files on a CDN, but I’m not convinced the hosting costs would be a significant proportion of revenue; anyhow, I add a cost multiplier later).
After wrangling with a few different accounting methods, I think the most reasonable way to account for development costs is to establish a rough amortised cost per user. This is a frozen-in-time estimate (i.e. it divides the total cost of providing an app in a given year by the total number of users it has in that given year), so it doesn’t account for past costs. Apps are likely to get more cost-effective over time.
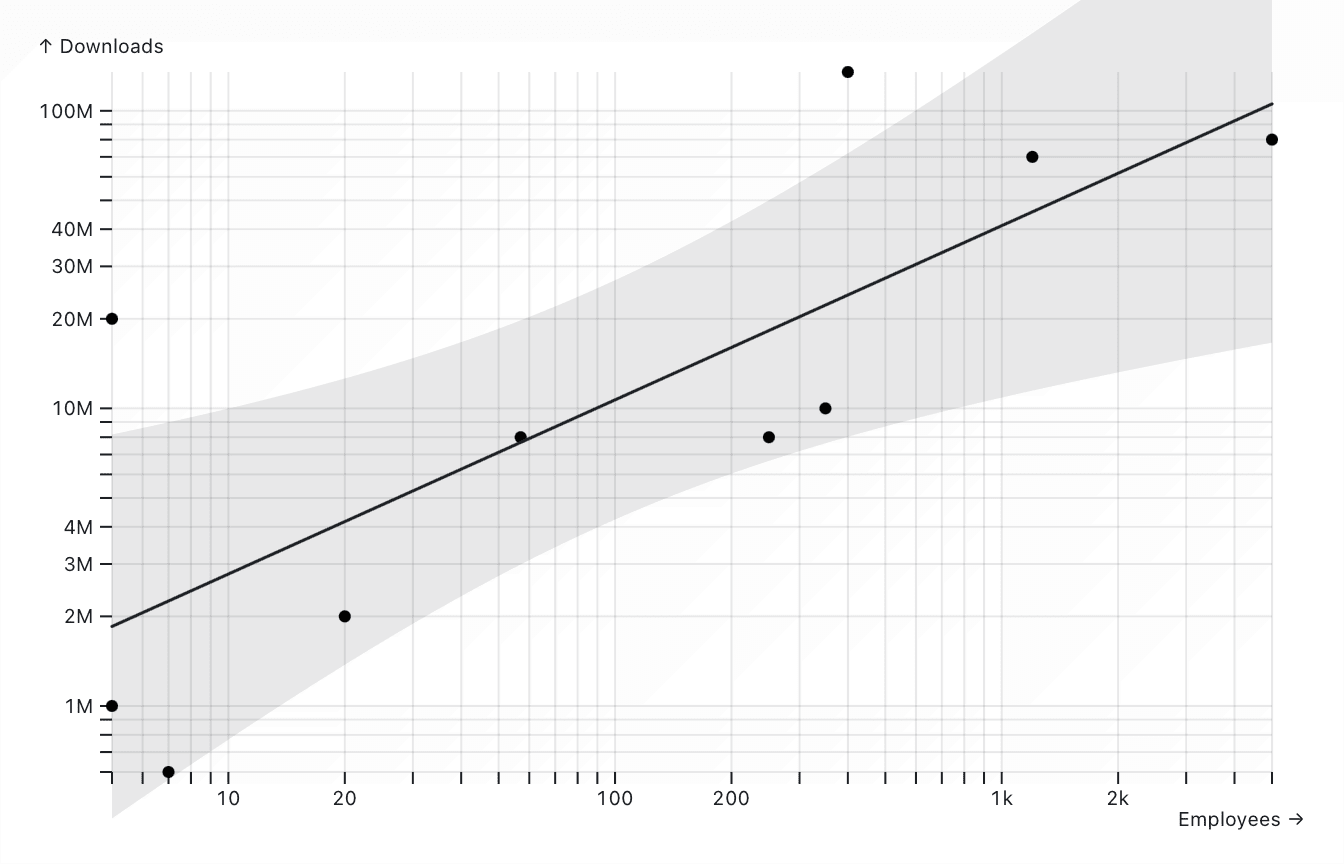
We will assume the major development cost is labour. Here are the rough employee & user counts for the top mental health apps:
We can see a linear relationship between the number of employees and downloads, but with wide bounds
Obviously, a company which optimises for cost-effectiveness should be able to get these numbers down. But with our observed values, we can take that the number of downloads per employee is around 25,000–2,500,000.
Employee salaries probably average out around 25,000–250,000 USD. I am very unconfident in this estimate—some of these companies operate in low-income areas (Daylio, Breeze) and others employee cheap content generation labour (Headspace, Calm, BetterHelp).
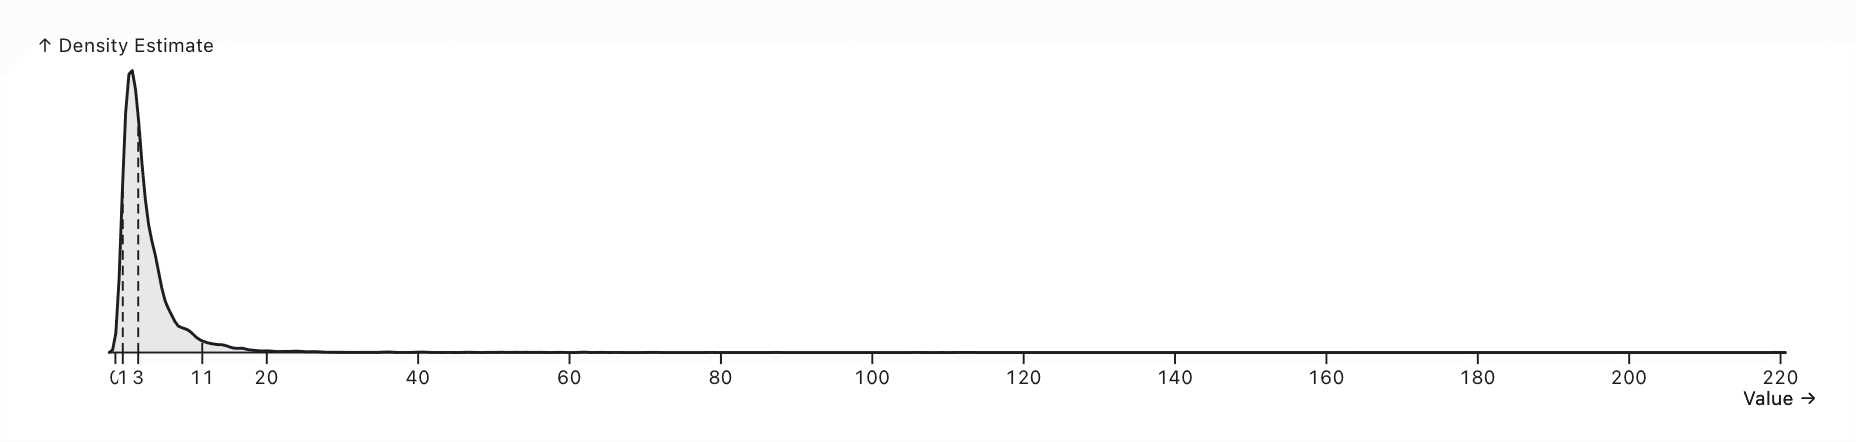
Estimated distribution of the development cost per download (mean $1.13)
const developmentCostPerDownload = dist`(1 / (25000 to 2500000)) * (25000 to 250000)`
Benchmarking against other interventions
I will also include a 1–1.5x multiplier on costs, as there is a strong possibility of unaccounted costs.
Estimated distribution of total cost per download (mean $3)
const totalCostPerDownload = dist`(${marketingCostPerDownload} + ${developmentCostPerDownload}) * (1.1 to 1.5)`
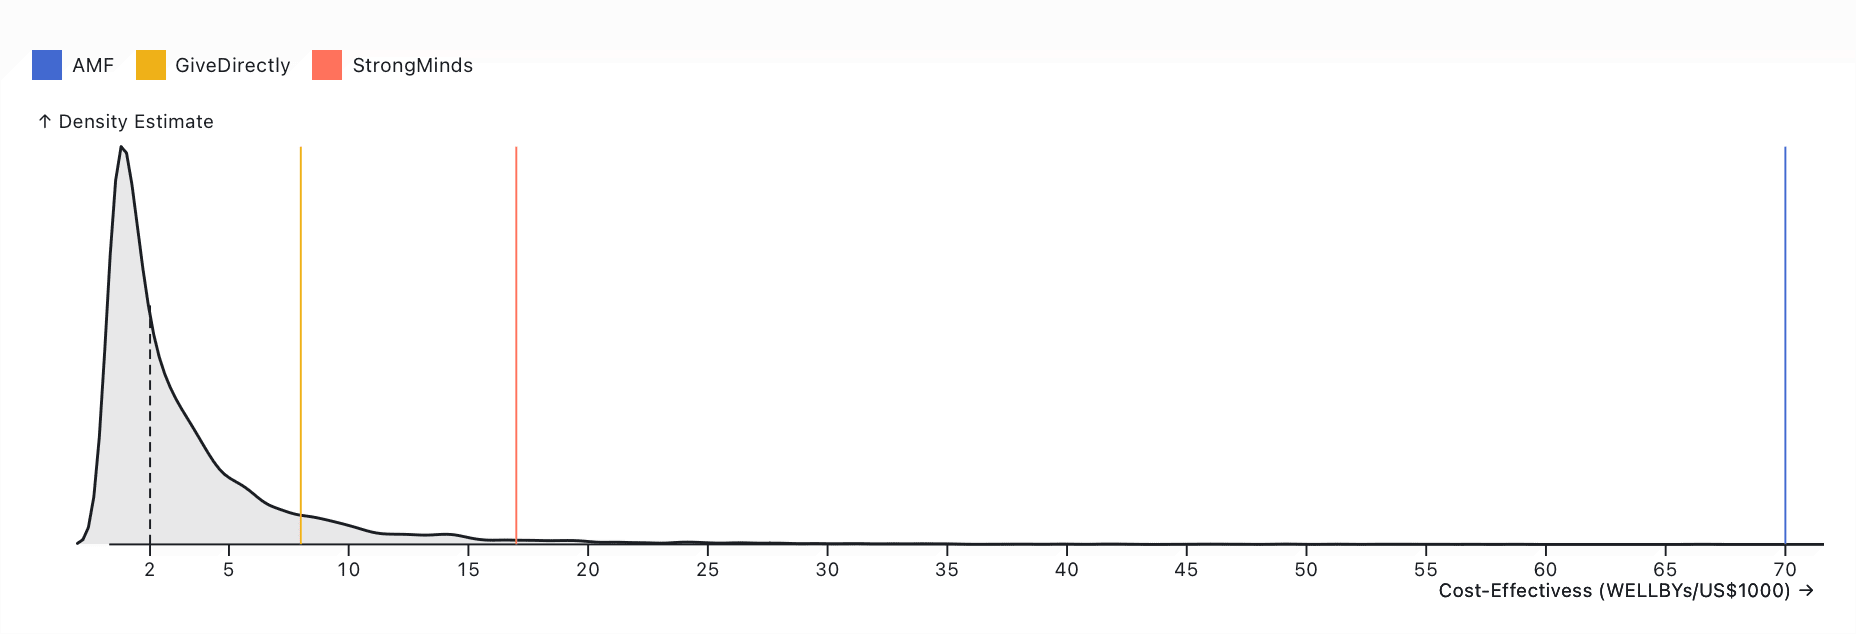
We can finally arrive at our total cost-effectiveness. Let’s plot the rough density below, on a log scale, and compare it to GiveWell’s estimates for the cost-effectiveness of GiveDirectly, StrongMinds, and Against Malaria Foundation.
We can compute some statistics on this to make the relationship a bit clearer. The mean of this distribution is 3.47 WELLBYs per US$1,000, and its standard deviation is 5.50, which means:
GiveDirectly is 1.5σ better
StrongMinds is 3.1σ better
AMF is 12.7σ better
I would be happy to conclude that the average self-guided mental health app is unlikely to achieve similar cost-effectiveness to a top GiveWell charity. You should probably not start donating to Headspace tomorrow.
How would we improve it?
This analysis considers the current cost-effectiveness of self-guided mental health apps. I think it is quite likely that significant improvements can be made to surpass at least GiveDirectly. And even if we can’t, this section can be useful for determining the sensitivity of this cost-effectiveness analysis in terms of its parameters.
Reduce hiring
Meditation apps, for example, require an evergreen content library and therefore have significant ongoing costs and headcount needs. This could be significantly reduced to just a small development team by developing an app that doesn’t structurally require ongoing content development. It may even be possible to reduce the size of the marketing team with advancements in marketing automation over the next decade.
I personally believe most modern tech companies are very bloated, so I think this could reduce development costs by an order of magnitude, or perhaps even more.
This is where, in practice, I went to the Observable notebook and adjusted some scale multipliers on the parameters to determine how it affected the distribution. You can take me on my word, or you can try adjusting them yourself 🙂
Reducing hiring by an order of magnitude adds about 40% to the cost-effectiveness, but this isn’t nothing—it could bring us roughly up to the same cost-effectiveness as cash transfers. Given the wide range of observed employee-download ratios, this would be a very promising direction.
Reduce cost per employee
This is trickier, since the counterfactual employee likely would’ve worked at another effective organisation or donated any extra salary. However, it might be possible to lower employee salaries a little bit? In practice, halving salaries (as low as we could reasonably go) only adds 14% more cost-effectiveness. I would not pursue it as a direction.
Market to low-CPI regions
CPI is usually half an order of magnitude lower in low- and middle-income countries. This is an excellent opportunity, as those countries also tend to have lower baseline life satisfaction & worse existing mental health support.
Lower-income countries tend to have CPIs around US$0.05–1.50, and adjusting to roughly this value nearly triples our cost-effectiveness (although there is a lot of uncertainty about those CPIs in practice). I think this would be an extremely promising direction—apps could accept donations for customer acquisition and subscription costs in LMICs, while taking revenue from higher-income countries, without significant changes to their structures or business models. Advocacy in this area toward existing providers might be effective!
Improve dropoff rates
It might be possible to lower dropoff rates. We saw Insight Timer report a 16% retention rate, which would double our impact. They claim it’s due to their lack of growth hacking techniques, which might be true if users are put off by an app that feels too slick.
At the very least, it seems reasonable that meditation apps have high dropoffs because they require significant upfront commitment, and a delayed emotional payoff (and are just not effective for some segment of users). All of these elements could be improved upon to increase the dropoff rate.
Improving the dropoff rate from 4% to 6% increases the cost-effectiveness by about 40%—but we’d have to be careful about DAU-hacking in practice.
Improve effect size
It may also be possible to achieve a larger-than-average effect size by structural means. The easiest-to-imagine mechanism here would be to simulate a therapist using a chatbot; this could even have a larger effect due to the increased availability & lower cost. Or, it could be true that GiveWell’s discounts are overly conservative. But in general, I can’t speak for mechanisms as clearly as I can for the above. Improving the effect size by 50% increases the cost-effectiveness by 60%.
Conclusion
I mostly did this work for myself, but I hope it’s useful for other EAs looking into this area. I am very new to the forum. If you’re giving feedback, I am less interested in specifics on accuracy, and much more in large, directional things I’ve overlooked that could have caused me to overestimate cost-effectiveness. Thank you!
28
More posts like this
195
Money, Population, and Insecticide Resistance: Why malaria cases haven’t declined since 2015


Great overview! I'm Eddie, long-time EA and co-creator of the mental health app Clarity https://apps.apple.com/us/app/clarity-cbt-thought-diary/id1010391170
I pretty much agree with your broad points. Some quick thoughts on each section from an "insider" point of view:
Short-term impacts of treatment: The problem with these studies is that they study "apps" as a category, but apps are 1. extremely different from one another and vary drastically in quality and 2. are constantly improving. The best apps are probably 10-100x better than the worst mental health apps. Also, functionality of the best apps today are very different than the best apps from a few years ago when these studies were run. In the future, they'll probably be even more different. I don't think we're close to peak mental health app effectiveness.
Self-guided app adherence: Apple actually has made benchmarks available! I can grab them for you. For health and fitness apps which rely on a subscription business model, here are the 25th / 50th / 75th percentiles.
Day 1: ~16% / ~25% / ~34%
Day 7: ~3% / ~7% / ~13%
Day 28: ~0.75% / ~2.5% / ~6%
Note: The exact percentages vary by a little bit depending on which week is selected.
User acquisition costs: I can confirm there are huge differences in cost per install between US iOS (in the range of $1-2 per install) vs low-income country Android ($0.02 - $0.10). Although of course, ads aren't the only way to get app downloads. Organic app downloads are $0.00!
Development costs: If you were to put us on your comparison, we'd be at 2 employees (my wife and I) @ ~8,000,000 downloads across all of our apps. I can confirm that service and hosting costs are basically negligible.
How to improve: I agree that marketing to low-CPI regions could be a great impact opportunity. I'm most excited about improving drop-off rates / effect sizes (two sides of the same coin). I can absolutely imagine a world where a self-guided mental health app is 10x more effective than the best one available now.
Again, great overview! Let me know if I can be helpful!
Eddie, thank you (I’m a long time fan!)
Short-term impacts: Mmm, this has made me realise I wasn’t explicit about the assumptions I made there—I should either make that effect size bound a bit wider or model it as an exponential (or possibly a beta). I think this CEA is best interpreted as ‘if you built an evidence-based product, what would its cost-effectiveness be?’ but even that should probably have a wider bound. And there’s the new update in Linardon et al. (2024) that will be worth incorporating.
Adherence: Thank you! That roughly tracks with the decay curves from SimilarWeb, which is good validation. Although you raise a good point—decay probably depends a lot on whether you’re feature-gating after a trial period or not. Do you have a ballpark for the ratio of installs to DAU?
CPI: Those are lower CPIs than the estimates I had—good to know! Are those on Facebook, Tik Tok, elsewhere? I was also assuming organic traffic is negligible after the first hundred thousand or so, but do you still see an effect there?
Dev costs: Lovely! Having worked in industry, I definitely have the sense that there are good incentive reasons why headcounts might be unnecessarily bloated 🙃
Opportunities: I won’t ask what your roadmap looks like, but it’s very promising that you have this hunch. In my own experience as a user, I can definitely concur.
I’ll mull for a bit and update the OP with some adjustments. I might also shoot you a DM with some curiosity questions later. Thank you again! 😍
Ratio of Installs to DAU: Hmm, that's an interesting metric...the way I think about retention is like a layered cake, kind of like the baumkuchen I just ate for breakfast, but linear instead of round. Anyways, there's time on the X axis and users on the Y axis. For any given day, there's a sizeable layer of cream at the top which are the Day 0 users. And then right below that, a smaller layer of Day 1 users, etc. etc. Ultimately there are hundreds of layers of users from older daily cohorts. You can track each daily cohort through time and it'll start big and then shrink rapidly, following the retention curves, until eventually it flatlines at some point (ideally above 0).
So you could look at overall installs to DAU, but that gives an advantage to new apps because they don't have a lot of old installs from years-old cohorts that have left. Or you could compare daily installs to DAU, but that gives an advantage to old apps because they'll have a lot of users from old cohorts.
A better metric could be DAU / MAU ratio, which measures like out of all of your active users, how many of them use the app every day. Here ~25% would be exceptional with an average of probably around 10%. But that's also biased based on how many new users you're bringing in each day.
By the way, the only peer group benchmarks that apple provides are Conversion Rate, Proceeds per Paying User, Crash Rate, Day 1/7/28 Retention. https://developer.apple.com/app-store/peer-group-benchmarks/ . But they might be announcing more in March thanks to the EU's DMA. https://developer.apple.com/support/dma-and-apps-in-the-eu/#app-analytics
CPI: Yes, those numbers are from Facebook / Instagram / TikTok ads.
In terms of organic traffic, it's also a measure of time. Say for example you're bringing in 1000 organic users a day. After a year, that's 365k users. After 5 years that's 1.8M users. Of course, the app still has to remain good to continue getting organic downloads. Since the definition of good is always improving, the app would need to be consistently updated.
I'd say estimate around 2/3 of our lifetime installs are organic, but it really depends on the app. I speculate that Daylio might be closer to 100% organic while Breeze is probably closer to 0%.
Hmm—good points. Getting Installs/DAU wrong could meaningfully affect the numbers, I guess longer-term retention per install is probably a better way of accounting for it. It was unclear to me whether to model retention as having a zero or nonzero limiting value, which would change some of the calculations.
Improving organic install rate would be promising if you could get it above 50%, I think (your apps sound very effective!). I suspect a lot of that is, as you say, about consistently building a good user experience and continuing to add value. (I see a lot of Daylio users complaining about the lack of updates & the increased ad load.)