A lot of this is looking at global poverty, and I'd highly recommend 'Poor Economics' as an introduction to the lives of the global poor.
I'll mention that I found this post's title to be overly sensational (and likely wrong in context). I expect the majority of EA forum viewers would score above 7 on the quiz (where 4.3 would be the expectation for randomly guessing), and I honestly would be crushingly depressed if this were not the case.
For reference, I was 11/13 on the quiz (I thought global life expectancy was ~60 instead of ~70 and expected 1 of the three animals listed to have become more endangered).
q11 (endangered species) was basically a guess. I thought that an extreme answer was more likely given how the quiz was set up to be counterintuitive/surprising. Also relevant: my sense is that we've done pretty well at protecting charismatic megafauna; the fact that I've heard about a particular species being at risk doesn't provide much information either way about whether things have gotten worse for it (me hearing about it is related to things being bad for it, and it's also related to successful efforts to protect it).
On q6 (age distribution of population increase) I figured that most people are age 15-74 and that group would increase roughly proportionally with the overall increase, which gives them the majority of the increase. The increase among the elderly will be disproportionately large, but that's not enough for it to be the biggest in absolute terms since they're only like 10% of the population.
On q7 (deaths from natural disaster) I wouldn't have been surprised if the drop in death rate was balanced out by the increase in population, but I had an inkling that it was faster. And the tenor of the quiz was that the surprisingly good answer was correct, so if population growth had balanced it out then probably it would've asked about deaths per capita rather than total deaths.
I got 10 right and was only confident in 1 of my answers that I got wrong. The link I took it at said average is 40% right, which is way off the scores rosling got, so I do wonder if his study replicates. If he's doing the normal thing and testing it all on students, I would expect them to be more pessimistic bc they are in that "everything sucks" phase of life as teenagers, and the media about the same because reporters have a particular bias toward negativity, because it's what they feed on. In fact I am sufficiently confident about the negativity of reporters, both in terms of professional experience and the kind of person who is drawn to the job in the first place, that it makes me rather suspicious to find any group of people that does as poorly as them on the test, and teenagers hate everything is the only explanation I can come up with.
The State of the World — and Why Monkeys are Smarter than You
According to the EA website, Effective Altruism is all about one question:
How can we use our resources to help others the most?
In this post, I plan to tell you about a revelation I experienced and share a bit of what I learned from it. But first, take this quiz! The link and the quiz below are the same, so take either one. To hold yourself accountable, write your answers down on a piece of paper, and don’t google anything.
In all low-income countries across the world today, how many girls finish primary school?
20%
40%
60%
Where does the majority of the world population live?
Low-income countries
Middle-income countries
High-income countries
In the last 20 years, the proportion of the world living in extreme poverty has…
Almost doubled
Remained more or less the same
Almost halved
What is the life expectancy of the world today?
50 years
60 years
70 years
There are 2 billion children in the world today, aged 0 to 15 years old. How many children will there be in the year 2100, according to the United Nations?
4 billion
3 billion
2 billion
The UN predicts that by 2100 the world population will have increased by another 4 billion people. What is the main reason?
There will be more children (age below 15)
There will be more adults (ages 15 to 74)
There will be more very old people (age 75 and older)
How did the number of deaths per year from natural disasters change over the last hundred years?
More than doubled
Remained about the same
Decreased to less than half
There are roughly 7 billion people in the world today. Where do they live?
1 billion in the Americas, 1 billion in Europe, 1 billion in Africa, 4 billion in Australia and Asia
1 billion in the Americas, 1 billion in Europe, 2 billion in Africa, 3 billion in Australia and Asia
2 billion in the Americas, 1 billion in Europe, 1 billion in Africa, 3 billion in Australia and Asia
How many of the world’s 1-year-old children today have been vaccinated against some disease?
20%
50%
80%
Worldwide, 30-year-old men have spent 10 years in school, on average. How many years have women of the same age spent in school?
9 years
6 years
3 years
In 1996 tigers, giant pandas, and black rhinos were all listed as endangered. How many of these three species are more critically endangered today?
Two of them
One of them
None of them
How many people in the world today have some access to electricity?
20%
50%
80%
Global climate experts believe that, over the next 100 years, the average temperature will…
get warmer
remain the same
get colder
(Write down your answers before reading on!)
Part 2: Why Monkeys are Smarter than You
Here are the answers:
1: C, 2: B, 3: C, 4: C, 5: C, 6: B, 7: C, 8: A, 9: C, 10: A, 11: C, 12: C, 13: A
Increment your score by one for each correct answer, and write the total on your piece of paper.
How did you do? Did you get a lot of questions wrong? Did you feel like you were guessing? Are you surprised at the correct answers?
This quiz is from a book called Factfulness, by Swedish professor of Global Health Hans Rosling. Here is a great TED Talk given by Rosling on which this article is based. If you are anything like I was about a year ago when I first read Factfulness, then this quiz comes as a bit of a shock — not only did you get things wrong, but you got things confidently wrong. Maybe you weren’t just off — you were way off. Maybe it is even the case that guessing at random would have earned you a higher score.
Let’s take a look at how some other people did on this quiz:
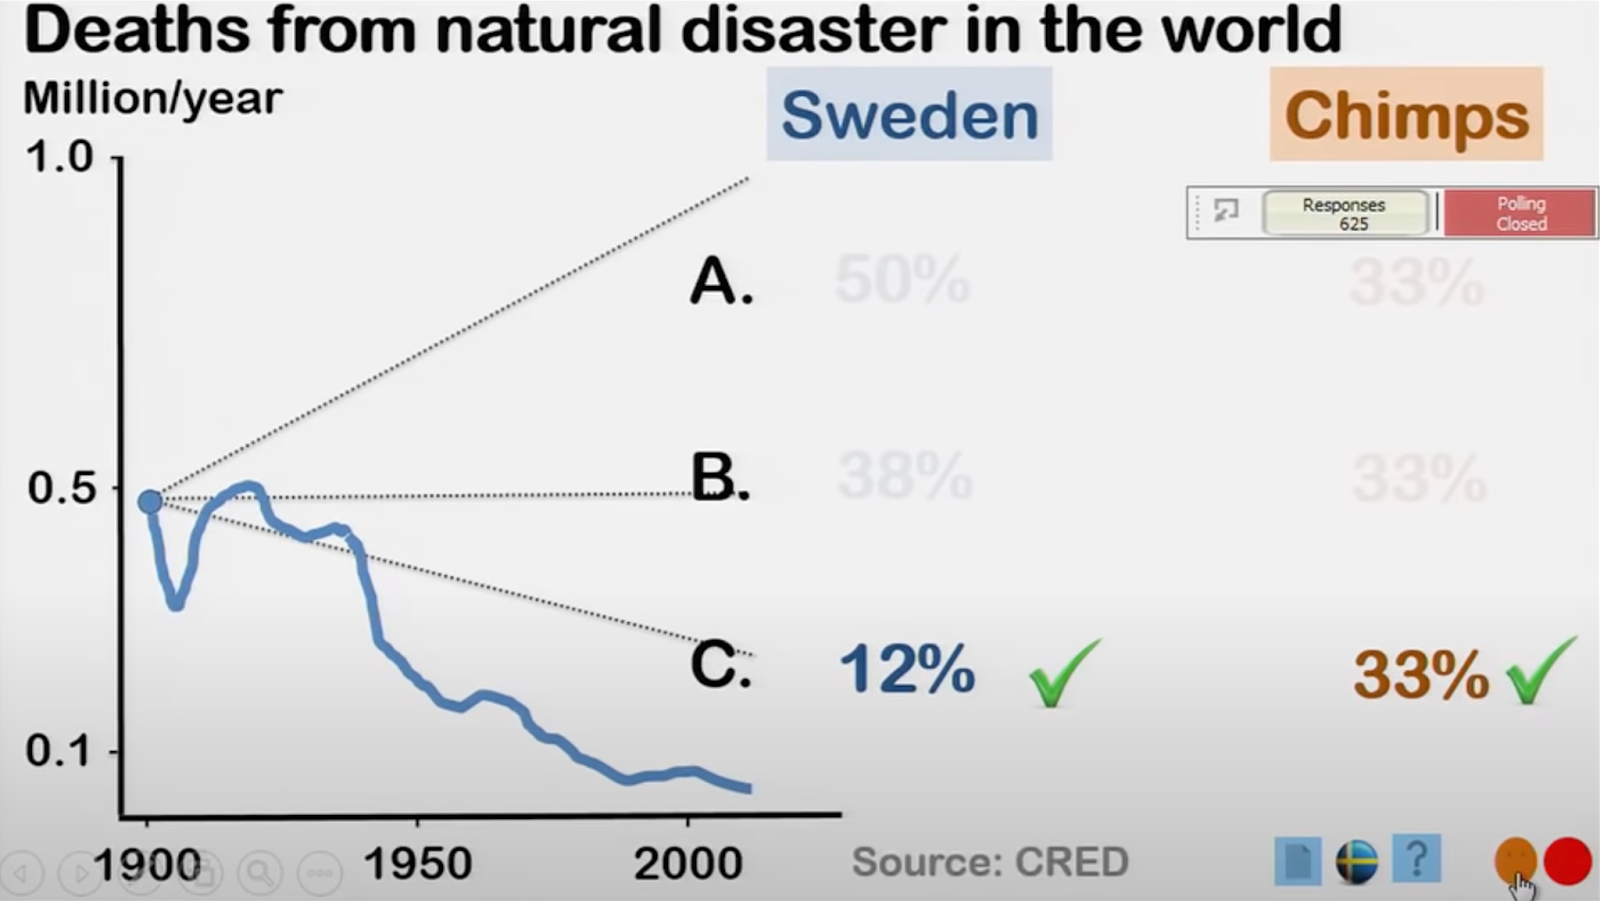
The graph below shows us how Swedes scored on the question about natural disasters (question #7):
How did the number of deaths per year from natural disasters change over the last hundred years? The correct answer was C) Decreased to less than half. Only 12% of Swedes answered correctly, compared to one-third of the chimps.
Only 12% of quizzed Swedes correctly chose C, while 38% chose B and 50% chose A. The chimps indeed beat the Swedes, with 33% picking C. Here is how the United States scored on the question about world poverty (question #3):
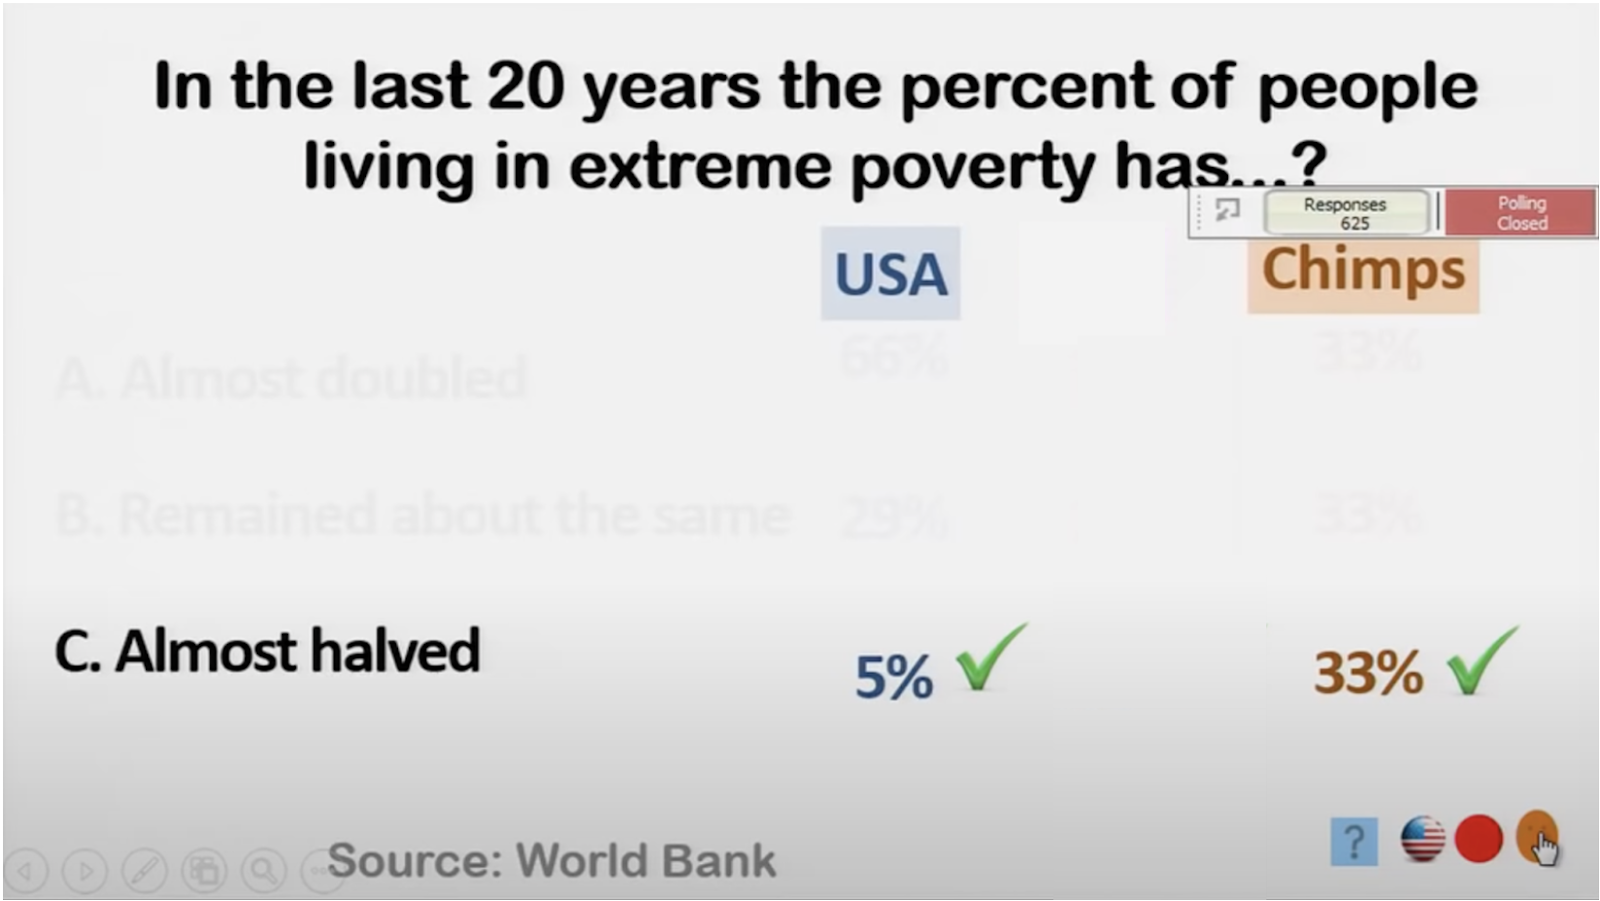
In the last 20 years the percent of people living in extreme poverty has...? The answer was C) Almost halved. One in twenty surveyed Americans answered correctly.
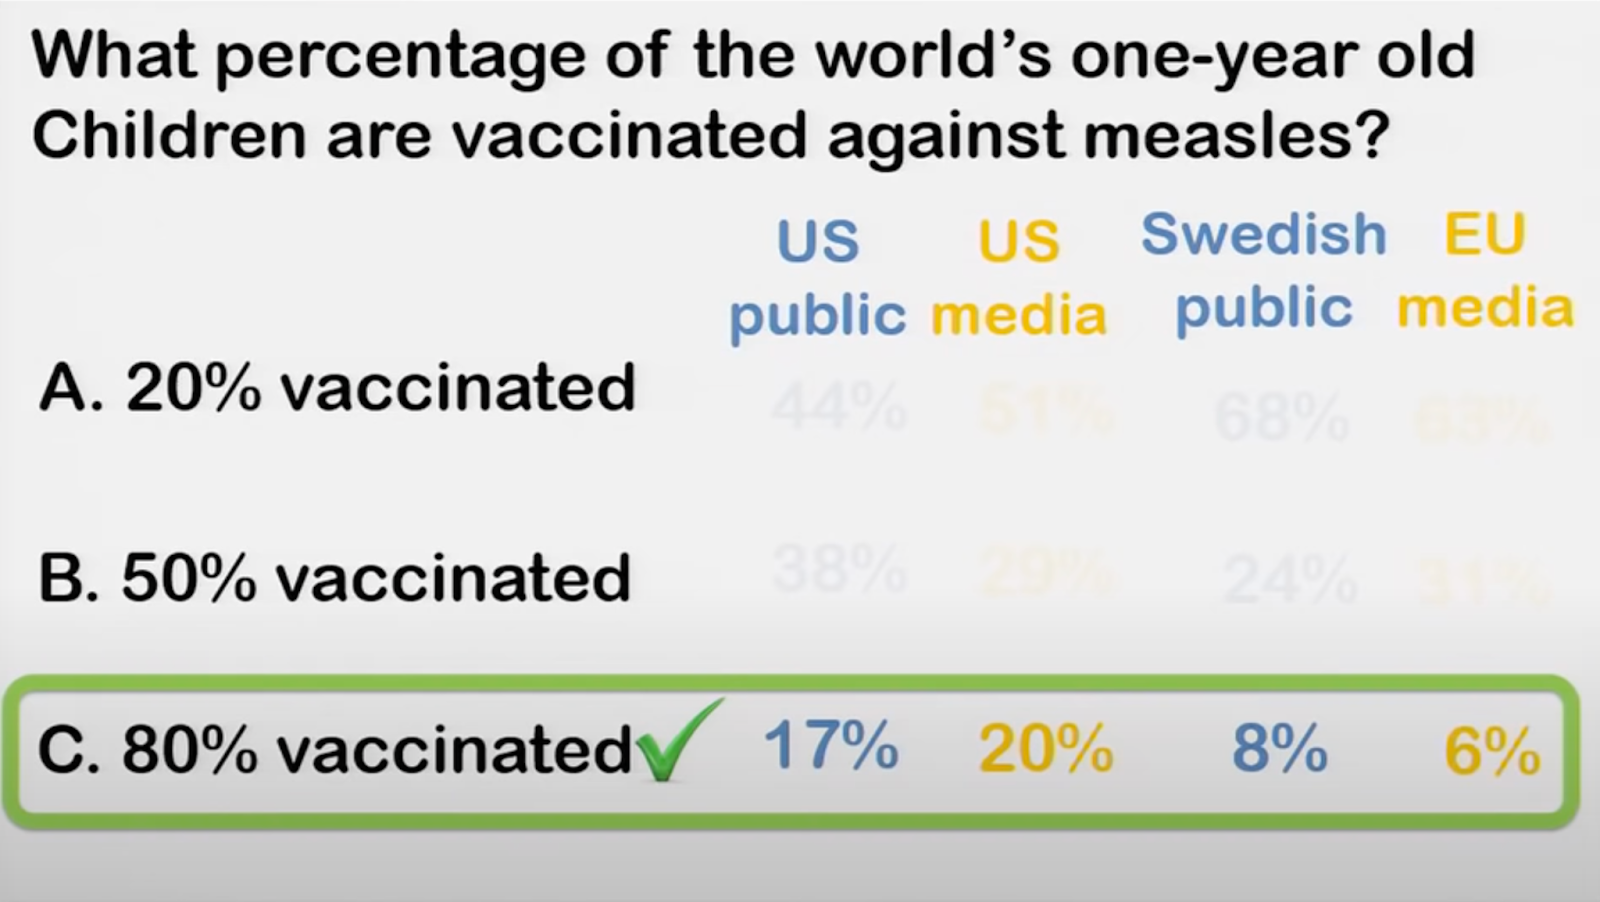
As you can see here, it appears that the chimp brains win again as only 5% of Americans correctly pick C, 29% pick B, and a whopping 66% pick A — that the world poverty rate has doubled in the past two decades. Way off. Here is a slight variant on the vaccination question (#9) showing how the US and EU media scores compare to the US and EU public:
What percentage of the world's one-year old children are vaccinated against measles? The answer is C) 80%. All four groups had a correct response rate under 33%.
The media — on both sides of the Atlantic — is bested by the chimps!
This trend continues in nearly every question for nearly all respondent groups. (Question #13 on the global temperature is an exception, with most respondent groups getting the question decisively correct.) Rosling and his team gave this quiz to 12,000 people across 14 countries, and only 10% of all respondents answered 5 or more questions correctly. Only 10% did better than the chimps (which, by guessing randomly, would receive a 4)!
What Rosling discovered here is not a revelation for its discovery of widespread ignorance; It is a revelation for its discovery that we are somehow worse than ignorant. The response rates are consistently worse than guessing (33% correct). It isn’t that we lack information, but rather that, by some mysterious process, we all have acquired a systematicallyinaccurate perception of the world.
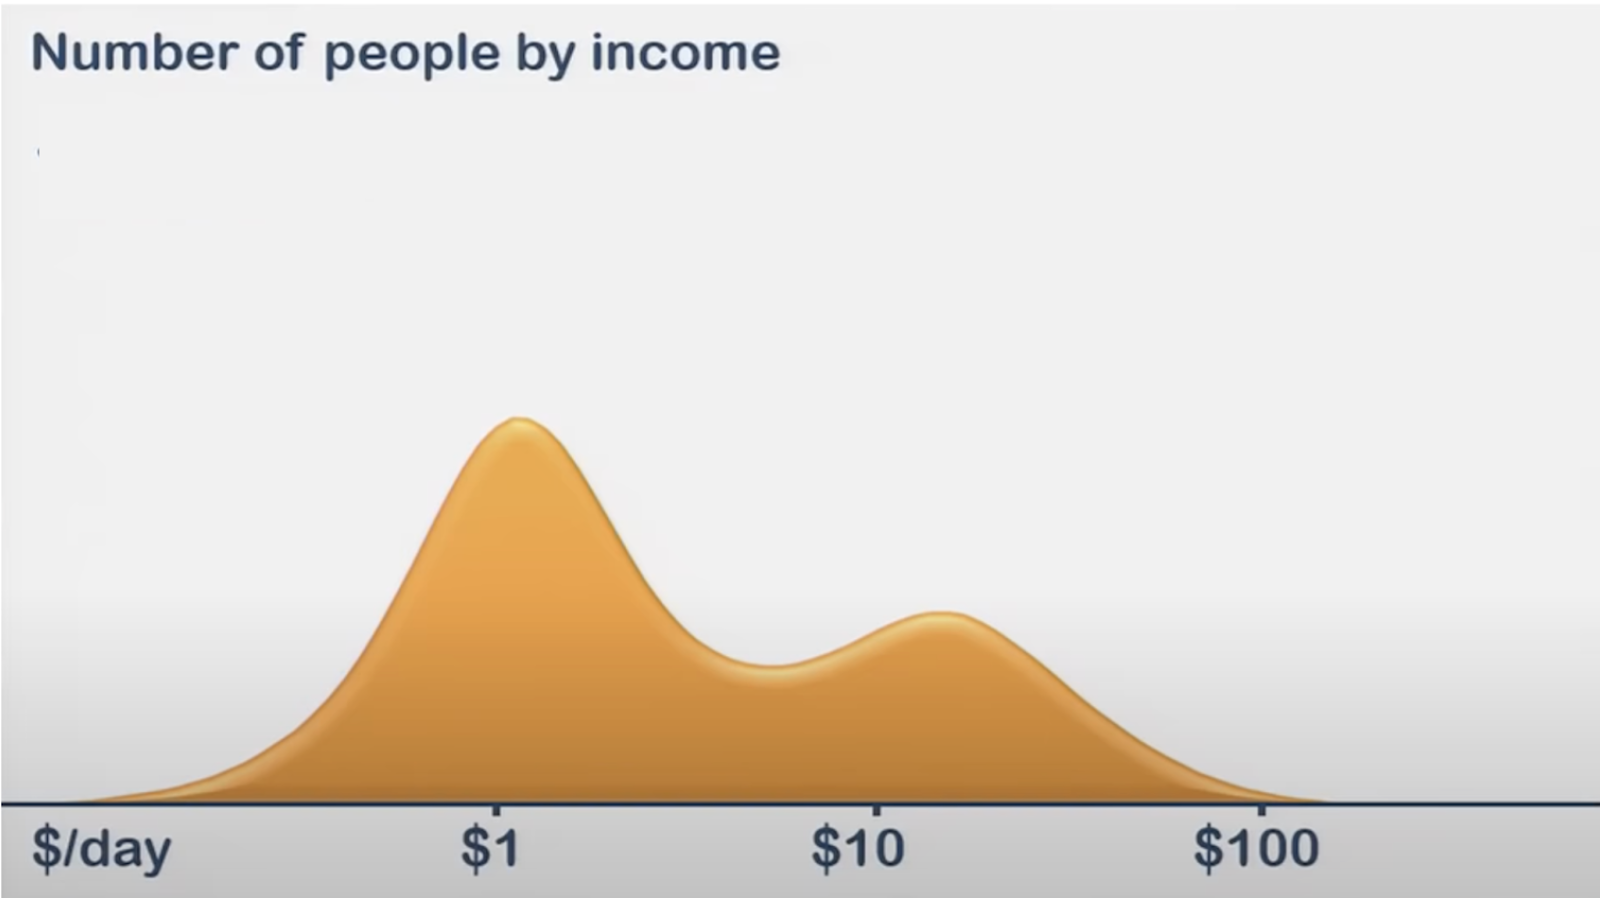
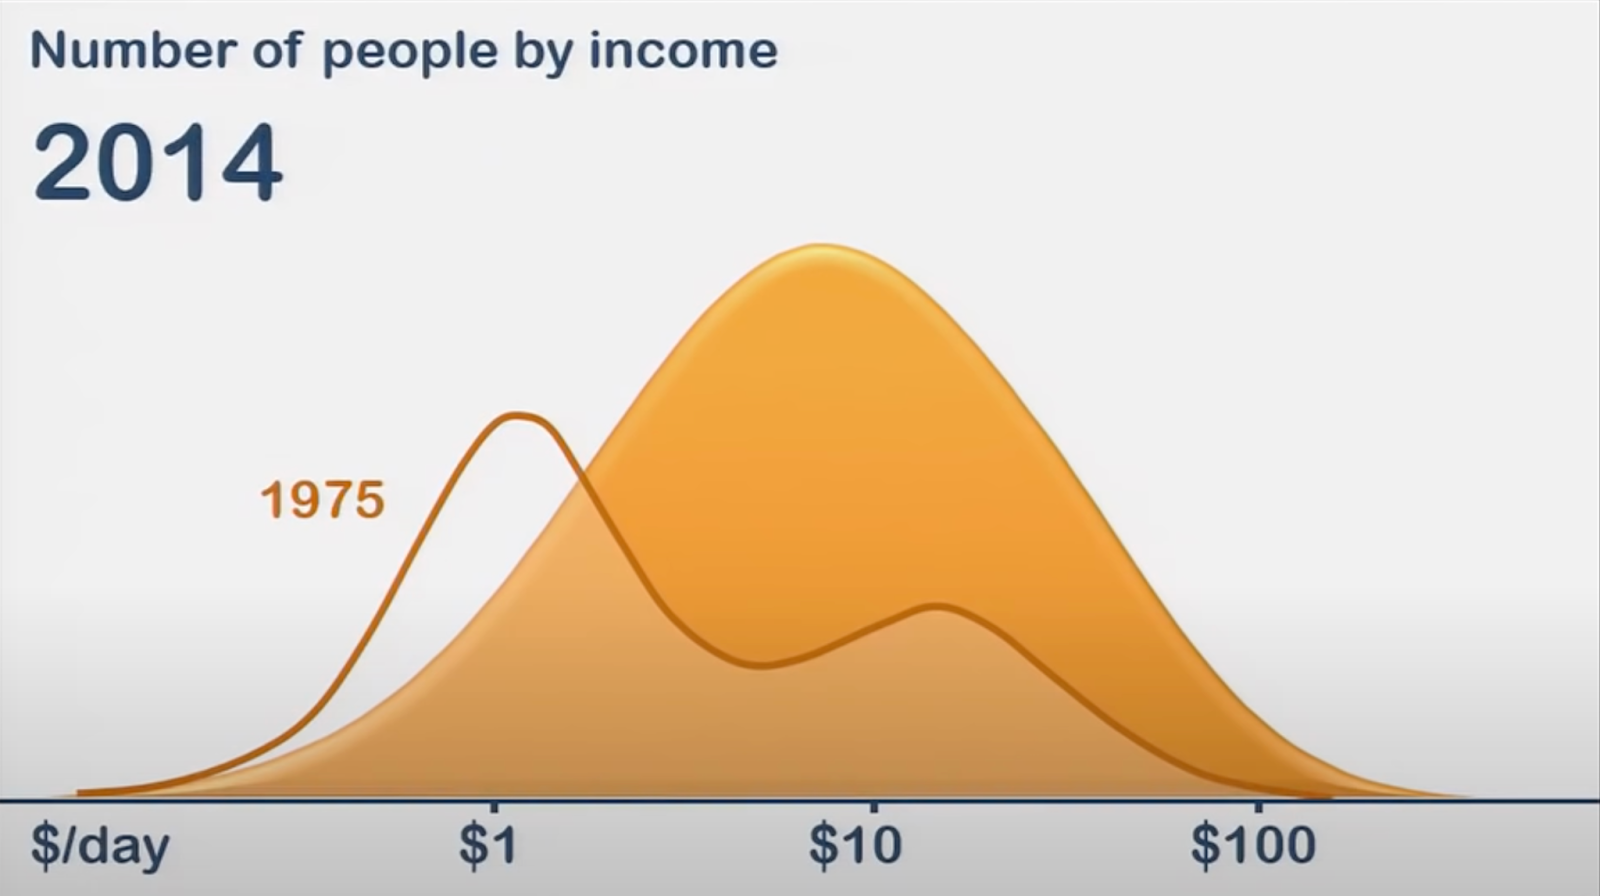
So why is it that we are wrong? Where do these flawed perceptions come from, and why are they so widespread? And why has our collective mind stumbled into this specific incorrect view of the world rather than some other version? You will have to read Factfulness in its entirety to get the full answer to that question. As a teaser, one of the most important reasons (in my opinion) is that most people think the world looks like this:
When really it looks like this:
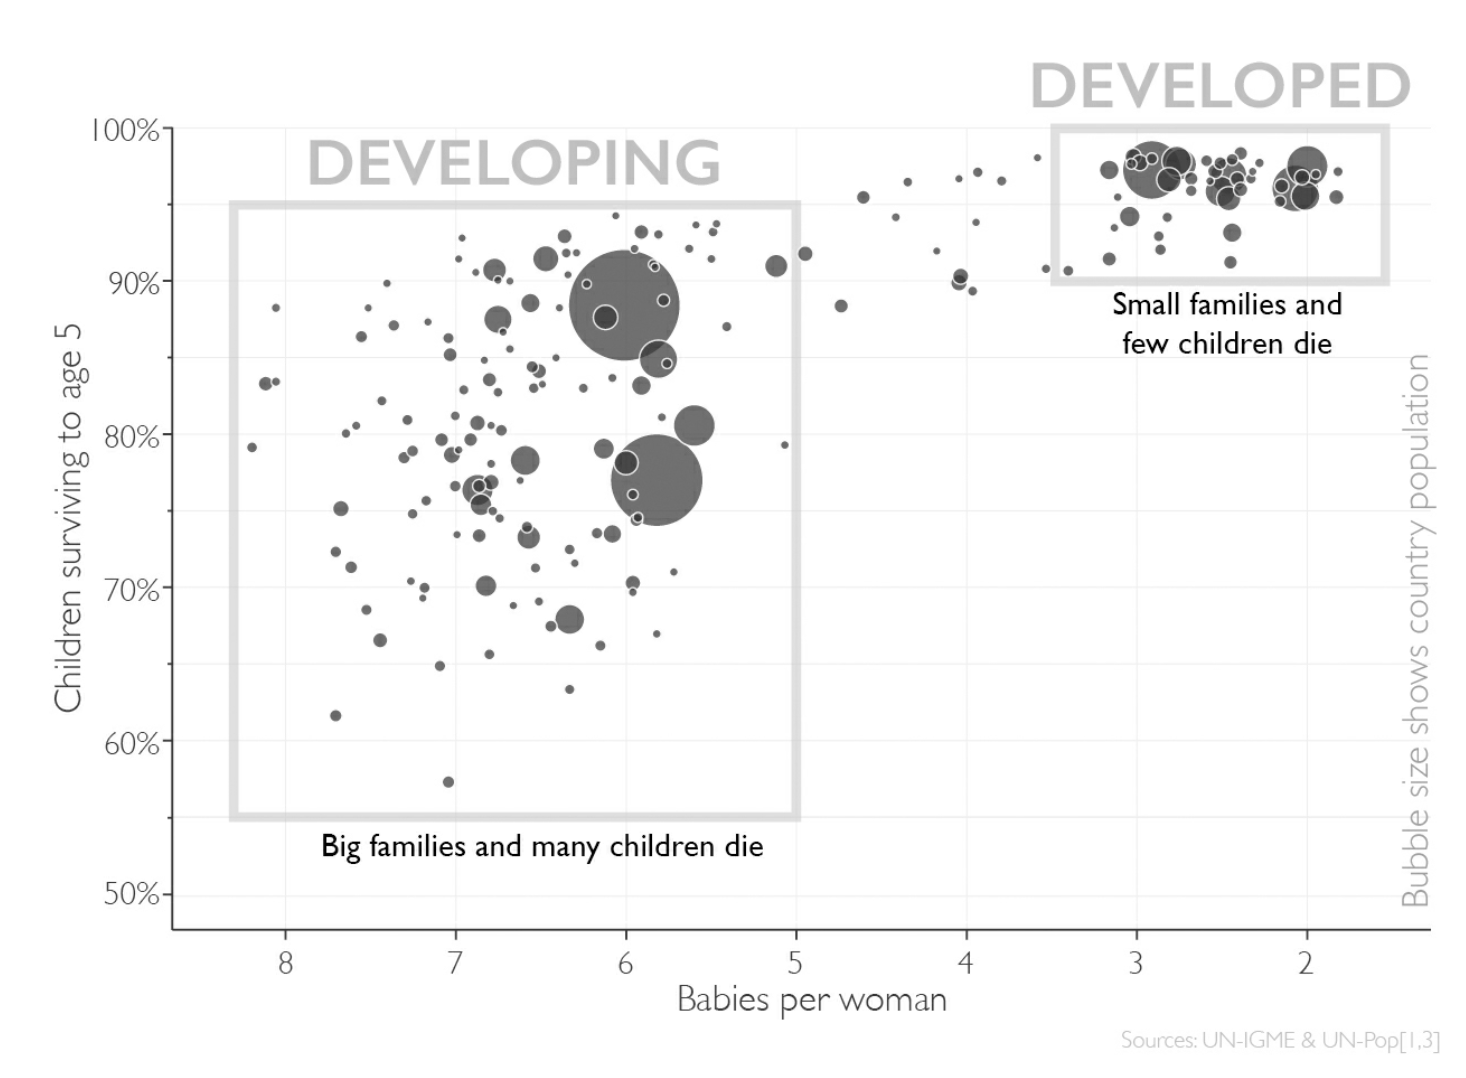
Most people think the world looks like this (1965):
Children surviving to age 5 vs Babies per woman in 1965. Each circle represents a country, with area proportional to population.
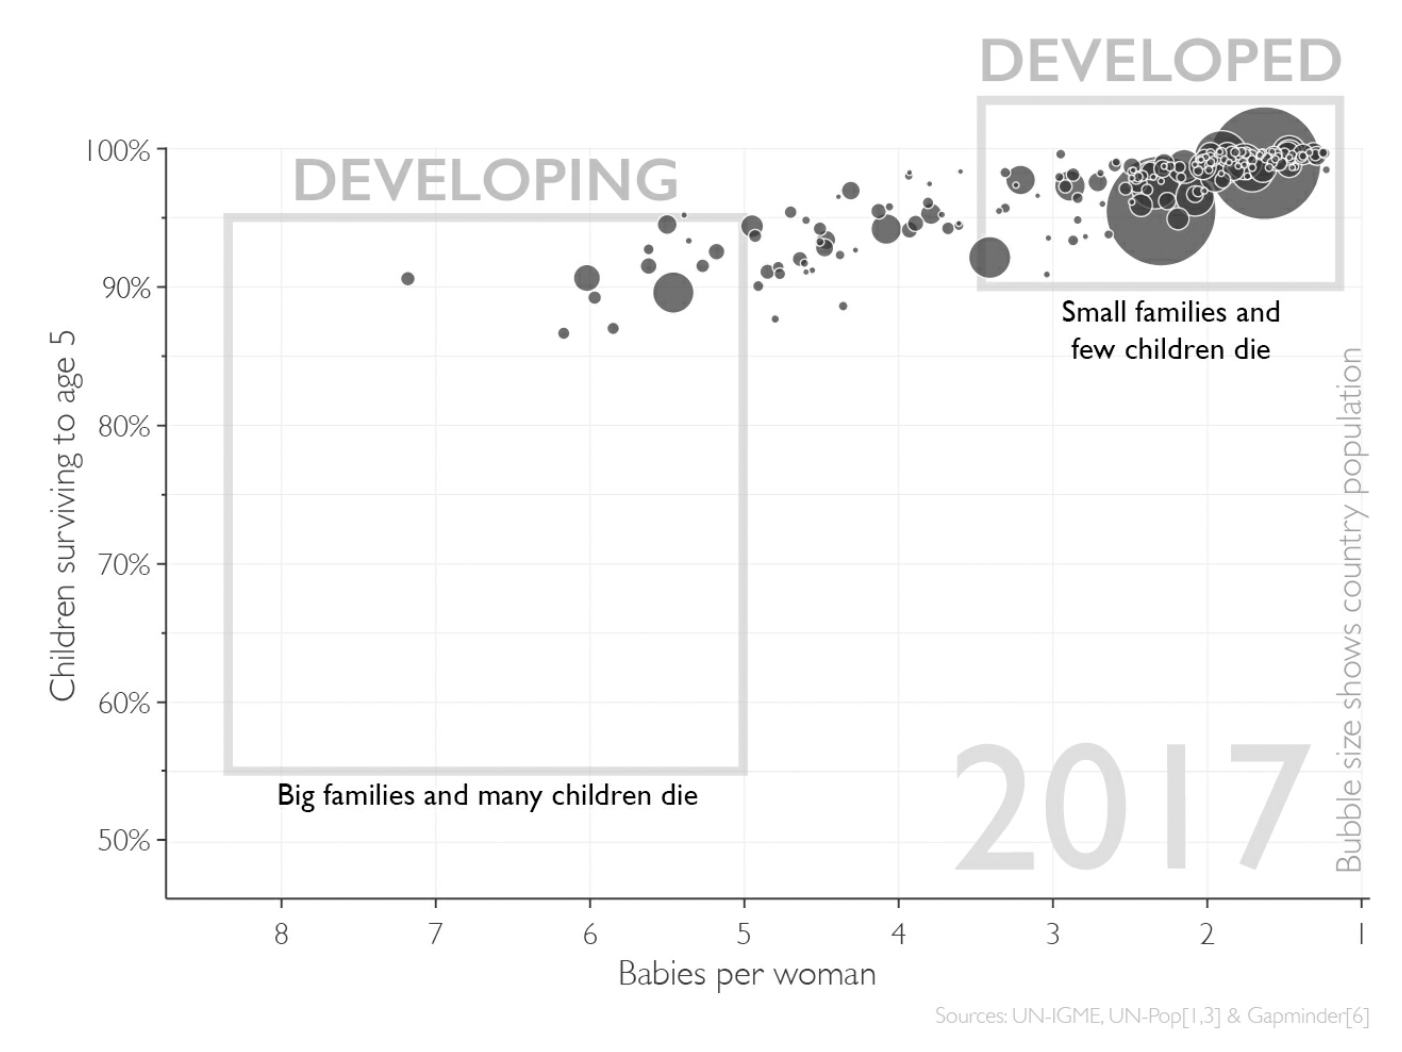
When it really looks like this (2017):
Children surviving to age 5 vs Babies per woman in 2017. Each circle represents a country, with area proportional to population.
Most people have a static view of the world based on a snapshot of the past, and they neglect to see the bigger positive forces of gradual change while focusing on negative headlines in the news. They think there is a “developing world” and a “developed world,” and they still use outdated terms like “third world countries,” when in reality the income of most people today is found somewhere in the middle of the spectrum, not within one of two vaguely-defined categories.
About 1 in 10 people on Earth today lives on less than $2 a day. This is one of the most horrible facts about the state of the modern world. Yet in The Precipice, Toby Ord reminds us that, before the Industrial Revolution, 19 in 20 people lived on less than $2 a day, even adjusting for inflation and changes in purchasing power (17). In other words, the fraction of humanity living in extreme poverty has shifted from 95% to less than 10% in less than two centuries.
The point here is that things can be bad but getting better. And it seems like things, on average, are getting better! So even if things are still bad, there is reason for optimism — and this optimism should inform our decision-making.
You may be wondering what exactly I think this has to do with Effective Altruism, so let’s return to the question listed at the top of the Effective Altruism website:
How can we use our resources to help others the most?
My argument:
How can we improve the state of the world if most of us don’t know what the world is really like?
Would you not agree that to be a truly “effective” altruist, you should probably know the answers to those thirteen questions? Critics of Effective Altruism often cite overly academic idealism as the enemy of what otherwise might spell out concrete change in a real-world setting. They say that we should stop talking so much about poorly-defined hypotheticals and start talking about the real things happening on the ground, today. Maybe they have not heard enough about Effective Altruism, or maybe they have a point. I will leave you with this question:
How well can you devise a war plan while not really knowing much about the war?
Key Takeaways:
Trade pessimism for optimism, and be wary of pessimists that don’t back up their claims
Think about the influences that may cause a worldview to be systematically wrong
Question ancient categories, and stop talking about “third world countries”
Recognize that things can be bad, but getting better
This is the third in a sequence of posts taken from my recent report: Why Did Environmentalism Become Partisan?
Summary
Rising partisanship did not make environmentalism more popular or politically effective. Instead, it saw flat or falling overall public opinion, fewer major legislative achievements, and fluctuating executive actions.
Public Opinion...
I think right now EAs might be making a significant mistake by paying insufficient attention to the political realm. As EAs we tend to figure out what’s most impactful for us to work on and focus hard. That’s great! But there are various actions that are ‘non-delegatable’ - the extent to which an individual can do the action is limited (like voting, going to a protest, making hard money contributions to particular campaigns). It might be useful if we were all more in the habit of doing variou...
This post presents the executive summary from Giving What We Can’s impact evaluation for 2025. At the end of this post we share links to more information, including the full report and...


A lot of this is looking at global poverty, and I'd highly recommend 'Poor Economics' as an introduction to the lives of the global poor.
I'll mention that I found this post's title to be overly sensational (and likely wrong in context). I expect the majority of EA forum viewers would score above 7 on the quiz (where 4.3 would be the expectation for randomly guessing), and I honestly would be crushingly depressed if this were not the case.
For reference, I was 11/13 on the quiz (I thought global life expectancy was ~60 instead of ~70 and expected 1 of the three animals listed to have become more endangered).
I got 13/13.
q11 (endangered species) was basically a guess. I thought that an extreme answer was more likely given how the quiz was set up to be counterintuitive/surprising. Also relevant: my sense is that we've done pretty well at protecting charismatic megafauna; the fact that I've heard about a particular species being at risk doesn't provide much information either way about whether things have gotten worse for it (me hearing about it is related to things being bad for it, and it's also related to successful efforts to protect it).
On q6 (age distribution of population increase) I figured that most people are age 15-74 and that group would increase roughly proportionally with the overall increase, which gives them the majority of the increase. The increase among the elderly will be disproportionately large, but that's not enough for it to be the biggest in absolute terms since they're only like 10% of the population.
On q7 (deaths from natural disaster) I wouldn't have been surprised if the drop in death rate was balanced out by the increase in population, but I had an inkling that it was faster. And the tenor of the quiz was that the surprisingly good answer was correct, so if population growth had balanced it out then probably it would've asked about deaths per capita rather than total deaths.
Yes, I agree. I also think that the questions aren't representative but likely were chosen because people tend to answer them incorrectly.
FWIW I also got 11/13 (wrong on 6 and 7)
I too got 11/13 (wrong on q6 and q11; because I expected a lot of really old people and that black rhinos were more endangered)