I like the idea, but the data seems sketchy. For example, the notion of "government control" seems poorly applied:
you assign a 0 USG control for "airplane" but historicaly government "control" has been very high (Boeing, Lockheed, Grumman were all operating for the USG during WW2).
you assign 0 to the "decoding of the human genome" but the human genome project was initiated, largely funded, and directed by the U.S. government
Some entries are broad categories (e.g., "Nanotechnology"), while others are highly specific (e.g., "Extending the host range of a virus via rational protein design") which makes the list feel arbitrary. Why are "Standard model of physics" on the list but not other major theories of physics (e.g. QM or relativity)? Why aren't Neural nets on here?
I agree that the labeling of USG control is imperfect and only an approximation. I think it's a reasonable approximation though.
Almost all of the USG control labels I used were taken from Anderson-Samways's research. He gives explanations for each of his labels, e.g. for the airplane he considers the relevant inventors the Wright brothers who weren't government-affiliated at the time. It's probably best to refer to his research if you want to verify how much to trust the labels.
You may have detailed contentions with each of these labels but you might still expect that, on average, they give a reasonable approximation of USG control. This is how I see the data.
On the list of innovations feeling arbitrary:
I share this concern but, again, I feel the list of innovations is still reasonably meaningful. As I said in the piece:
Choices regarding which stage of development and deployment to identify as “the invention” of the technology aren’t consistent. The most important scientific breakthroughs are often made some time before the first full deployment of a technology which in turn is often done before crucial hurdles to deployment at scale are overcome. This matters for the data insofar as the labeling of the invention year and the extent of USG control aren’t applied consistently to the same stage of development and deployment. This should not be detrimental, considering it’s not clear what the crucial stage of development and deployment for AGI will be either.[6] Nevertheless, it makes the data less precise and more of an approximation.
(I was trying to get at something similar as your concern about "specific versus broad" innovations. "Early stage development versus mass-scale deployment" is often pretty congruent with "specific scientific breakthrough" versus "broad set of related breakthroughs and their deployment".)
The reason why many other important innovations are not on the list is mostly time constraints.
He gives explanations for each of his labels, e.g. for the airplane he considers the relevant inventors the Wright brothers who weren't government-affiliated at the time. It's probably best to refer to his research if you want to verify how much to trust the labels.
By that token, AI won't be government controlled either because neural networks were invented by McCulloch/Pitts/Rosenblatt with minimal government involvement. Clearly this is not the right way to think about government control of technologies.
I don't think it is clear what the "crucial step" in AGI development will look like—will it be a breakthrough in foundational science, or massive scaling, or combining existing technologies in a new way? It's also unclear how the different stages of the reference technologies would map onto stages for AGI. I think it is reasonable to use reference cases that have a mix of different stages/'cutoff points' that seem to make sense for the respective innovation.
Ideally, one would find a more principled way to control for the different stages/"crucial steps" the different technologies had. Maybe one could quantify the government control for each of these stages for each technology. And assign weights to the different stages depending on how important the stages might be for AGI. But I had limited time and I think my approach is a decent approximation.
Executive summary: Historical data suggests the US government has controlled about 28% of important technological innovations, with higher rates during wartime and for high-cost projects, indicating a significant but not dominant role in potential AGI development.
Key points:
Base rate of 28% for US government control of important innovations from 1880-2023, with no clear decline over time.
US share of global R&D funding has declined mildly from ~52% to ~39% since 1960, but impact on innovation control is uncertain.
US government control is 1.8x more common during war/cold war periods (35%) compared to peacetime (19%).
High-cost (billion-dollar) innovations are 1.6x more likely to be US government-controlled (38%) than lower-cost projects (24%).
Adjusting for likely high costs and geopolitical tensions, an illustrative base rate for US government control of AGI is 30-31%.
Data limitations and small sample sizes make these estimates exploratory; further research is needed for precise forecasts.
This comment was auto-generated by the EA Forum Team. Feel free to point out issues with this summary by replying to the comment, and contact us if you have feedback.
Will the US Government Control the First AGI?—Finding Base Rates — EA Forum
AI Use Note: Main body text entirely human written. Claude (Opus 4.8) helped develop models of animal life histories in the appendix.
Cross-posted from Good Structures.
Executive Summary
* Animal advocates sometimes make claims like “there are X of this animal...
“How long have you been v*g*n?”
This is one of the most common icebreakers at animal protection events. It’s a baseline assumption, and it mostly holds true: if you’re out advocating for animals not to be tortured or abused, realistically these days you are v**n, or close. And it makes for good conversation. It seems fairly safe to assume when you meet strangers.
But this assumption is hurting the movement in a way which we don’t always notice: someone new comes into the sp...
Summary
Back in November 2023 I posted here to launch Spiro and raise our first $198k. Two and a half years later this is an update and a fundraiser for the next step.
The short version: we've now reached over-5,900 people with TB preventive medicine, including over 3,000 children under five years old. Our early results have held up well an...
This research is exploratory and doesn’t aim to provide precise probabilities. This piece is most useful for other researchers, rather than people interested in bottom-line conclusions.
In order to forecast whether the US government (USG) will control the first AGI, it is useful to learn from historical trends in who controls important innovations. This could take the shape of a base rate, which one can then improve upon using considerations specific to the case of AGI.
I define ‘control’ as roughly the US government’s ability to take at least 50% of important development and deployment decisions.
Learning from historical cases is difficult because their similarity to AGI and their historical circumstances vary widely. In this piece, I explore how to do this well by constructing a base rate and exploring four factors that might suggest significantly changing this base rate:
Whether the base rate of USG-controlled innovations has declined over time
Whether the US share of global R&D activity has declined over time (as another proxy for whether USG-controlled innovation has declined)
Whether the base rate of USG-controlled innovations is significantly different in war/cold war than in peacetime
Whether the base rate of USG-controlled innovations is significantly different for billion-dollar technologies than less expensive technologies
I find that factors 3 and 4 are most important to inform forecasts on USG control over AGI.
Findings
I estimate a naive base rate of 28% for USG control over important innovations.
I use historical case data on innovations and who controlled them collected by Bill Anderson-Samways. This data includes 27.5 important innovations, such as the computer and the first synthetic virus, spanning the years 1886 to 2023.
My data is of a limited sample size and has some flaws. My use of this data should be viewed as making exploratory approximate guesses. This is more useful as input into further research than to form immediate conclusions.
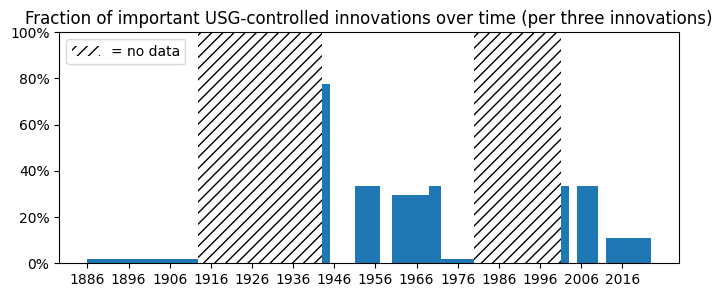
(Factor 1) I could not find a clear decline in USG-controlled innovation over time.
This question may be asked because the huge USG investments in the Manhattan and Apollo projects seem to lack an analog today. But, plotting my limited case data, I could not see a clear downward trend in USG-controlled innovation over time.
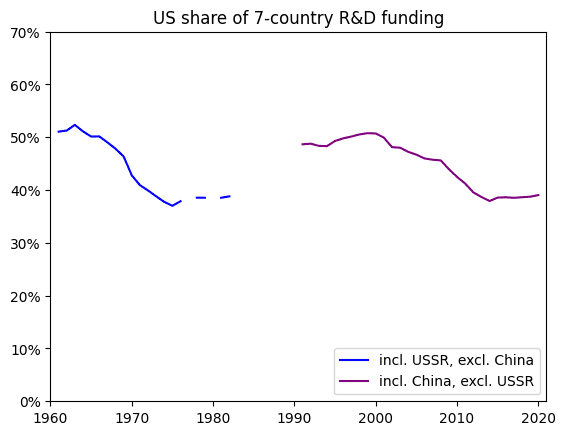
(Factor 2) I only found an uncertain, mild decline in the US share of global R&D activity.
I further investigated claims of declining USG-controlled innovation by investigating whether the US share of global R&D activity has declined (as a proxy).
Using R&D funding data starting in 1960, I only found a fluctuating, mild decline in the US share (could be 5-10 percentage points) that could be confirmed with more and better data.
(Factor 3) USG-controlled innovation may be 1.8x more common in war/cold war than in peacetime.
In my case data, the fraction of USG-controlled innovations during war/cold war is higher than in peacetime. I estimate base rates of 35% and 19% respectively.
To illustrate what this means for AGI, I estimate the base rates of USG control in example cold war and peaceful scenarios at 30% and 20% respectively.
(Factor 4) Billion-dollar innovation projects may be 1.6x more commonly USG-controlled than less expensive innovations.
GPT-4 cost $780 million in hardware and models continue to scale. AGI might be more similar to other high-cost inventions rather than, say, low-cost academic research.
I estimate USG control base rates for billion-dollar innovations compared to less expensive innovations at 38% and 24% respectively. I counted innovations as high-cost if their cost as a fraction of GDP at the time would be above a billion dollars using the same fraction of today’s GDP.
If one puts three times more weight on high-cost cases, the overall base rate of USG control over innovations becomes 31%.
An Aside: USG-Controlled Innovations May Be Completed by a Contractor in Only 22% of Cases.
Contractors are often involved in USG-controlled innovations. This is relevant since it may lead to a different governance structure with the USG having less unilateral control.
But I estimated that only 22% of USG-controlled innovations were brought to their final completed form by a contractor, meaning that most of the time, the USG is the only actor immediately capable of producing the final technology.
Acknowledgments
I’m thankful to Christian Ruhl for mentorship and guidance throughout this research project. I’m thankful to Rose Hadshar, Orsolya Dobe, Oscar Delaney, and other Pivotal Fellows for feedback on drafts. All mistakes are my own. I’m thankful to the Pivotal Research Fellowship for enabling and funding this research project.
Introduction
In order to prepare for the governance of artificial general intelligence when it arrives, it is crucial to forecast when and how it will arrive. Crucial pieces of information include in which year AGI will be developed, in what country, by which developers, with which decision-makers, etc. All this can help the AI governance field prepare to influence the governance of AGI positively. In this piece, I aim to contribute to forecasts on whether the US government (USG) will control the first AGI.
My research doesn’t hinge on the precise definition of AGI one uses, but a useful definition can be found in this Metaculus question.[1] By control, I roughly mean the US government’s ability to take at least 50% of important development and deployment decisions.
In order to forecast whether the USG will control the first AGI, one may want to look at historical data on who controlled important innovations. This can establish a base rate of USG control over important innovations which one can then improve upon using knowledge about today’s situation, US government, and the particular case of AGI.
Forming a base rate from historical case data is difficult due to there being few innovations comparable to AGI and widely varying circumstances at the time of these innovations. E.g., many important innovations were made during the Industrial Revolution in the 19th century but how much can we learn from those very different times about today’s chance of USG control over a new innovation?
In this piece, I explore four factors one might take into account when using historical cases to forecast USG control over AGI:
Whether the fraction of USG-controlled innovations has declined over time
Whether the US share of global R&D activity has declined over time (as another proxy for whether USG-controlled innovation has declined)
Whether the fraction of USG-controlled innovations is significantly different in war/cold war than in peacetime
Whether the fraction of USG-controlled innovations is significantly different for billion-dollar technologies than less expensive technologies
(One could use these factors to inform a historical base rate of USG control over innovations or use them for Bayesian updates to a prior. My work should be useful whatever methodology one uses.)
Each of these factors a priori could quite change what history tells us about how often the USG controls important innovations. In my investigation, I find that factors 3 and 4 are most significant.
This research is exploratory and doesn’t aim to provide precise probabilities. The historical case data I use is of a small sample size and has limitations that I will explain in the next section. Thus, my contribution is identifying rough trends and providing input for larger forecasting efforts which then may provide precise probabilities. This piece is most useful for other researchers, rather than people interested in bottom-line conclusions.
I Estimate a Naive Base Rate of 28% for USG Control Over Important Innovations
I will start by establishing a simple base rate from historical data without any modifications. That is, what fraction of important new technologies are developed under USG control? (Or, conversely, how often does any other government, company, academic lab, or other actor control important new technologies?)
“Important” technologies here should be defined in a way that selects technologies that are as similar to AGI as possible so that they may have some predictive value for AGI. I will use historical case data (1880-2023) compiled by Bill Anderson-Samways.[2] He includes three categories of technologies which one might expect to be similar to AGI:
General-purpose technologies—a single generic technology that initially has much scope for improvement and eventually comes to be widely used, to have many uses, and to have many spillover effects across the world economy[3]
Ambitious technologies that a serious STEM field has successfully explicitly tried to develop
Key dual-use technologies—technologies with both beneficial and harmful uses, and in particular, civilian (peaceful) and military (hostile) applications
Here is an extract from the case data to get a feeling for the data:
All 27.5 cases identified by Anderson-Samways, as well as tweaks I chose to make, can be found here. Two important limitations of this data are:[5]
The sample size is small.
Choices regarding which stage of development and deployment to identify as “the invention” of the technology aren’t consistent. The most important scientific breakthroughs are often made some time before the first full deployment of a technology which in turn is often done before crucial hurdles to deployment at scale are overcome. This matters for the data insofar as the labeling of the invention year and the extent of USG control aren’t applied consistently to the same stage of development and deployment. This should not be detrimental, considering it’s not clear what the crucial stage of development and deployment for AGI will be either.[6] Nevertheless, it makes the data less precise and more of an approximation.
Therefore, my use of this data should be viewed as making exploratory approximate guesses. These guesses should be confirmed with more/better data if one wishes to make an actual probabilistic forecast.
Defining ‘control’: Control over the first successfully developed AGI could rest with only a single developer or be shared between multiple parties. Roughly speaking, I define USG control as the US government’s ability to take at least 50% of important development and deployment decisions immediately preceding the first successful AGI development and deployment. This definition is not met, for example, by the current regulatory control the USG holds over AI development and deployment. However, this definition includes joint AGI projects with private firms or other countries as long as the USG holds at least half the decision-making power. The USG also does not need to have sole intellectual property rights to meet the definition.
Naive base rate: 28%
(I class 7.7 of the 27.5 technologies as developed under sole or joint USG control. Some technologies were developed by multiple actors in varying governance structures, hence the decimal. All data and all tweaks I made compared to Anderson-Samways’s data can be found here. When comparing to Anderson-Samways’s work, note also that I solely focus on US government control whereas Anderson-Samways includes other allied governments.)
So the chance that AGI will be first developed under USG control could be naively estimated at 28%. Note that this is conditioning on AGI indeed being achieved at some point. Further, note that such a base rate is not very useful in and of itself as a probability estimate, since it neglects any considerations unique to the case of AGI and today’s time and US government. For example, it neglects facts about today’s competitiveness of different players in AI development, such as the Chinese government.
I will now turn to the four factors that might suggest significantly changing this base rate (or, if one doesn’t use a base rate for forecasting, which should at least change how one takes into account historical case data).
Factor 1: I Could Not Find a Clear Decline in USG-Controlled Innovation Over Time
An immediate question one might have is whether the base rate of USG-controlled innovation has declined over time. This question may come up in connection with the Manhattan and Apollo programs which were giant projects taking up 0.3%[7] of US GDP and which seem to lack an analog today.
However, plotting the fraction[8] of USG-controlled innovation over time using my case data, a downward trend isn’t obvious:
(Each bar shows the fraction of USG control for three innovations. The width of the bar shows which years the three innovations happened in.)
The peak around 1945 might be considered an outlier. So, at least at a first approximation, the share of innovations controlled by the USG doesn’t seem to have fallen very much.
Factor 2: I Only Found an Uncertain, Mild Decline in the US Share of Global R&D Activity
The data used above is of a small sample size. It’s hard to be confident there really is no declining trend, especially given claims to the contrary in the literature.[9] Another way to investigate if USG-controlled innovation may have declined is to use as proxies the (potentially declining) total US share of global innovation and the government-controlled share of US-internal innovation. Here, I will only investigate the former.
There exist extreme claims about the falling US share of global R&D which appear to be misleading. A 2022 report by the US Congressional Research Service claims the US share of global R&D has fallen from 69% to 31% from 1960 to 2020 (they use R&D funding as a proxy).[10] The extreme 69% estimate seems to be a misreading of a diagram from a 1997 Department of Commerce report.[11] The diagram in fact states an estimated 69% US share of G7R&D funding. It also states this share “as a percentage of GDP”which does not seem to make much sense.
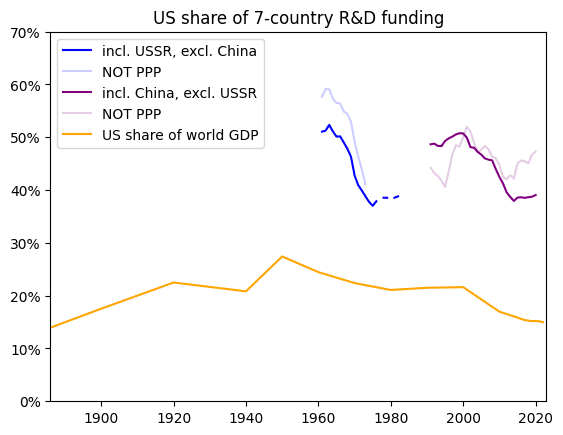
In trying to come up with my own number, I arrived at a 52% US share of R&D funding out of seven of the world's ten largest economies at the time.[12] To make this comparable to 2020, I again used seven of the ten largest economies in 2020.[13] My estimates never excluded a top-five global economy (checked at every half decade).[14]I arrived at a US share of R&D funding of 39%, so 13 percentage points lower than my 1961 estimate.[15] More details on my calculations can be found in Appendix A.
A timeline of estimates I arrived at in this way can be seen below. A few years with incomplete available data are interpolated.
Overall, this suggests a less dramatic downward trajectory of the US R&D share than suggested by the Congressional Research Service.Unfortunately, the current data is too incomplete with respect to years and too fluctuating to draw a strong conclusion. Note also that R&D funding is an imperfect proxy for R&D outcomes/performance. Specifically, R&D funding is an imperfect proxy for the important innovation outcomes we care about; for example it also includes funding for developing new skincare products or ice cream flavors. Other measures are sometimes used to supplement R&D funding data for international comparisons, such as data on technological exports or patents.
With better and more complete data it may be possible to determine how much the base rate of USG-controlled innovation changes with the US share of global R&D. Whether the US performs, say, 50% or only 40% of global R&D might still have a noticeable effect. I suggest an approach to quantify this effect in Appendix B.
An Aside: USG-Controlled Innovations May Be Completed by a Contractor in Only 22% of Cases
Contractors are often involved in USG-controlled innovation. The main aim of this piece is helping to forecast whether the USG will control the first AGI. Although this does not directly contribute to that aim, it may be useful to also forecast whether an AGI project would be completed by a contractor since this may lead to a different governance structure and decision-makers for the technology. E.g., contractors often have intellectual property rights for technologies they develop.[16] I will here briefly give an indication of differing base rates of innovations completed by contractors versus innovations completed internally in the USG.
In reality, many projects are in between fully USG-owned and contracted-out. E.g., a contractor may do most of the R&D but maintain active communication and exchange of ideas with a technical office in the USG which manages this contract. For the purposes of this categorization, an innovation is USG-owned if US government employees brought the innovation to its final completed form. This means that no other actor should have the immediate ability to reach this completed innovation and shifts control more unilaterally to the USG.
I consider developers US government employees if they were considered to be primarily working for the government. E.g., people employed in the Manhattan Project were considered to be primarily working for the government, despite other affiliations. In contrast, people working on the ENIAC, a predecessor of the computer, at the University of Pennsylvania under military contract were considered to be primarily academics. I made these judgments quickly and the resulting base rates should only be considered exploratory guesses. Note also the small sample sizes of 6.04 and 1.67 innovations completed internally in the USG versus innovations completed by contractors, respectively.
Innovations completed internally in the USG base rate: 22%
(6.04 cases out of 27.5 total. The full data can be seen here.)
Innovations completed in USG contracts base rate: 6%
(1.67 cases out of 27.5 total. The full data can be seen here.)
Innovations completed in contracts out of USG-controlled innovations base rate: 22%
(1.67 cases out of 7.71 total.)
Factor 3: USG-Controlled Innovation May Be 1.8x More Common in War/Cold War Than in Peacetime
Several important technologies have been developed as a direct result of wartime, e.g., the Manhattan Project was triggered by World War II. Similar expenditure in the vicinity of 0.3%[17] of US GDP would be unprecedented outside of war and cold war.[18] To be more precise, we can create two base rates by splitting the reference cases into war/cold war and peacetime.
I will count as war/cold war World War I, World War II, and the Cold War since other wars the US fought in were less existential to the country.[19] (I would have considered also including immediate post-war years but there are actually no reference cases in immediate post-war years so this is irrelevant.)
Base rate of technologies developed with USG control in war/cold war: 35% (Out of 15.5 important technologies developed in this time, 5.37 were USG-controlled. The full data can be seen here.)
Base rate of technologies developed with USG control in peacetime: 19% (Out of 12 important technologies developed in this time, 2.33 were USG-controlled. The full data can be seen here.)
Note the small sample sizes which make these base rate estimates less reliable. Another concern is that the wartime/peacetime distinction essentially just splits the data into two time windows: (1) beginning of WW1 to end of the Cold War and (2) all other years. Wartime/peacetime is certainly a big difference between these two time windows but other explanations for the differing base rates could be put forth. Still, considering that many USG-controlled wartime innovations had an explicit connection to war/cold war, this seems like the best explanation to me.
The question of how applicable the war/cold war and peacetime base rates are to the time up to AGI is a difficult one, especially with uncertain US-China relations. To illustrate simply, we can imagine two scenarios:
Peaceful scenario: There is peace for the next 10 years and a rate of 80% of peaceful years thereafter.
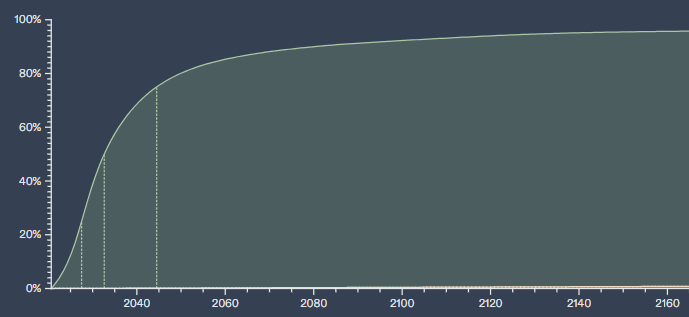
I use Metaculus forecasts on what year AGI might arrive to weight the next 10 years versus all other years.
(Cumulative Probability) Metaculus forecast on “When will the first general AI system be devised, tested, and publicly announced?”
I weight the next 10 years with 56% and all other years with 44% total. For this peaceful scenario, I obtain an illustrative base rate for USG-controlled innovations of 20%.[20]
Cold war scenario: There is (US-China) cold war for the next 10 years and a rate of 70% of peaceful years thereafter.
Using the same weights derived from Metaculus, I obtain an illustrative base rate for USG-controlled innovations of 30%.[21]
(Further work could construct more complicated “conditional trees,” as suggested by Karger et al. in Improving Judgments of Existential Risks: “A conditional tree takes a final Outcome [...] and divides that probability into a sequence of conditioning nodes that posit short-term precursors that have maximal projected impact on the final outcome.”[22] Identifying such conditions with maximal impact and quantifying their probabilities more seriously than is done here would help forecast different scenarios of USG control over AGI.[23])
Factor 4: Billion-Dollar Innovation Projects May Be 1.6x More Commonly USG-Controlled Than Less Expensive Innovations
The difference between massive-scale billion-dollar projects like the Manhattan Project and small academic research is stark. Current AI innovation largely happens at highly-funded private companies due to intense compute resource costs. E.g., GPT-4 is estimated to have required $780 million in hardware costs.[24] Compute used to train AI is currently expanding at a rate of approximately 4x per year and this trend seems feasible to continue at least through 2030.[25] Thus the first AGI project might be more similar to other high-cost innovation projects.
I split the reference cases into high-cost versus low-to-medium-cost technologies. Crucially, I only considered the cost incurred to the party that brought the innovation to its final completed form. Such costs are often low, for example, in biotechnology where there are no prohibitive start-up and equipment costs. They are currently high in AI where cutting-edge research requires costly compute resources.
To make costs comparable across time, I converted costs to a fraction of GDP at the time, and considered if the cost would be in the billions today (using the same fraction of today’s GDP).[26] This means I truly single out projects that took up a significant fraction of the economy at the time, even if the economy was much smaller than today’s economy in absolute terms. (The US economy in 1886, the start of my reference case data, was about 2% the size of the US economy in 2020.[27])
The cases mostly neatly separated into costs over a billion dollars and costs up to the low hundreds of millions. There was only one case in the high hundreds of millions, which was the Internet/ARPANET at around $675 million. The full data and notes per case can be found here.
The estimates and conversions were done quickly and should be considered approximate guesses. Also, note the small sample sizes of 8 and 19.5 for high-cost technologies and low-to-medium-cost technologies respectively. Again, the base rates I calculate in this piece should be viewed as making exploratory guesses. These guesses should be confirmed with more/better data if one wishes to make an actual forecast.
Base rate of high-cost technologies developed with USG control: 38% (Out of 8 important high-cost technologies, 3 were USG-controlled. The full data can be seen here.)
Base rate of low-to-medium-cost technologies developed with USG control: 24% (Out of 19.5 important low-to-medium-cost technologies, 4.7 were USG-controlled. The full data can be seen here.)
(The higher base rate of USG control for high-cost development matches my expectations. There are overall fewer developers who can take on high-cost projects so the USG should make up a higher fraction of high-cost projects. Moreover, much of the most costly R&D is done due to war or geopolitical conflict, in which governments are naturally big players.)
I do not know whether the final push to achieve AGI will indeed require high costs on the part of the developer. However, based on current AI research costs, I would suggest putting a bit more weight on the high-cost cases. I don’t have a strong take on what weight is best, but perhaps three times as much weight on high-cost cases is reasonable.[28]
Illustrative new base rate: 31%
(formula, treating each high-cost case as 3 cases:[29])
3⋅8 cases43.5 cases⋅38%+19.5 cases43.5 cases⋅24%
Appendix A: Further Notes on Calculations of the US Share of Global R&D Funding
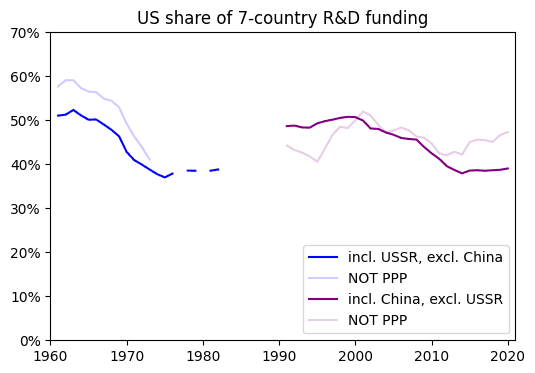
PPP versus exchange rates:
I also made estimates of the US share of global R&D funding using exchange rates instead of purchasing power parity as my tool for making the different currencies comparable:
However, the PPP estimates may be more useful since they account for differences across countries in how much research activity can be financed with a given amount of money.[30] R&D comparisons across countries usually use PPP.[31]
Further notes on my data processing for dates 1961-1982:
I arrived at per-country per-year estimates of R&D spending by multiplying R&D spending as a percentage of GNP by GDP. Since I am not interested in absolute numbers, only the US fraction of global R&D spending, I assume the difference between GNP and GDP isn’t crucial. I assume the ratio of GNP to GDP across countries is constant enough not to matter.
My GDP data is at PPP, so my per-country per-year estimates of R&D spending are at PPP as well.
For separate estimates using standard exchange rates instead of PPP, historical exchange rates were taken from MeasuringWorth.com. These were multiplied by per-country per-year current R&D spending in the national currency at the time (also taken from the National Science Board reports).
For the Soviet Union, no exchange rates are available since exchange was illegal to Soviet citizens. I instead again multiplied R&D spending as a percentage of GNP by GDP. GDP estimates are converted from constant to current value using GDP deflators from the Federal Reserve Bank of St. Louis.
Further notes on my data processing for dates 1991-2020:
For PPP estimates, the OECD provided the data already at PPP.
For estimates using exchange rates instead of PPP, I multiplied R&D spending as a percentage of GDP (data from the OECD) by GDP. GDP data was provided by the World Bank in current USD, already converted using exchange rates.
Appendix B: Suggested Approach to Quantify the Effect of the Declining US Share of Global R&D Activity
I described the work I have already done on the declining US share of global R&D activity in the corresponding section. This is not sufficient to quantify the effect this factor has on USG-controlled innovations.
Firstly, one needs more complete data. To put the current R&D data into perspective, here is my R&D data compared to all years I consider for my reference case data. I also plot the changing US share of world GDP for reference.[32]
If one obtains more complete data, one could compare the base rate of USG-controlled innovations (from my reference cases) during periods of high US R&D to the base rate during periods of low US R&D.
The current data is also imperfect in that it estimates the US share of R&D of only seven countries. Importantly, the seven countries’ share of world GDP varies over time. If one improved the data to hold the included countries’ share of world GDP roughly constant, this would produce a more robust fraction for the US share, which may be taken to approximate the US share of global R&D.
Abbreviated definition: “We will thus define ‘an AI system’ as a single unified software system that can satisfy the following criteria, all completable by at least some humans.
Able to reliably pass a 2-hour, adversarial Turing test during which the participants can send text, images, and audio files (as is done in ordinary text messaging applications) during the course of their conversation. An 'adversarial' Turing test is one in which the human judges are instructed to ask interesting and difficult questions, designed to advantage human participants, and to successfully unmask the computer as an impostor. A single demonstration of an AI passing such a Turing test, or one that is sufficiently similar, will be sufficient for this condition, so long as the test is well-designed to the estimation of Metaculus Admins.
Has general robotic capabilities, of the type able to autonomously, when equipped with appropriate actuators and when given human-readable instructions, satisfactorily assemble a (or the equivalent of a) circa-2021 Ferrari 312 T4 1:8 scale automobile model. A single demonstration of this ability, or a sufficiently similar demonstration, will be considered sufficient.
High competency at a diverse fields of expertise, as measured by achieving at least 75% accuracy in every task and 90% mean accuracy across all tasks in the Q&A dataset developed by Dan Hendrycks et al.
Able to get top-1 strict accuracy of at least 90.0% on interview-level problems found in the APPS benchmark introduced by Dan Hendrycks, Steven Basart et al. Top-1 accuracy is distinguished, as in the paper, from top-k accuracy in which k outputs from the model are generated, and the best output is selected
A third limitation is that there seem to be important omissions in the reference cases collected by Anderson-Samways. E.g., CRISPR, which is one of the most important breakthroughs in modern biology, isn’t included. The same goes for the F-35 stealth fighter project, which is a collaborative R&D project between nine countries costing billions of dollars. Anderson-Samways has good reasons for this to do with his methods of data collection but, nevertheless, this means not all the obvious important technologies are included in the data.
“By the time the Manhattan Project ended in 1946, it had cost the country nearly US $2 billion, about $33 billion in today’s money, the total equal to only about 0.3 percent of the 1943–45 gross domestic Product”, Smil (2022), p. 22.
I use fractions since I care about the fraction/base rate of USG-controlled innovations out of all innovations. For my purposes, I do not care about the absolute number of USG-controlled innovations.
“It used to be the case that the U.S. government had comprehensive influence over the activities of technology firms headquartered on American soil. National economic strength was the foundation of military strength, and national economic actors were presumed to be central to the pursuit of the military goals of the state. The firms developing strategic technologies were thus largely nationally bound, dependent on the state as R&D funders and customers, and thus naturally aligned with the state’s interests”, “The combined R&D budgets of the five largest U.S. defense contractors amounts to less than half of what companies such as Microsoft and Google spend on R&D in a single year [...] As such, technologies that are of critical importance to the state – such as robotics and cybersecurity – are being developed in the commercial information technology industry, and the defense industry are struggling to compete.
In practice, this has shifted control over the development and deployment of strategic technologies away from the state and towards these high technology multinational companies”, Leung (2019), p. 19 and pp. 24-25 respectively;
“This is markedly different from the historical research culture in areas like nuclear physics and cryptography which, for a time, were dominated by government-led, classified research efforts”, Fischer et. al (2021), p. 11;
“the technological capabilities of foreign firms have grown [...] Another indicator of the relative technological strengths of the U.S. and other industrial economies is the speed of adoption and level of utilization of advanced manufacturing technologies in the United States and elsewhere. Flamm (1988a) and others suggest that robotics technologies have been adopted more rapidly in such economies as Sweden, West Germany, and Japan and are utilized in greater numbers (on a per capita basis) in the manufacturing sectors of these nations than is true of the United States. This evidence of U.S. lags in adoption suggests that the gap between ‘best practice’ and ‘current practice’ in the United States may be greater than is true of other industrial economies. Still another indicator of the stronger performance of some foreign firms in commercializing and exploiting new technologies is the estimate by Clark et al. (1987) that Japanese automobile firms require one-half as much time to bring a new model to market as do U.S. automobile firms. Not only are many foreign competitors now technologically equal or superior to U.S. firms, they also have in some cases proved more adept at realizing the commercial returns to these technological capabilities”, Figure 8.1, Mowery & Rosenberg (1989), p. 208.
I included the Soviet Union in this estimate, which substantially lowers the US share, and had to exclude G7 member Italy for lack of data. My data comes from reports of the National Science Board, converted using OECD data on purchasing power parity between countries.
The seven countries I chose for my earlier estimates were in the top-ten global economies at every relevant half decade. The seven countries for my later estimates were in the top-ten global economies at every relevant half decade except Canada in 2010 (List of countries by largest historical GDP on Wikipedia).
“Intellectual property agreements are negotiated in advance, but DARPA usually will not prevent commercialization of intellectual property that results from their projects”,“Under the act, the contractor can opt to patent inventions if they so choose (subject to the Invention Secrecy Act). In any case, the USG retains at least a nonexclusive, nontransferable, irrevocable, paid-up license to use the invention for government purposes. Its rights to technical data depend on the funding structure: no restrictions on disclosure and use in the case of exclusive government funding (‘unlimited rights’); disclosure and use limited to within the USG in the case of exclusive private funding (‘limited rights’); or disclosure and use limited to government purposes, which generally include activities for which the government is a party, in case of mixed funding (‘government purpose rights’)”, Fischer et. al (2021), p. 14 and p. 15 respectively.
“By the time the Manhattan Project ended in 1946, it had cost the country nearly US $2 billion, about $33 billion in today’s money, the total equal to only about 0.3 percent of the 1943–45 gross domestic Product”, Smil (2022), p. 22.
“The Laser Interferometer Gravitational-Wave Observatory (LIGO) cost less than $33 million a year over 19 years of development [6]. The Human Genome Project took 13 years and spent the equivalent of $400 million a year in today’s dollars [49]. The Large Hadron Collider (LHC) at CERN took about 10 years to build, at an average cost of about $475 million per year [7,38]—though full operational costs are in excess of $1 billion per year [56]. Finally, the ITER fusion reactor is projected to average just under $2 billion per year during 12 years of construction [18]. Moreover, rather than single-country projects, the costs of these programs have each been shared among several countries [...] The F-35 stealth fighter program, for example, is projected to cost the United States around $16 billion annually over its 60-year lifespan” ($16 billion is about 0.06% of GDP in 2022), Levin & Maas (2020), pp. 1-2.
“GPT-4 has a slightly higher estimate of hardware acquisition cost, at $780M (90% CI: $390M to $1.6B)”, Epoch AI, on the tile titled “Hardware acquisition cost for the most expensive AI model”.
Costs per year are lower but in this section I will be dealing with the total costs of projects over multiple years.
“The consistent and predictable improvements from scaling have led AI labs to aggressively expand the scale of training, with training compute expanding at a rate of approximately 4x per year [...] Here, we examine whether it is technically feasible for the current rapid pace of AI training scaling—approximately 4x per year—to continue through 2030 [...] We find that training runs of 2e29 FLOP will likely be feasible by the end of this decade. In other words, by 2030 it will be very likely possible to train models that exceed GPT-4 in scale to the same degree that GPT-4 exceeds GPT-2 in scale”, Sevilla et al. (2024).
“Whereas nominal R&D intensity provides a measure of the burden (in monetary terms) on society of R&D activities, it is less informative about the real resources devoted to R&D because it does not take into account differences in relative prices of R&D inputs across countries. For this purpose, R&D-specific purchasing power parities (PPPs) are needed, which measure how much needs to be spent in a country to acquire one U.S. dollar’s worth of R&D inputs. Hence R&D expenditures that are converted at R&D PPPs will give a better measure of the differences in actual resources devoted to R&D between countries”, Dougherty et al. (2007), p. 292.


I like the idea, but the data seems sketchy. For example, the notion of "government control" seems poorly applied:
Some entries are broad categories (e.g., "Nanotechnology"), while others are highly specific (e.g., "Extending the host range of a virus via rational protein design") which makes the list feel arbitrary. Why are "Standard model of physics" on the list but not other major theories of physics (e.g. QM or relativity)? Why aren't Neural nets on here?
Thank you, these are good points!
On the notion of "USG control":
I agree that the labeling of USG control is imperfect and only an approximation. I think it's a reasonable approximation though.
Almost all of the USG control labels I used were taken from Anderson-Samways's research. He gives explanations for each of his labels, e.g. for the airplane he considers the relevant inventors the Wright brothers who weren't government-affiliated at the time. It's probably best to refer to his research if you want to verify how much to trust the labels.
You may have detailed contentions with each of these labels but you might still expect that, on average, they give a reasonable approximation of USG control. This is how I see the data.
On the list of innovations feeling arbitrary:
I share this concern but, again, I feel the list of innovations is still reasonably meaningful. As I said in the piece:
(I was trying to get at something similar as your concern about "specific versus broad" innovations. "Early stage development versus mass-scale deployment" is often pretty congruent with "specific scientific breakthrough" versus "broad set of related breakthroughs and their deployment".)
The reason why many other important innovations are not on the list is mostly time constraints.
By that token, AI won't be government controlled either because neural networks were invented by McCulloch/Pitts/Rosenblatt with minimal government involvement. Clearly this is not the right way to think about government control of technologies.
I don't think it is clear what the "crucial step" in AGI development will look like—will it be a breakthrough in foundational science, or massive scaling, or combining existing technologies in a new way? It's also unclear how the different stages of the reference technologies would map onto stages for AGI. I think it is reasonable to use reference cases that have a mix of different stages/'cutoff points' that seem to make sense for the respective innovation.
Ideally, one would find a more principled way to control for the different stages/"crucial steps" the different technologies had. Maybe one could quantify the government control for each of these stages for each technology. And assign weights to the different stages depending on how important the stages might be for AGI. But I had limited time and I think my approach is a decent approximation.