Comments
Thanks to our collaborators at MU and UCI for generating the sequencing data we analyze in this post, to the Grimm et al. (2023) authors for the analysis this builds on, and to Marc Johnson, Mike McLaren, Dan Rice, Will Bradshaw, Simon Grimm, and Evan Fields for feedback on the draft.
One key question in understanding the performance of metagenomic wastewater sequencing for pathogen detection is how deeply you need to sequence to see a pathogen spreading through the population. This depends on many things, but in our preprint Inferring the sensitivity of wastewater metagenomic sequencing for pathogen early detection (Grimm et al. 2023) we introduced a summary statistic RAi(1%): for a given pathogen and sequencing approach, what fraction of sequencing reads will be from the pathogen if 1% of people in the sewershed became infected in the past week?
The analysis in our preprint was based only on public sequencing data, and unfortunately most of it was generated from samples collected during the COVID-19 pandemic, which heavily suppressed most infectious diseases. For influenza in particular, CDC writes that "activity was unusually low throughout the 2020-2021 season", and correspondingly we didn't identify any sequencing reads from flu. This meant we were only able to use the data to generate an upper bound for RAi(1%). [1]
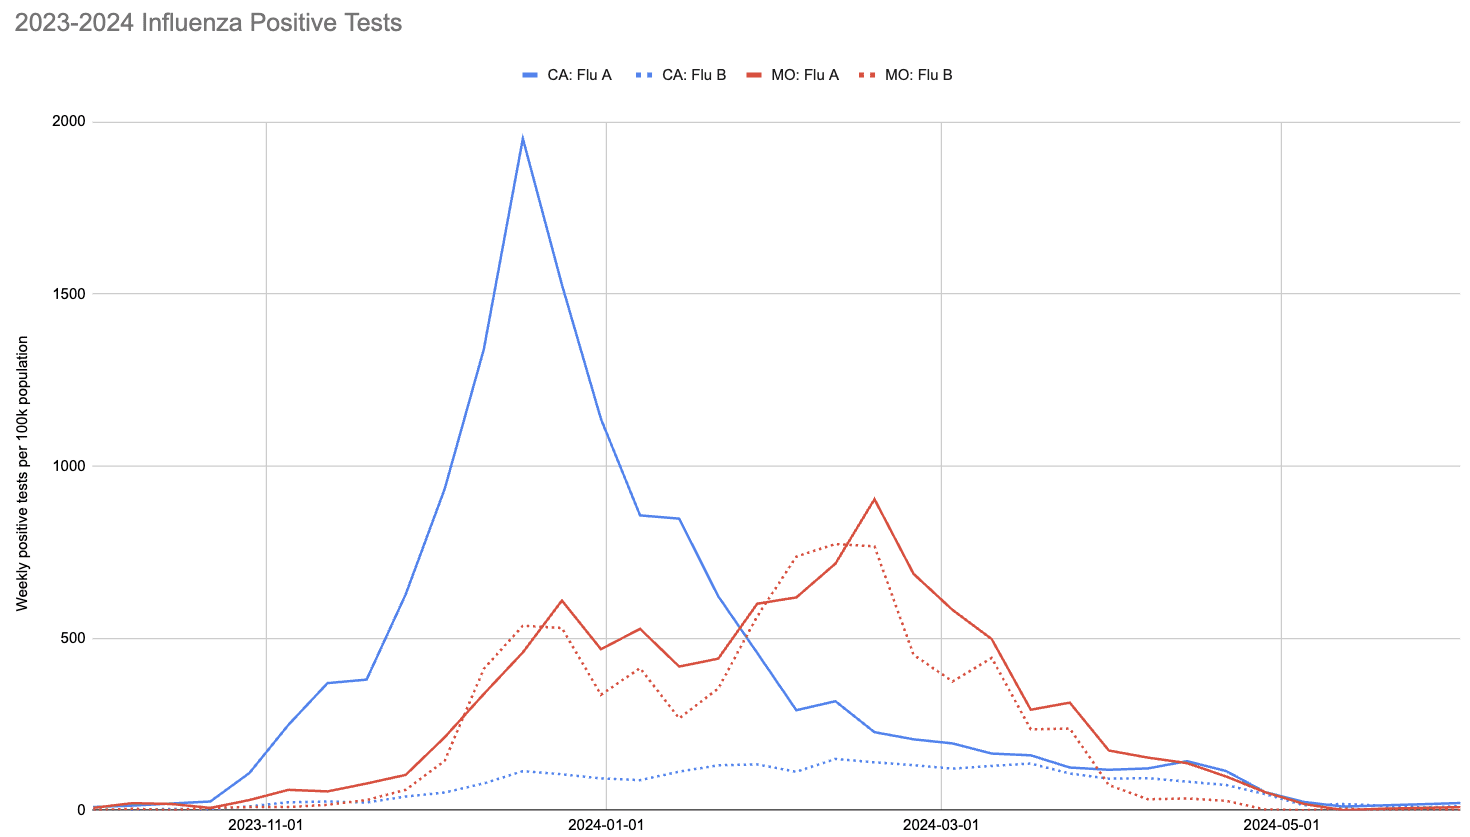
With society returning to pre-pandemic interaction levels, however, the 2023-2024 flu season did see a significant number of infections. This is visible in the following chart, showing CDC's count of positive tests for influenza in California and Missouri:
Two things to note about this chart:
We're interested in Missouri and California in particular because we've been collaborating with Marc Johnson and Clayton Rushford at the University of Missouri (MU) and Jason Rothman, then in Katrine Whiteson's lab at the University of California, Irvine (UCI) now a professor at the University of California, Riverside. They processed and sequenced wastewater influent, with the MU group sampling in central Missouri and the UCI group sequenced in southern California. The two groups each used their own metagenomic sequencing protocol to generate a combined 102B read pairs from samples collected between December 2023 and August 2024, which covers much of the 2023-2024 flu season. We limit our analysis here to the 79B read pairs from samples collected before May 2024, however, for three reasons:
We suspect people are much less likely to get tested for influenza outside core flu season, making conclusions drawn from test rates less reliable.
We see occasional influenza A reads in May and beyond, but positive tests fall to zero. This causes a problem when we try to correlate reads with tests because simultaneously observing non-zero reads and zero tests leads our model to overestimate sensitivity.
Outside of core flu season the proportion of influenza in wastewater that is from animal sources is likely higher.
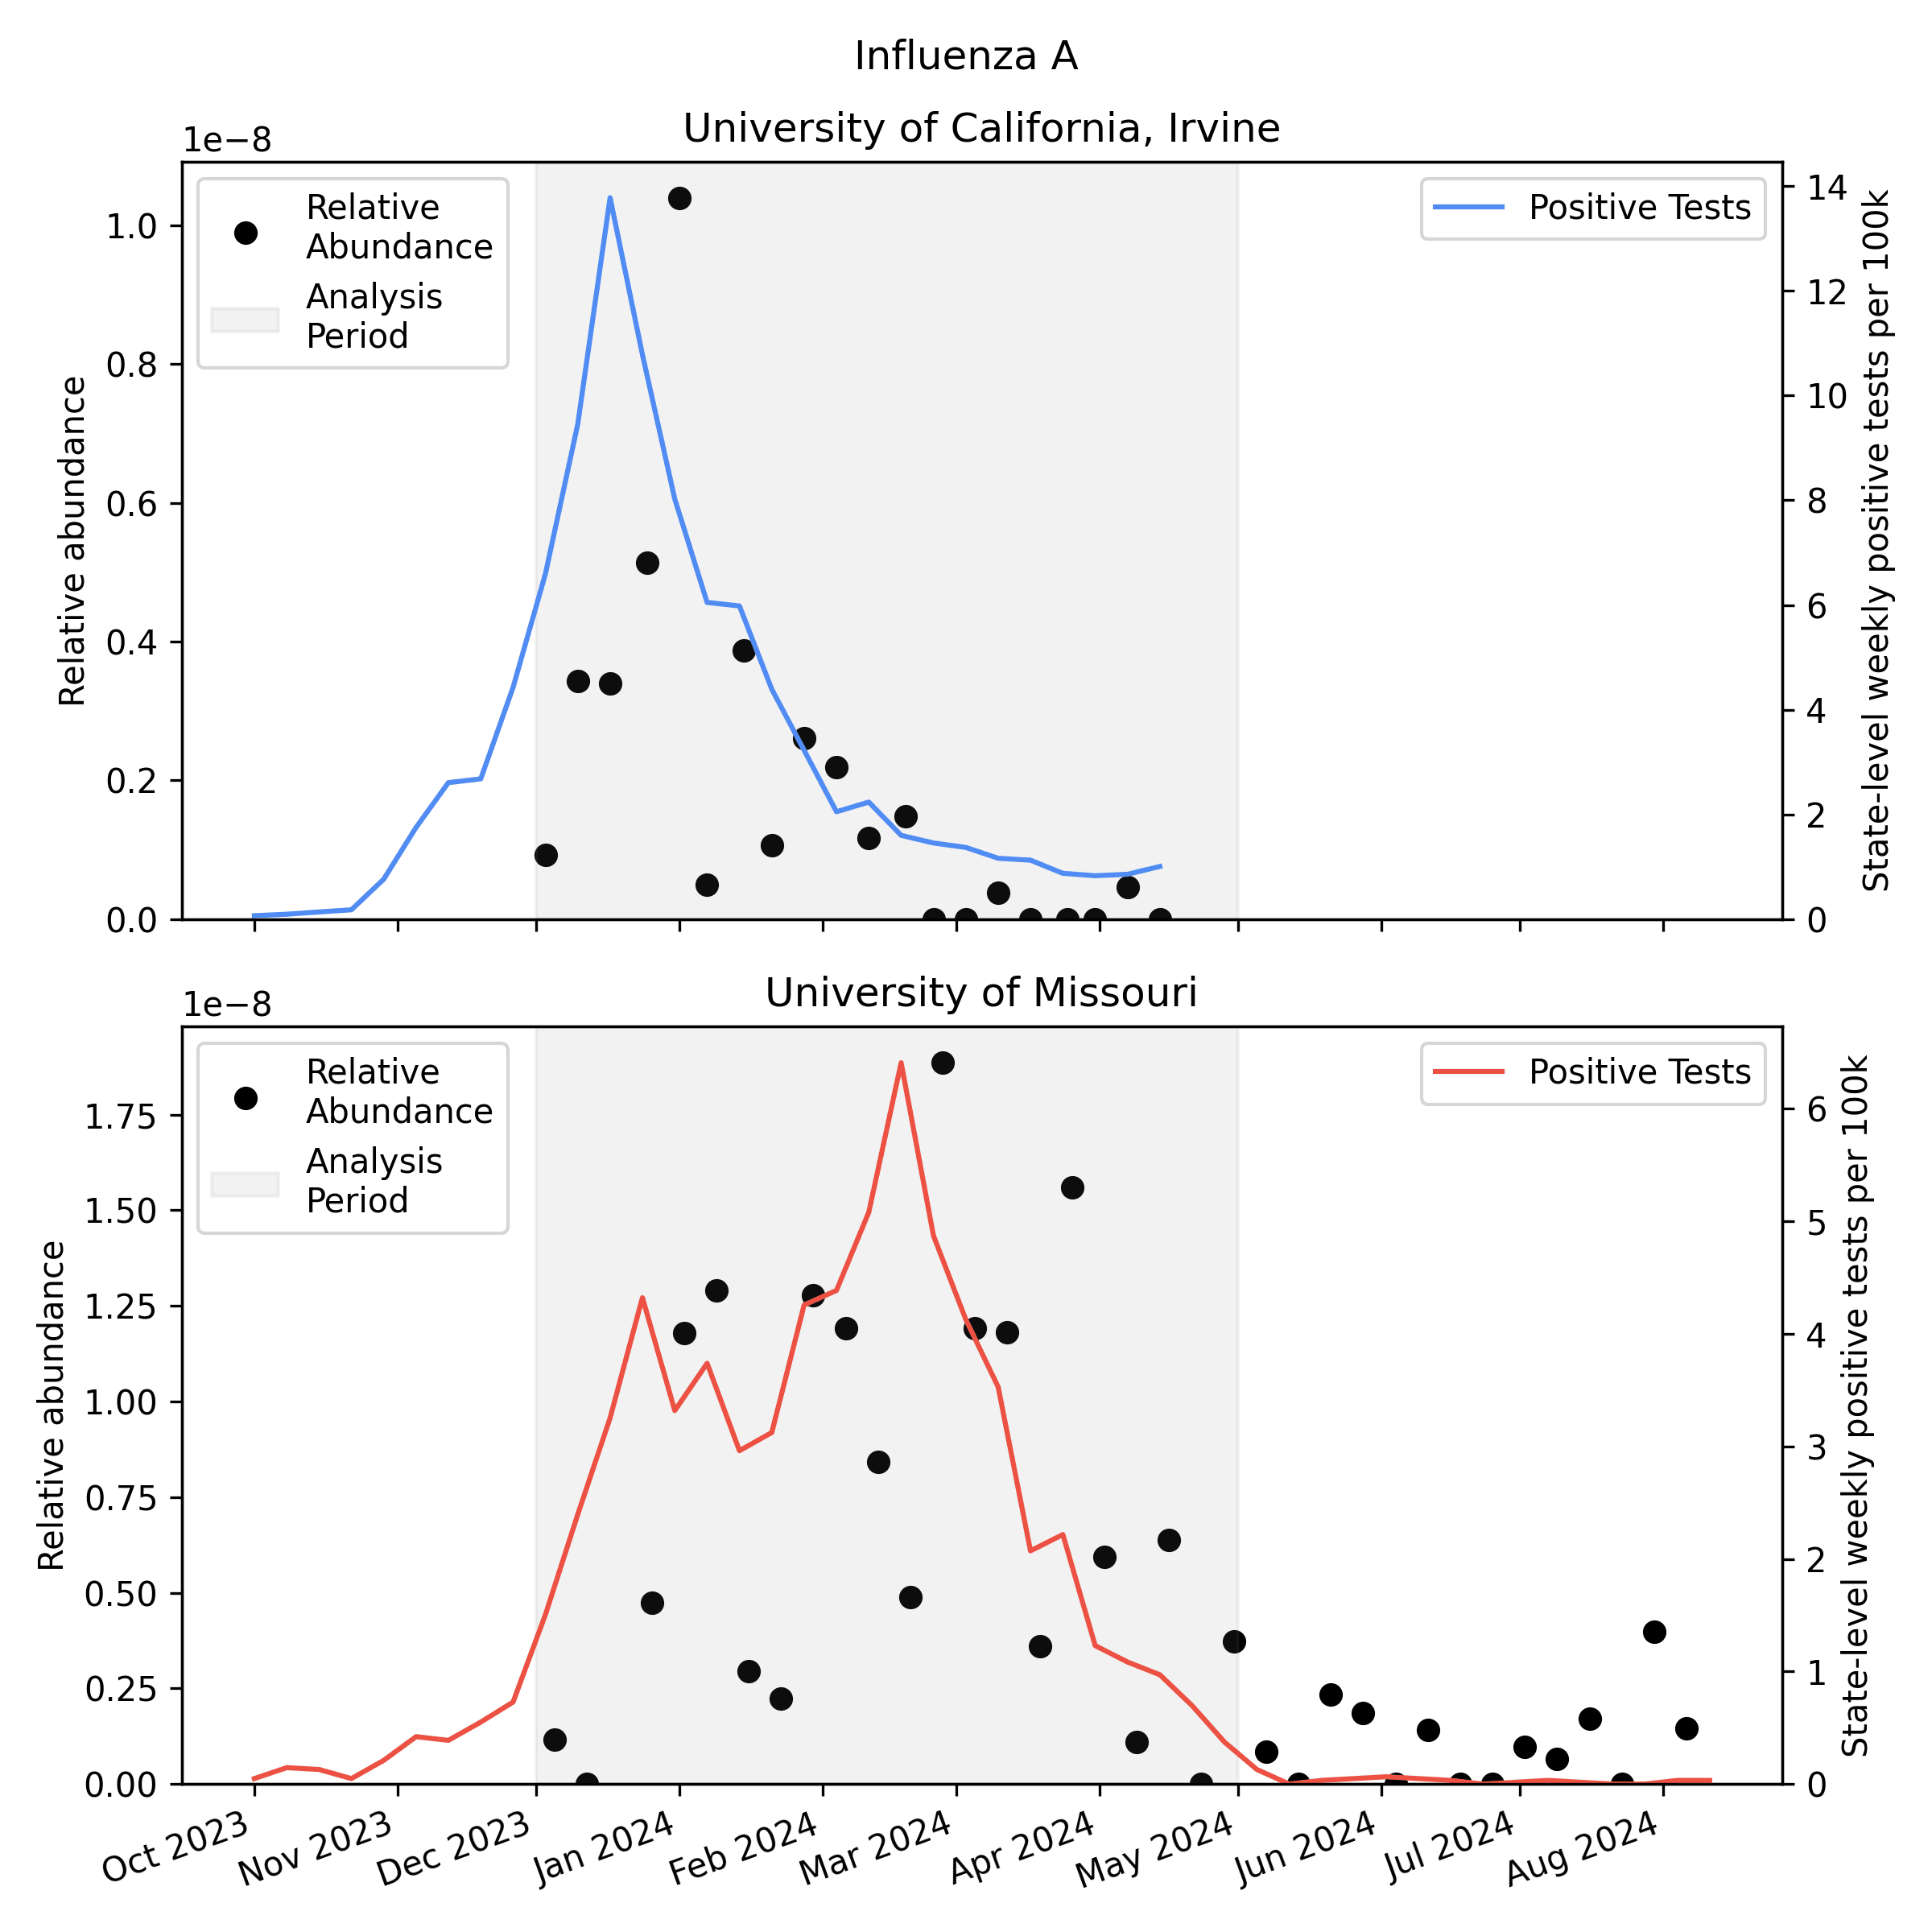
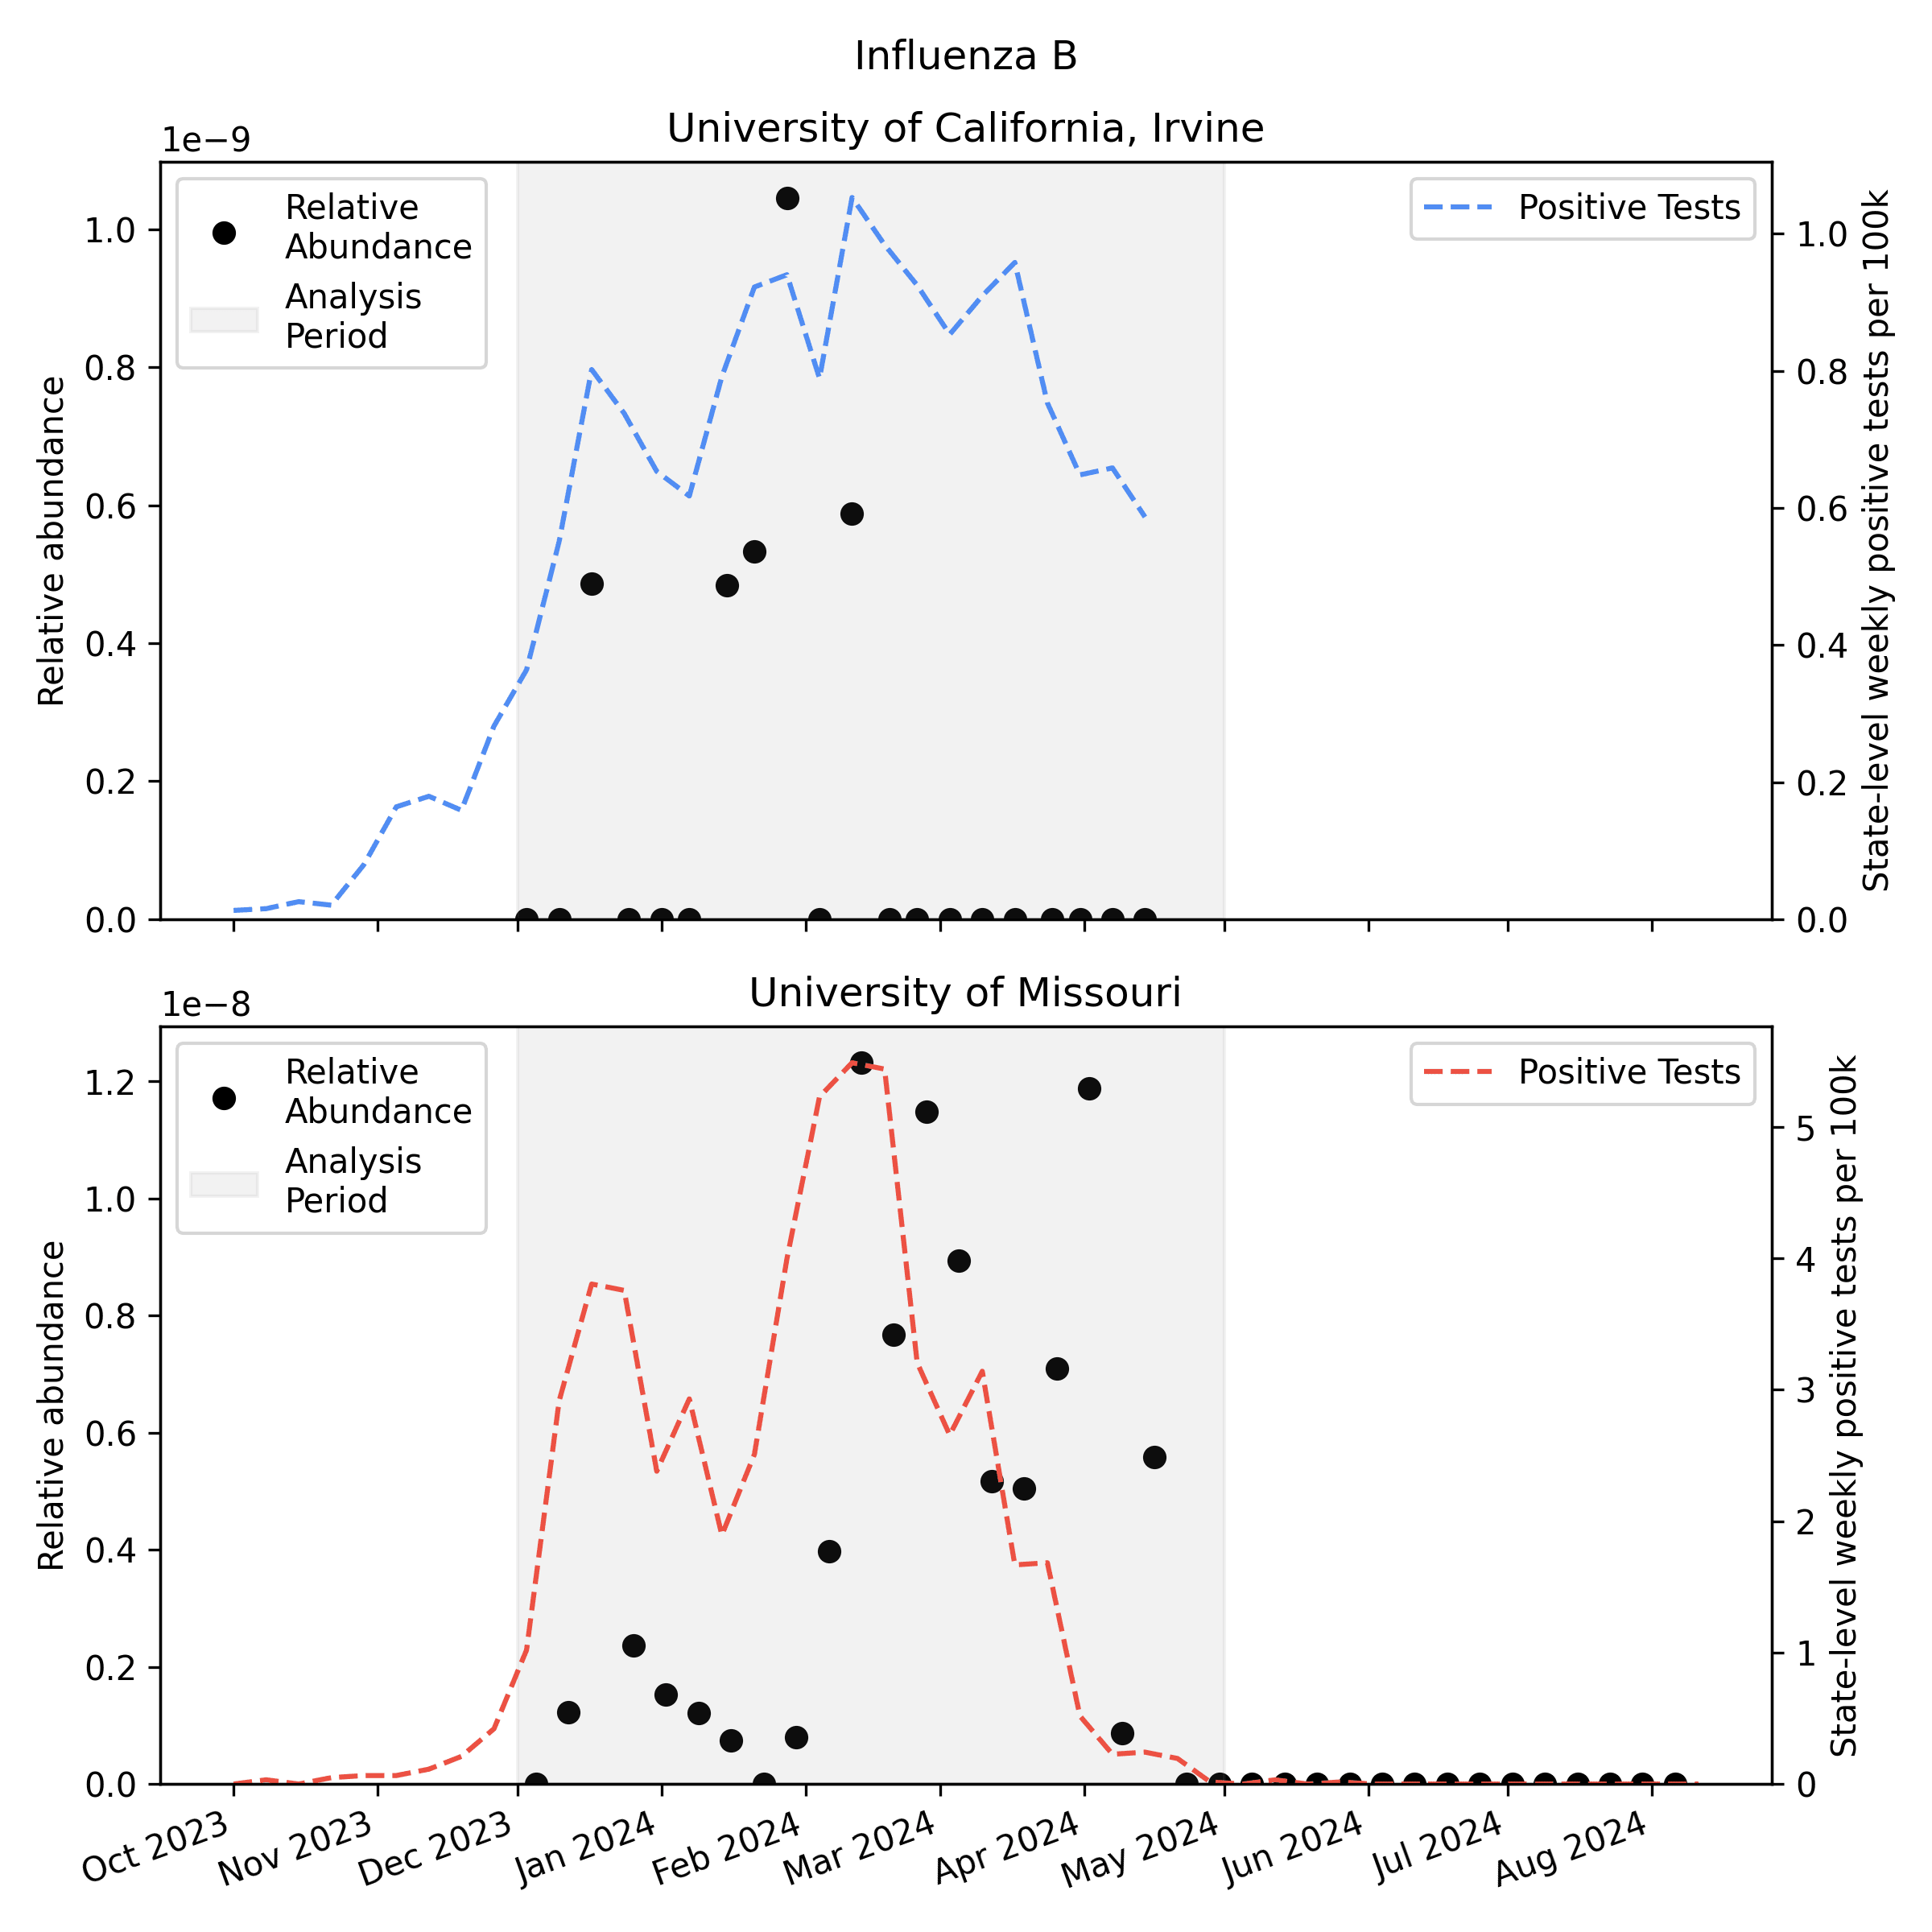
We analyzed the sequencing data with our v2 metagenomic sequencing pipeline, which uses BBDuk to quickly identify potential human viral reads, then validates them with Kraken2 and Bowtie2. This gives us per-sample estimates of relative abundance [2] for each human virus of interest. Here is the relative abundance we see in the sequencing data plotted against per-capita positive tests reported to CDC:
As you'd expect, we see more influenza in the wastewater at times when there are more positive tests, though the correlation isn't great. Because statewide positive tests are only a rough proxy for incidence in the specific monitored sewersheds it would be tempting to assume the inaccuracy of the proxy explains all of the difference, but it's likely that much of the variability here is noise in the metagenomic sequencing process.
One thing to notice is that CDC observed many more samples testing positive for flu A relative to flu B in California (where UCI collected samples), while in Missouri (where MU collected samples) they saw an approximately even split. This means the MU data can give us a good view of both Flu A and Flu B, while the UCI data is mostly useful for understanding Flu A sensitivity.
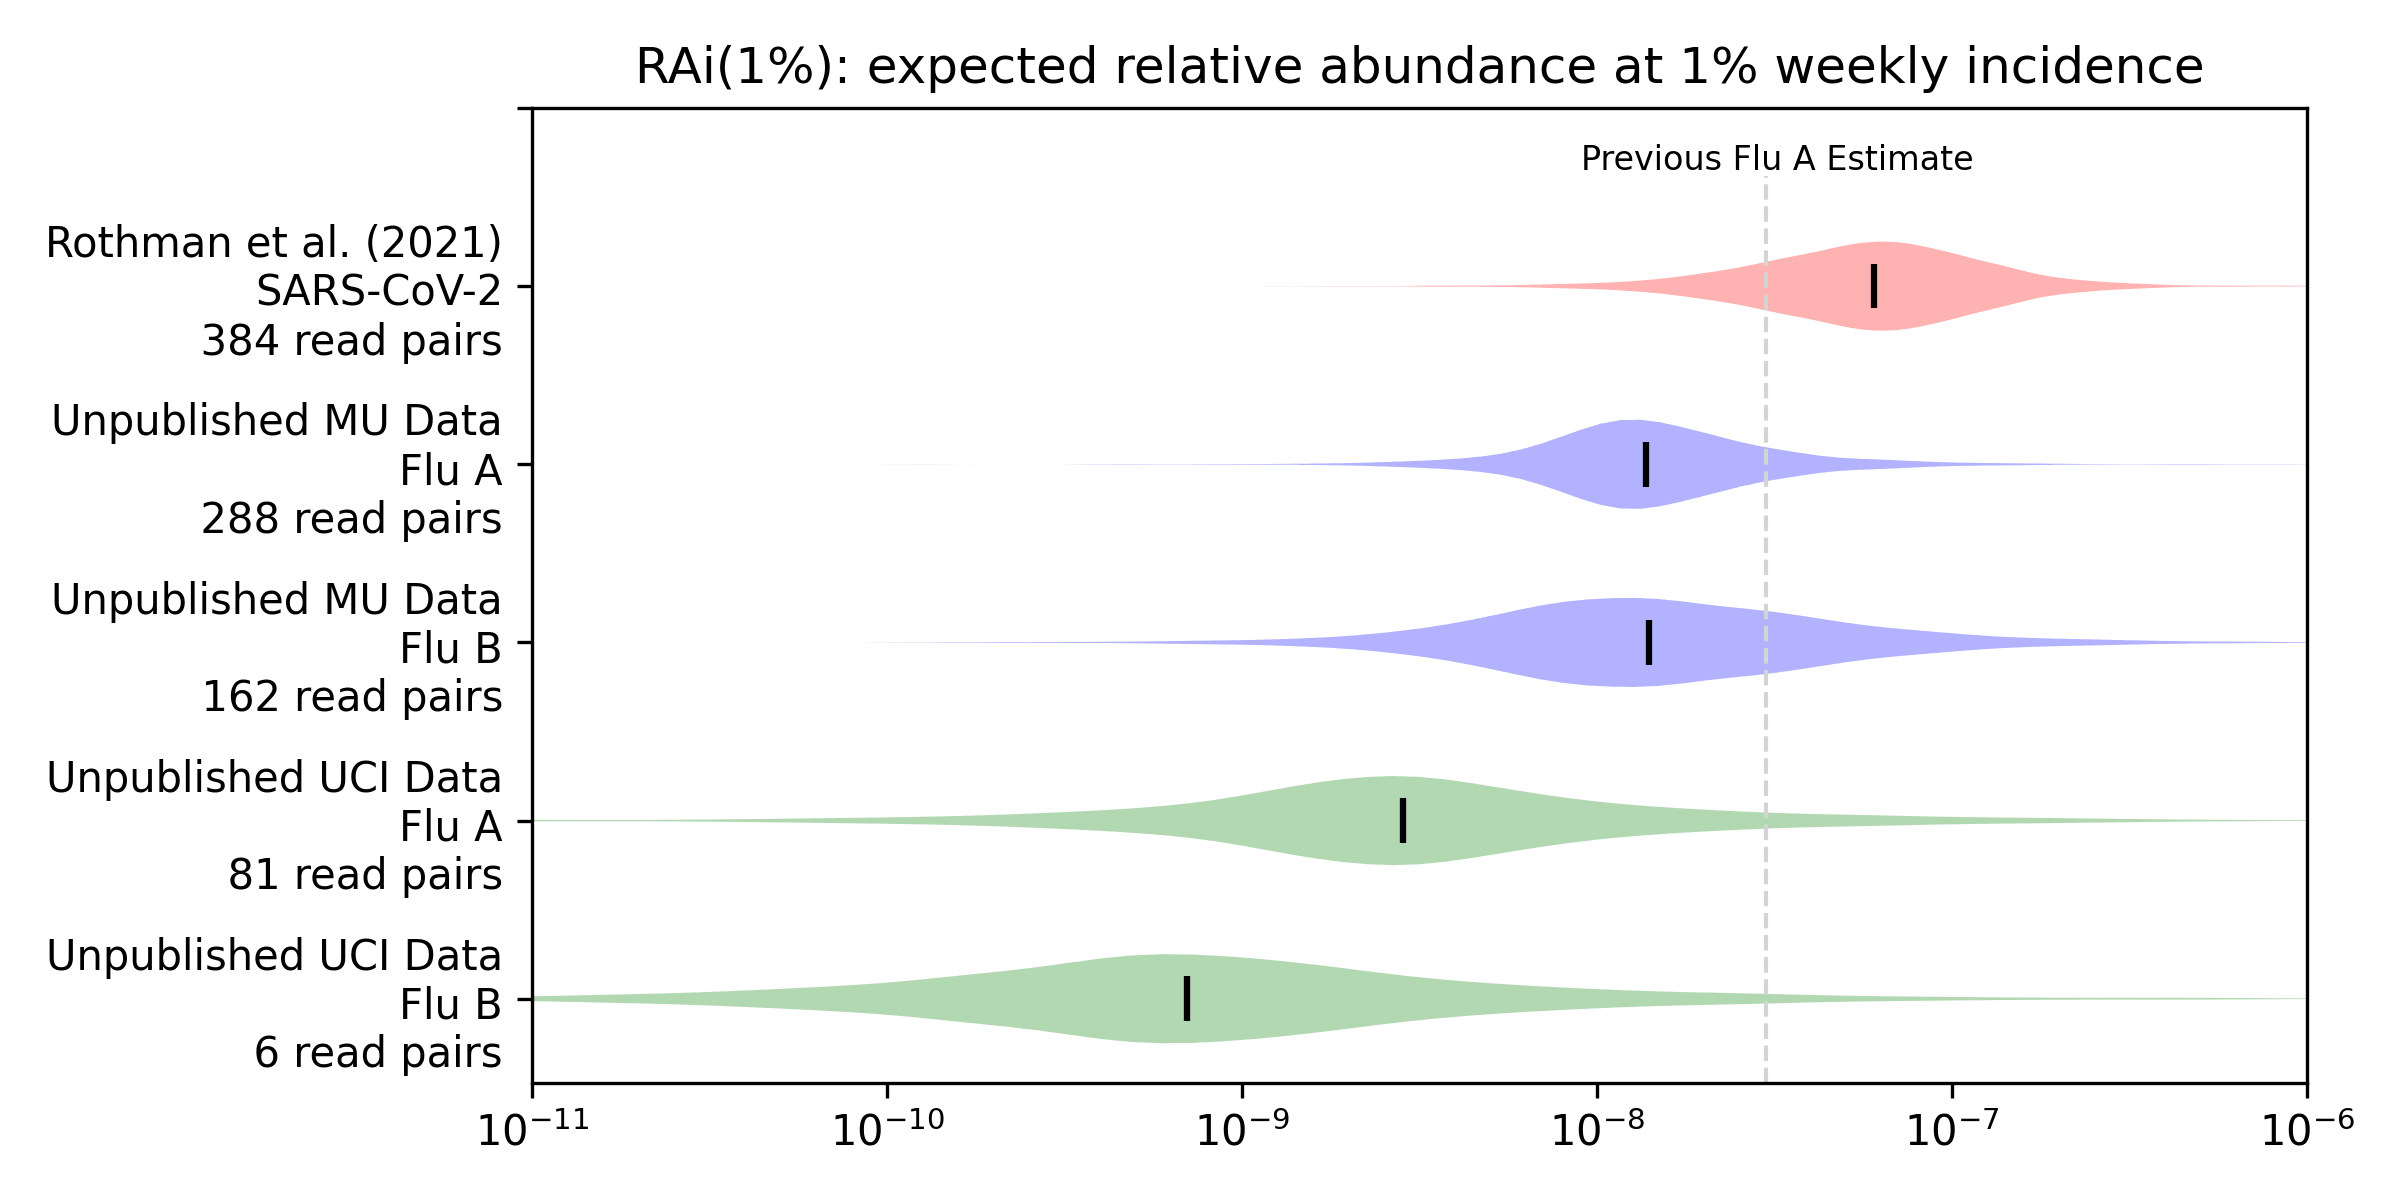
To get a more quantitative sense of the relationship between incidence and relative abundance we applied the methods from our preprint to this new data to estimate RAi(1%), the relative abundance we'd expect to see at 1% weekly incidence. We convert weekly positive tests to weekly incidence via an underreporting factor we derive in our preprint from CDC's flu burden estimates, and then compare the incidence with relative abundance using a Bayesian model. The model gives a posterior probability distribution for the RAi(1%) for each virus and sequencing protocol. Here's the Rothman et al. (2021) estimate for SARS-CoV-2 from our preprint, along with estimates for influenza A and B that we generate here for the unpublished MU and UCI data:
For example, our median estimate (vertical bars) of the influenza A RAi(1%) with MU sequencing (MU Flu A) is 1.4e-8. This is 23% of our preprint's median estimate of 6.0e-8 for SARS-CoV-2 with Rothman et al (2021) sequencing. Influenza B with MU sequencing has a similar median but more uncertainty, due a combination of fewer observations and worse correlation. The UCI data shows substantially lower relative abundance for influenza A (5% of the preprint's 6e-8), and lower again for influenza B (1% of the preprint's 6e-8).
In response to this work we plan to update our metagenomic biosurveillance simulator in two ways:
We'll switch the simulator’s RAi(1%) from using the mean of the distribution to sampling from the full posterior distribution. Because our posteriors sometimes span several orders of magnitude, this change should better capture our uncertainty.
We'll replace our preliminary influenza A RAi(1%) point estimate of 3.2e-8 with an option to choose each of the four above distributions, with medians of 1.4e-8, 1.4e-8, 2.8e-9, and 7.0e-10.
Overall we expect these changes to make our projections higher variance and somewhat less optimistic, but not to have a large impact on whether this approach to novel pathogen detection is practical. As we ramp up our sequencing going into the 2024-2025 infectious disease season we expect to be able to reduce this uncertainty further.
When we don’t observe any reads for a virus, our method can rule out very high—but not very low—RAi(1%). This upper bound decreases when there is high incidence in the community and when we have more total reads. ↩︎
We use this term to mean the number of high-quality unique read pairs assigned to a virus, as a fraction of all raw demultiplexed pairs produced by the sequencer ↩︎


Executive summary: Analysis of new wastewater sequencing data from the 2023-2024 flu season provides estimates of influenza detection sensitivity, showing lower relative abundance than previously estimated for SARS-CoV-2.
Key points:
This comment was auto-generated by the EA Forum Team. Feel free to point out issues with this summary by replying to the comment, and contact us if you have feedback.