Thanks for doing this and for sharing the code! It's really great to have reproducible models – I know how much work it can take to do this, and I appreciate you being willing to go through the labor. I have submitted a couple small PR's with documentation improvements.
I wanted to better understand what you were doing, so I looked at the NeurIPS Social. If I understand correctly: the value from this social comes from attendees increasing their research relevance from 0.206 to 0.2574, an increase of ~25%.
At first glance, a 25% increase just from a social seems pretty surprising; digging in further: the major difference appears to be this line:
(0.2 * 3 + (2 / 10) * 100)
Which I guess means that you are assuming that 103 participants had an increase of 0.2 QARYs. Is that right? If so I would be interested to hear more about where that number came from.[1]
Also, you are dividing all these numbers by 400, which makes me think that the numerator is the total amount of QARY increase, and there were 400 attendees, so you are dividing by 400 to get the average increase, but the parameters you chose for the gamma distribution result in an average number of attendees around 312. So my guess is that one of these numbers is off?
I dug into this a bit more; I am not at all confident that I'm understanding things correctly (my code is here) but I printed out a few sanity checks on the numbers:
Program
Cost (USD)
Benefit (counterfactual expected QARYs)
Cost-effectiveness (QARYs per $1M)
Attendees
Attendees (weighted)
QARYs/Attendee
Trojan Detection Challenge
65,000
21
320
210
65
0.098
NeurIPS Social
5200
150
29,000
310
680
0.49
NeurIPS Workshop
110,000
360
3200
590
1100
0.6
It continues to feel surprising to me that a social would cause 0.5 QARYs/attendee, but maybe there's something I'm missing (e.g. maybe you happen to know about a particularly valuable collaboration which was sparked at this event).
Cost-effectiveness of professional field-building programs for AI safety research — EA Forum
Cost-effectiveness of professional field-building programs for AI safety research
AI Use Note: Main body text entirely human written. Claude (Opus 4.8) helped develop models of animal life histories in the appendix.
Cross-posted from Good Structures.
Executive Summary
* Animal advocates sometimes make claims like “there are X of this animal...
“How long have you been v*g*n?”
This is one of the most common icebreakers at animal protection events. It’s a baseline assumption, and it mostly holds true: if you’re out advocating for animals not to be tortured or abused, realistically these days you are v**n, or close. And it makes for good conversation. It seems fairly safe to assume when you meet strangers.
But this assumption is hurting the movement in a way which we don’t always notice: someone new comes into the sp...
Summary
Back in November 2023 I posted here to launch Spiro and raise our first $198k. Two and a half years later this is an update and a fundraiser for the next step.
The short version: we've now reached over-5,900 people with TB preventive medicine, including over 3,000 children under five years old. Our early results have held up well an...
This post explores the cost-effectiveness of AI safety field-building programs aimed at ML professionals, specifically the Trojan Detection Challenge (a prize), NeurIPS ML Safety Social, and NeurIPS ML Safety Workshop.
We estimate the benefit of these programs in ‘Quality-Adjusted Research Years’, using cost-effectiveness models built for the Center for AI Safety (introduction post here, full code here).
We intend for these models to support — not determine — strategic decisions. We do not believe, for instance, that programs which a model rates as lower cost-effectiveness are necessarily not worthwhile as part of a portfolio of programs.
The models’ tentative results, summarized below, suggest that field-building programs for professionals compare favorably to ‘baseline’ programs — directly funding a talented research scientist or PhD student working on trojans research for 1 year or 5 years respectively. Further, the cost-effectiveness of these programs can be significantly improved with straightforward modifications — such as focusing a hypothetical prize on a more ‘relevant’ research avenue, or running a hypothetical workshop with a much smaller budget.
Program
Cost (USD)
Benefit (counterfactual expected QARYs)
Cost-effectiveness (QARYs per $1M)
Trojan Detection Challenge
65,000
26
390
NeurIPS ML Safety Social
5200
150
29,000
NeurIPS ML Safety Workshop
110,000
360
3300
Hypothetical: Power Aversion Prize
50,000
490
9900
Hypothetical: Cheaper Workshop
35,000
250
7000
Baseline: Scientist Trojans
500,000
84
170
Baseline: PhD Trojans
250,000
8.7
35
For readers who are after high-level takeaways, including which factors are driving these results, skip ahead to the cost-effectiveness in context section. For those keen on understanding the model and results in more detail, read on as we:
Contrast these programs with one another, and with funding researchers directly. (Read more.)
Consider the scalability and robustness properties of the model. (Read more.)
Disclaimer
This analysis is a starting point for discussion, not a final verdict. The most critical reasons for this are that:
These models are reductionist. Even if we have avoided other pitfalls associated with cost-effectiveness analyses, the models might ignore factors that turn out to be crucial in practice, including (but not limited to) interactions between programs, threshold effects, and diffuse effects.
The models’ assumptions are first-pass guesses, not truths set in stone. Most assumptions are imputed second-hand following a short moment of thought, before being adjusted ad-hoc for internal consistency and differences of beliefs between Center for AI Safety (CAIS) staff and external practitioners. In some cases, parameters have been redefined since initial practitioner input.
Instead, the analyses in this post represent an initial effort in explicitly laying out assumptions, in order to take a more systematic approach towards AI safety field-building.
Background
For an introduction to our approach to modeling – including motivations for using models, the benefits and limitations of our key metric, guidance for adopting or adapting the models for your own work, comparisons between programs for students and professionals, and more – refer to the introduction post.
2. The models’ default parameters are based on practitioner surveys and the expertise of CAIS staff. Detailed information on the values and definitions of these parameters, and comments on parameters with delicate definitions or contestable views, can be found in the parameter documentation sheet.
The full code for this project is in this repository. The `examples` folder includes documentation that demonstrates the repository’s use.
We have also published an evaluation of field-building programs for students, which you can find here.
In the cost-effectiveness in context section, we will compare these programs to various alternatives, including a hypothetical prize and workshop, as well as directly funding a talented research scientist or PhD student working on trojans research for 1 year or 5 years respectively.
Throughout, we will evaluate the programs as if they had not been conducted yet, hence we are uncertain about parameters that are ex-post realized (e.g. costs, number of participants). At the same time, parameter values often reflect our current best understanding from recent program implementations.
Definitions
Our key metric is the Quality-Adjusted Research Year (QARY)[1]. We define a QARY as:
A year of research labor (40 hours * 50 weeks),
Conducted by a research scientist (other researcher types will be inflated or deflated),
Of average ability relative to the ML research community (other cohorts will be inflated or deflated),
Working on a research avenue as relevant as adversarial robustness (alternative research avenues will be inflated or deflated),
Working at their peak productivity (earlier-in-career research will be discounted),
Conducting all of their research in the present (later-in-time research will be time discounted),
Who stays in the AI profession (later-in-time research will be discounted by the probability that the researcher switches).
In order to operationalize the QARY, we need some way of defining relative weights for different researcher types, researcher abilities, and the relevance of different research avenues.
Define the ‘scientist-equivalence’ of a researcher type as the rate at which we would trade off an hour of labor from this researcher type with an hour of otherwise-similar labor from a research scientist.
Similarly, the ‘ability’ level of a researcher is the rate at which we would trade off an hour of labor from a researcher of this ability level with an hour of otherwise-similar labor from a researcher of ability level 1.
Finally, the ‘relevance’ of a research avenue is the rate at which we would trade off an hour of labor from a researcher pursuing this avenue with an hour of otherwise-similar labor from a researcher pursuing adversarial robustness research.
The expected number of QARYs per participant is given by the integral of the product of these functions over a career:
QARYs-per-participant = (integral from 0 to 60 of: research-labor x scientist-equivalence x ability x relevance x productivity x time-discount x probability-stay-in-AI dt)
or, since scientist-equivalence and ability are constant in time,
QARYs-per-participant = scientist-equivalence x ability x (integral from 0 to 60 of: research-labor x research-avenue-relevance x relative-productivity x time-discount x probability-stay-in-AI dt).
The benefit of the program is given by the difference between expected QARYs with and without the program. Cost-effectiveness is calculated by dividing this benefit by the expected cost in millions of US dollars.
Building the model piece-by-piece
Let's gradually build up the model, starting with the simplest possible scenario.
The simple example program
The simple example program has a budget of $100k, sufficient to support 100 ML researchers.
Each participant produces the same QARYs over the course of their career. In particular, if the program is implemented, each participant:
Works on research from the beginning of the program until retirement (60 years hence),
Is valued equally to a current research scientist (1x scientist-equivalence),
Is of average ability relative to the ML research community,
Is 1% likely to work on adversarial robustness research, and 99% likely to work on a research avenue that CAIS considers to have limited relevance to AI safety (0x adversarial robustness research),
Always maintains their peak productivity,
Does not have their work time-discounted, and
Remains within the AI profession throughout their career.
In the absence of the program, each of the identical participants:
4. Works on a research avenue that CAIS considers to have limited relevance to AI safety,
with all other factors remaining constant.
Integrating over time, each participant produces, with and without the program taking place respectively,
1 x 1 x (integral from 0 to 60 of: 1 x 0.01 x 1 x 1 x 1 dt) = 0.6
1 x 1 x (integral from 0 to 60 of: 1 x 0 x 1 x 1 x 1 dt) = 0
QARYs over their career respectively. Multiplying by the number of participants, the program generates
100 * (0.6 - 0) = 60
QARYs, at a cost-effectiveness (in QARYs per $1m) of
60 / ($100k / $1m) = 600.
Cost and number of participants
Now, let's consider the expected costs for each program:
Parameter
TDC
NeurIPS Social
NeurIPS Workshop
Target Budget
$65,000
$5200
$110,000
Fixed Cost
$12,000
$2700
$6200
Variable Cost Event
$2400
$520
Variable Cost Award
$50,000
$100,000
Variable Cost
$53,000
$2600
$104,000
Fixed costs refer to expenses that remain constant regardless of the number of participants (e.g. time spent designing a prize challenge).
Variable costs, which are costs proportional to the number of participants (e.g. time spent judging workshop entries), make up the rest of the budget (at least, in expectation[2]). Some small fraction of this remainder goes to variable labor costs. For the TDC and NeurIPS Social, variable cost is otherwise allotted to prize awards or event costs, respectively. For the NeurIPS Workshop, the variable cost is otherwise split between prize awards and event costs.
Given these budgets, each program can support some number of participants.
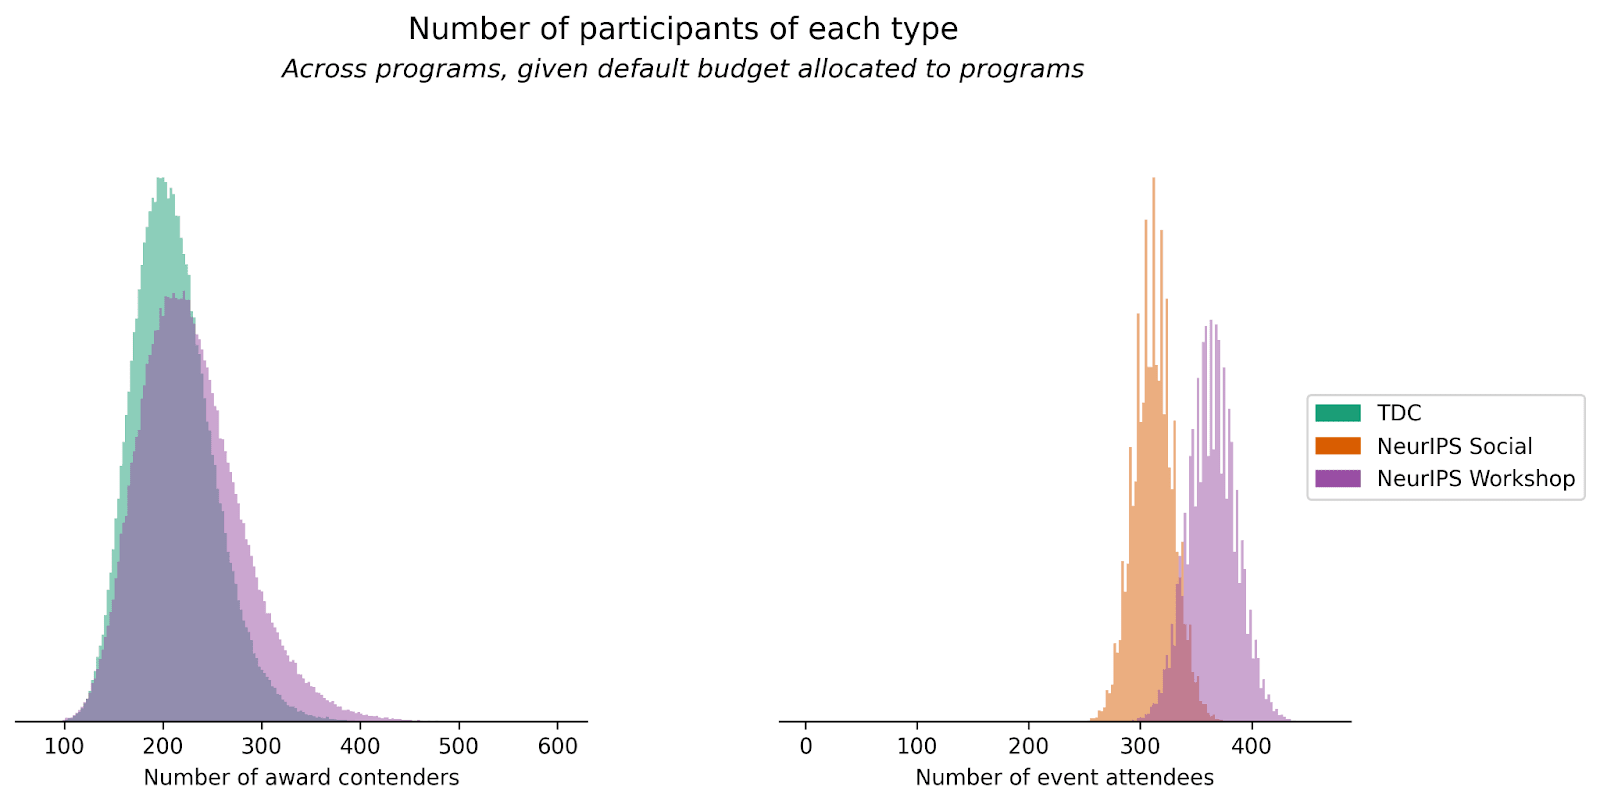
Professional field-building programs have two possible types of participants: ‘attendees,’ those who participate in events[3], and ‘contenders,’ those who enter prize competitions. Prizes are submitted to by research teams of contenders, socials are visited by attendees, workshops are submitted to by research teams of contenders and visited by attendees[4].
The following plot illustrates our uncertainty over the number of participants of each type that will be involved in the program (given our default budget).
The number of attendees a program with an event component can support depends on the budget allocated to the event, the maximum number of attendees that an event can support per $1,000 of budget, and some deeper parameters controlling how the number of attendees scales with budget (see the scalability section for more details).
The number of contenders a program with a prize component can support is found by solving for the fixed point of
where number of participants is a function of the expected award.
Maintaining earlier assumptions about QARYs per participant, the cost-effectiveness of these programs is as follows:
Program
Build-up stage
Cost (USD)
Benefit (counterfactual expected QARYs)
Cost-effectiveness (QARYs per $1M)
Simple example program
Simple example program
100,000
60
600
NeurIPS Social
Cost and Participants
5200
180
34,000
NeurIPS Workshop
Cost and Participants
110,000
340
3100
Trojan Detection Challenge
Cost and Participants
65,000
120
1800
Pipeline probabilities and scientist-equivalence
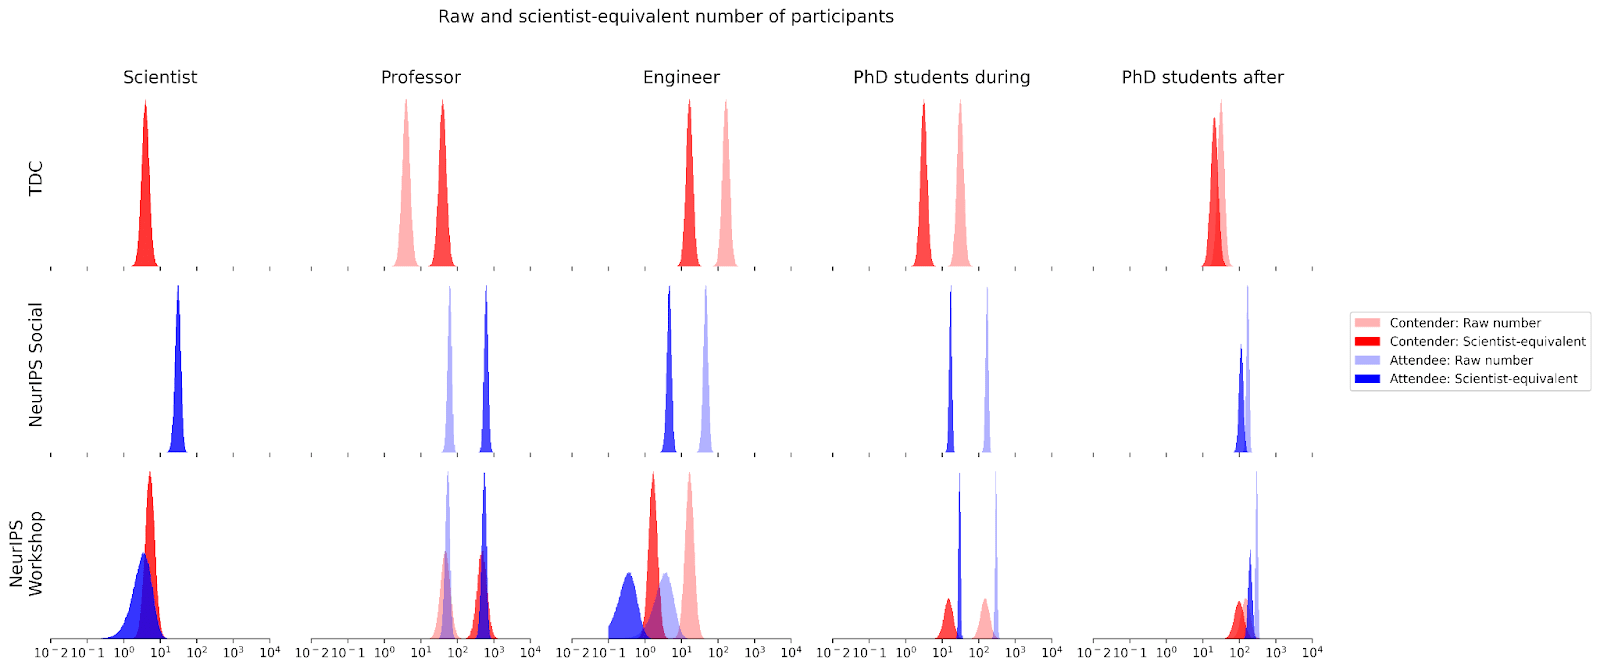
Both attendees and entering teams of contenders are composed of research scientists, research professors, research engineers, and PhD students.
For purposes of impact evaluation, we might not value the impact of different roles equally. Here, scientists, professors, engineers, and PhD students are assigned ‘scientist-equivalence’ of 1, 10, 0.1, and 0.1 respectively.
Note that, in expectation, PhD students will have a different level of ‘scientist-equivalence’ after than during their PhD. This is because they face one remaining hurdle in the ‘pipeline’ to becoming professional researchers: the job market. At the end of their PhD program, PhD students have some probability of becoming a scientist, professor, or engineer. So, although during their PhD we value PhD students at 0.1 scientist-equivalents, we expect them to be valued at
The number of contenders and attendees for each program and researcher type is specified as follows:
Let's see how these factors affect cost-effectiveness. In the table below, bolded rows incorporate pipeline probabilities and scientist-equivalence.
Program
Build-up stage
Cost (USD)
Benefit (counterfactual expected QARYs)
Cost-effectiveness (QARYs per $1M)
Simple example program
Simple example program
100,000
60
600
NeurIPS Social
Cost and Participants
5200
180
34,000
NeurIPS Social
Pipeline and Equivalence
5200
400
77,000
NeurIPS Workshop
Cost and Participants
110,000
340
3100
NeurIPS Workshop
Pipeline and Equivalence
110,000
710
6500
Trojan Detection Challenge
Cost and Participants
65,000
120
1800
Trojan Detection Challenge
Pipeline and Equivalence
65,000
45
690
Factoring in pipeline probabilities and scientist-equivalence favors programs with larger shares of professor participants and smaller shares of participants who are engineers or PhD students. This advantages the NeurIPS Social and NeurIPS Workshop relative to the Trojan Detection Challenge, which has a much higher share of participants who are engineers.
Ability and research avenue relevance
Participants may vary in ability. However, in the current implementation for professional programs, all participants are always set to have ability level 1 (average relative to the ML research community).
This agnostic stance is (somewhat) in contrast to the stance taken in our post covering student programs. We think it is reasonable to expect the ability of marginal participants to be constant for programs that are not selective (such as the programs considered in this post, and unlike some student programs).
Separate from their ability, participants might work on varying research avenues that we value differently.
For a sense of how we operationalize these differences, consider research avenue relevance among participants of the TDC[5]. During the time participants spent working on the TDC, all contenders were working on trojans research, which we consider to be 10x more relevant than adversarial robustness research. We believe that, before the program, scientists, professors, and Ph.D. students are 50% likely to be working on trojans research relevant to the TDC, and 50% likely to be working on research avenues that we judge to be 10x less relevant than adversarial robustness. Then, on average, participants produce research with relevance 5.05. After the program, 2% of research done by scientists, professors, and PhD students is shifted towards trojans work relevant to the TDC, leading to research relevance of 5.15. (You could think of this difference as coming from all participants switching research avenues by some very small amount, or some very small number of participants switching research avenues entirely, or some combination of these possibilities.)
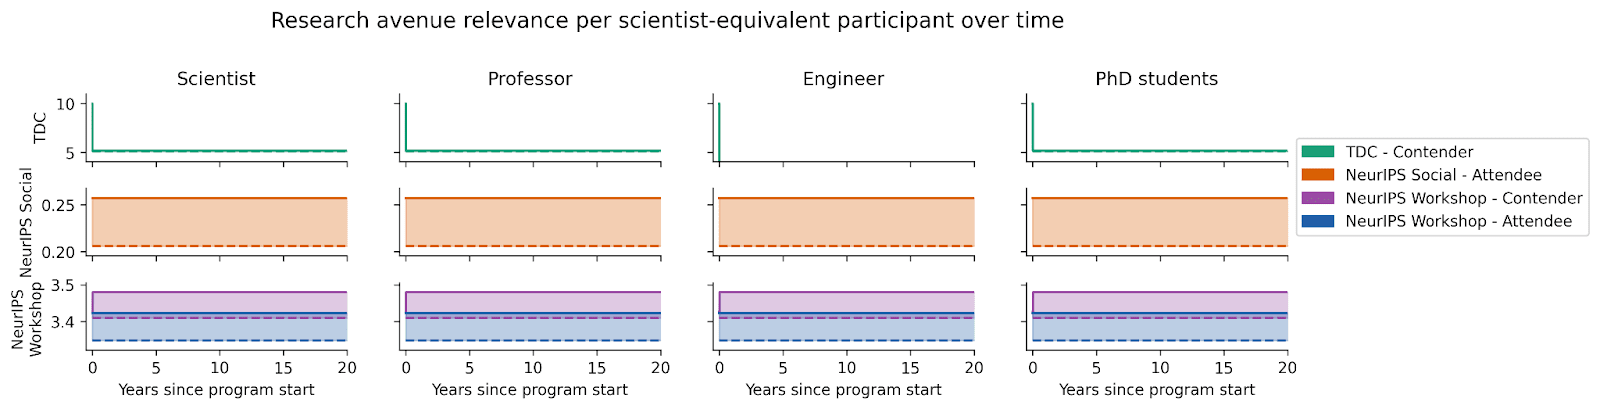
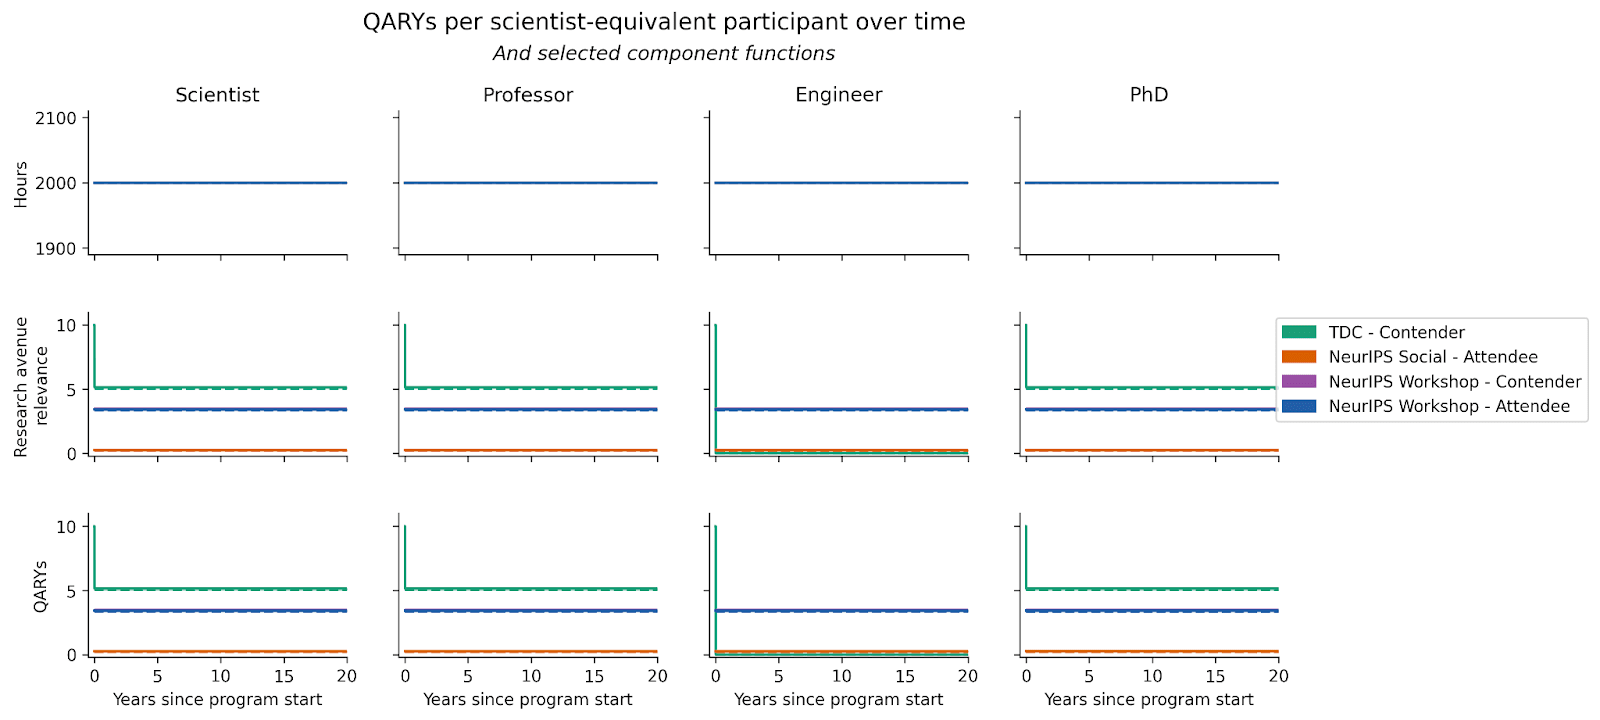
The research avenue relevance of each participant in each program over time is specified as follows:
The shaded area indicates research avenue relevance for the average participant with (solid line) and without (dashed line) the program.
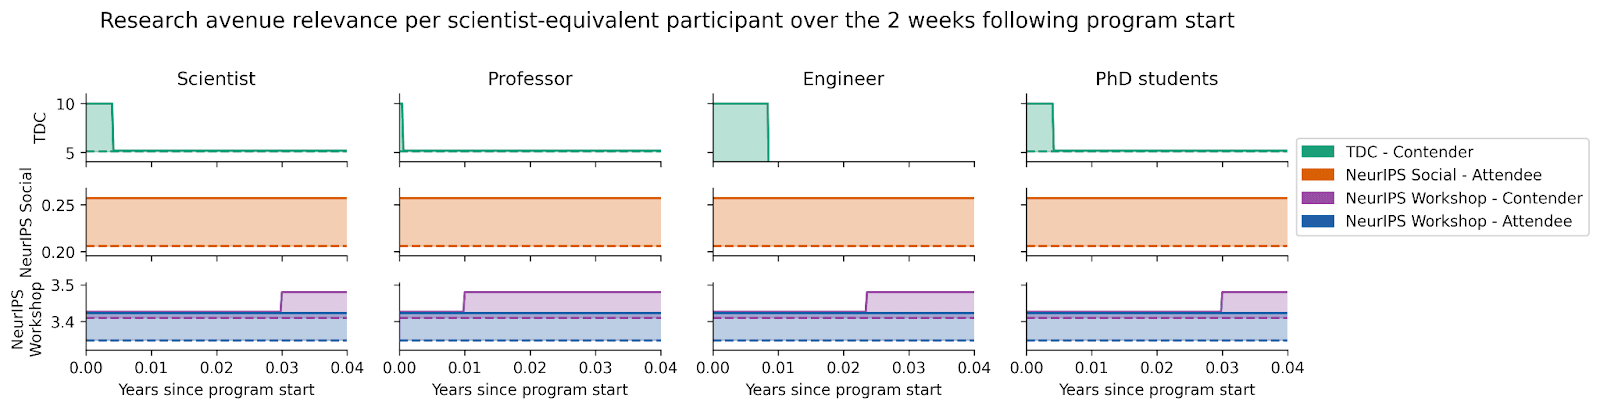
Notice the vertical changes for contenders in the TDC and NeurIPS Workshop. Zooming into the 2 weeks following the start of the program, we see that these changes consist of a very short period in which participants are working directly towards the program, before a many-year period in which they adopt a very slightly different research portfolio.
Relevance starts high for the TDC because contenders are compelled to work on relevant Trojans research in order to enter. After this period, we expect the research avenues pursued by scientists, professors, and PhD students to shift very slightly closer towards research avenues of interest to CAIS. Off-chart, engineers do not shift their research following the program.
In the case of the NeurIPS Workshop, we do not expect contenders to work on research avenues that are significantly more relevant than they might have otherwise during the time they spend directly working towards the workshop. But we do expect a similar effect on the relevance of their research beyond the workshop. In particular, CAIS gave awards to researchers who wrote an existential risk analysis in the appendix of their paper. We think it is plausible that this scheme — in combination with the more typical ways in which future research might be influenced by engaging with a workshop — caused a small expected shift in contenders’ future research avenue relevance.
For attendees of both the NeurIPS Workshop and NeurIPS Social, we expect a very slight shift in research avenues, in the direction of those avenues most relevant to CAIS.
Taking the product between time spent on research and research avenue relevance, we obtain QARYs per scientist-equivalent participant as a function of time.
The (difficult-to-see) shaded area in the bottom row equals QARYs per scientist-equivalent participant for each program. Combining this with the number of scientist-equivalent participants, we get an estimate for the QARYs produced by the program.
After incorporating differences in ability and research avenue relevance, the cost-effectiveness of different programs is given by:
Program
Build-up stage
Cost (USD)
Benefit (counterfactual expected QARYs)
Cost-effectiveness (QARYs per $1M)
Simple example program
Simple example program
100,000
60
600
NeurIPS Social
Cost and Participants
5200
180
34,000
NeurIPS Social
Pipeline and Equivalence
5200
400
77,000
NeurIPS Social
Ability and Relevance
5200
2100
394,000
NeurIPS Workshop
Cost and Participants
110,000
340
3100
NeurIPS Workshop
Pipeline and Equivalence
110,000
710
6500
NeurIPS Workshop
Ability and Relevance
110,000
5200
47,000
Trojan Detection Challenge
Cost and Participants
65,000
120
1800
Trojan Detection Challenge
Pipeline and Equivalence
65,000
45
690
Trojan Detection Challenge
Ability and Relevance
65,000
360
5500
The relative change in cost-effectiveness from incorporating (ability and) research avenue relevance is fairly similar across programs. This is not surprising: the long-term counterfactual effect is believed to be similar, around 0.05-0.1x the relevance of adversarial robustness. The NeurIPS Social gets a slightly smaller boost from having a slightly smaller counterfactual effect, whilst the TDC gets a slightly larger boost due to the large change in research avenue relevance during the program.
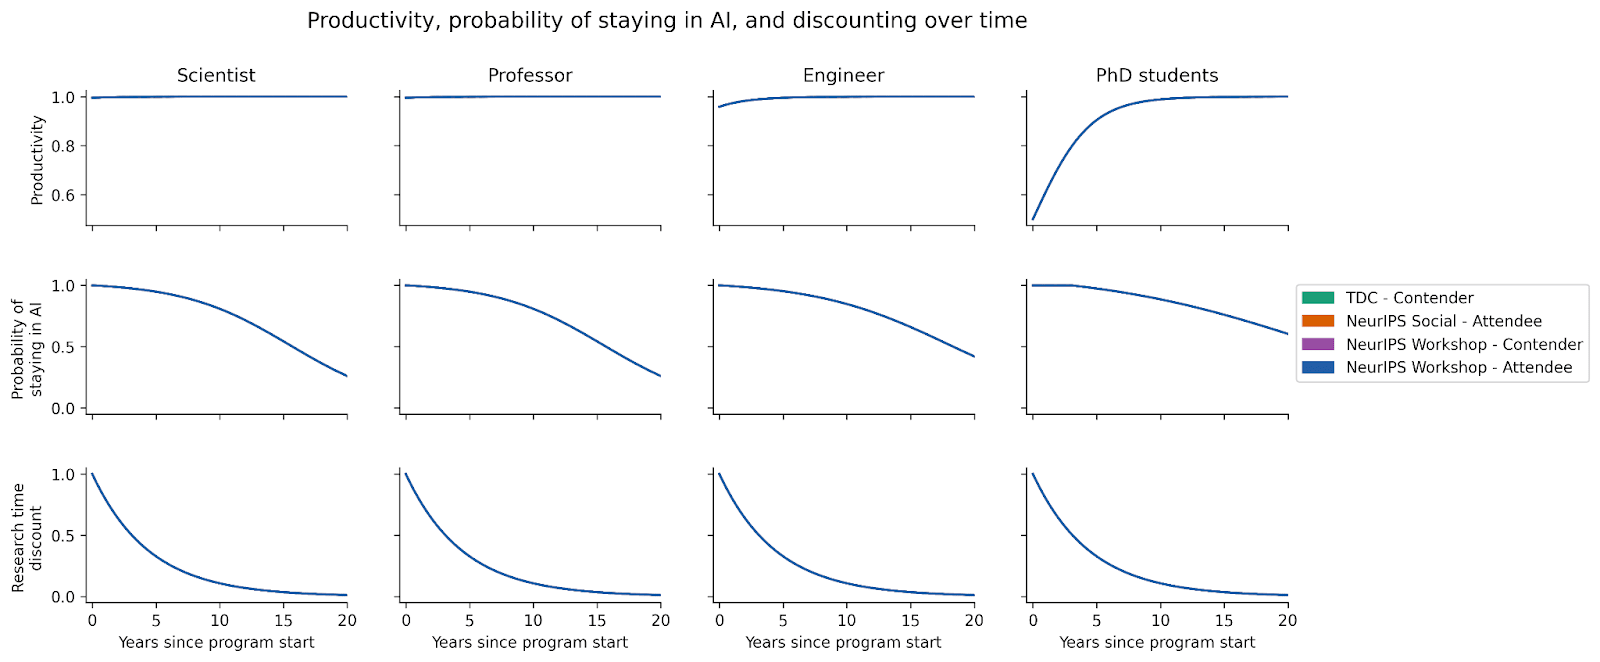
Productivity, staying in AI research, and time discounting
Researchers' productivity can vary throughout their careers. Additionally, some may choose to leave the field of AI research, and, from the perspective of today, the value of research might change over time. We will now make adjustments for these factors.
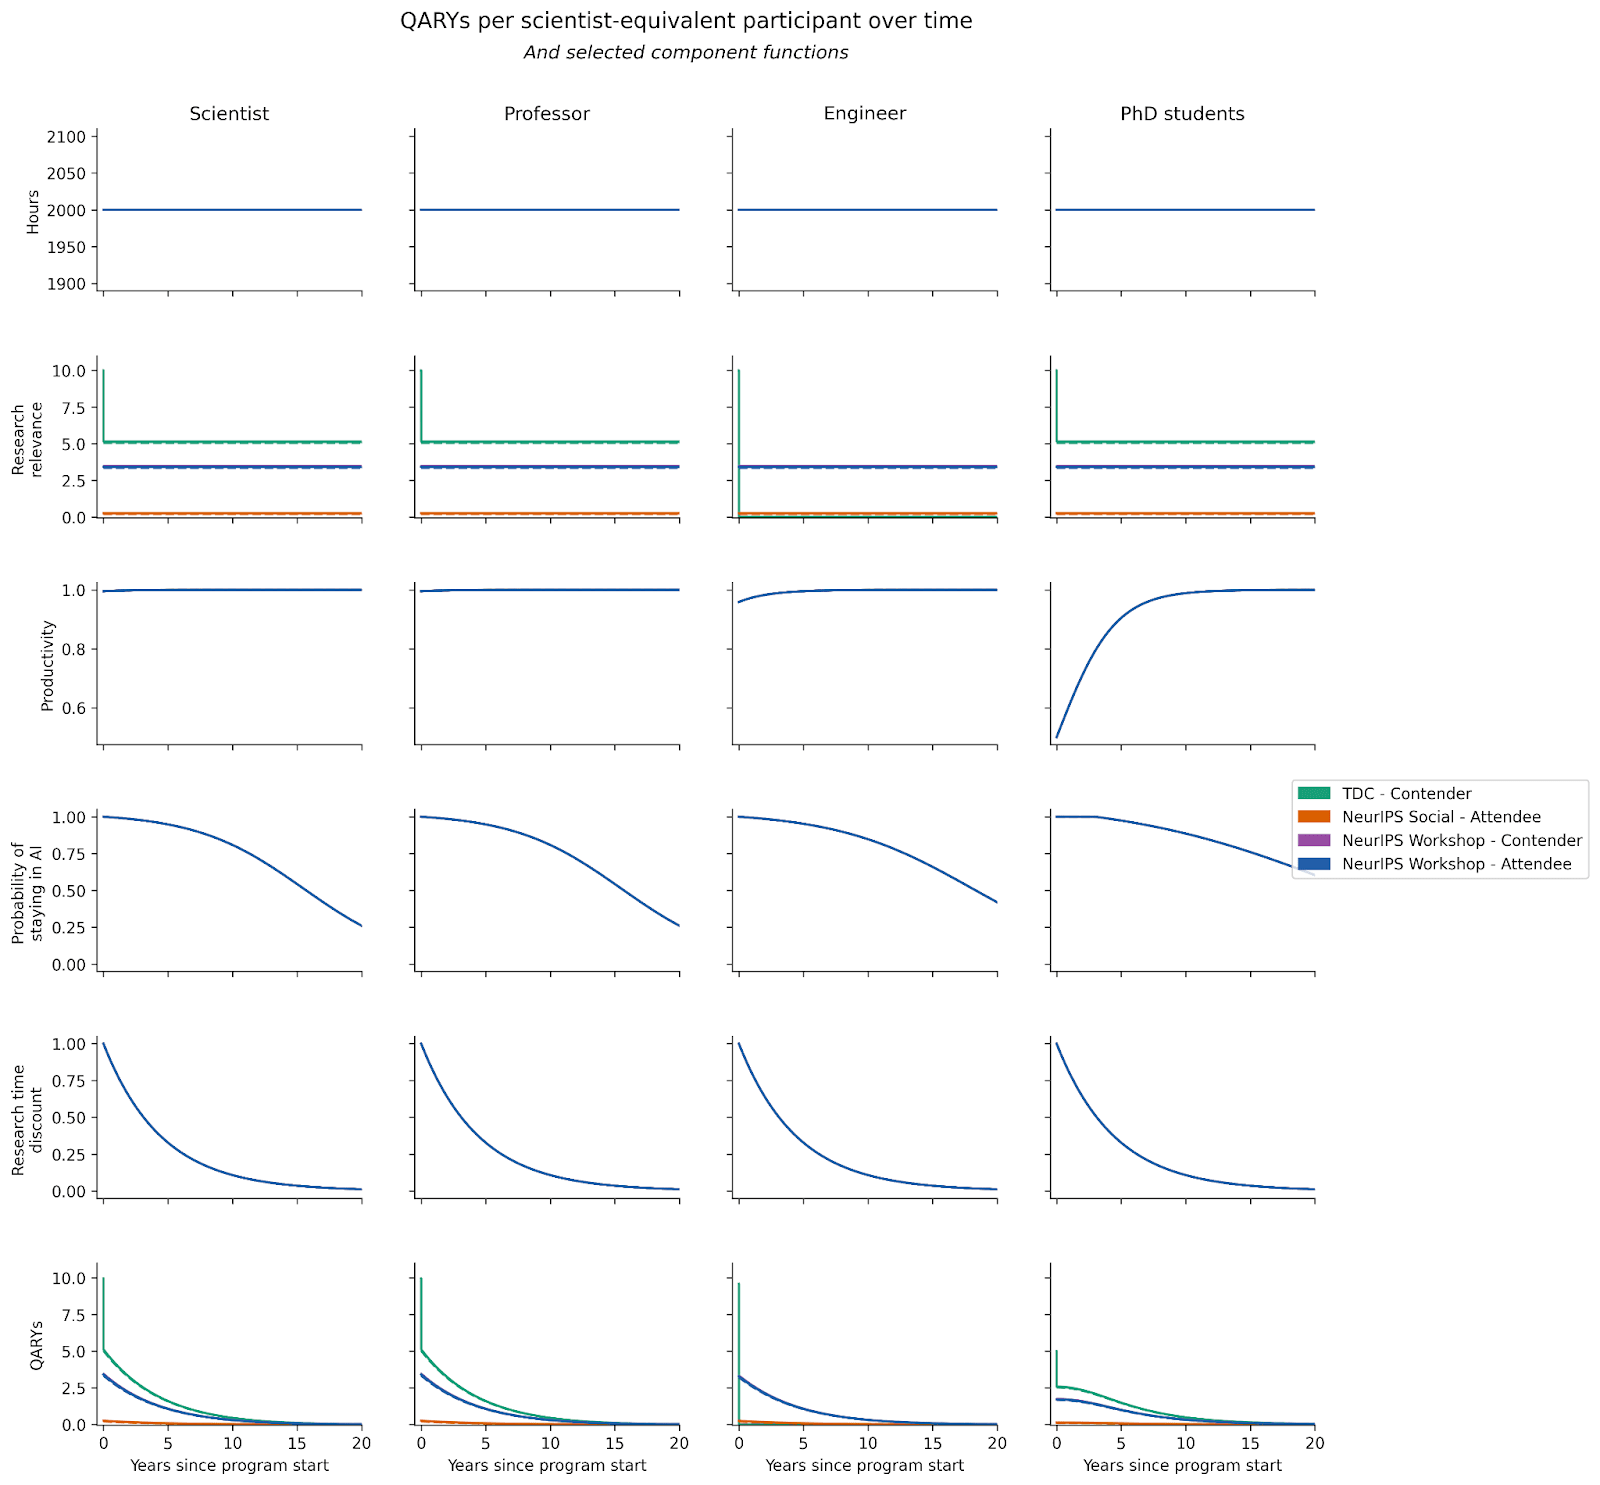
Productivity relative to peak, probability of staying in the AI field, and time discounting are specified as the following functions over time[6]:
These functions are nearly identical across programs. Differences across researcher types are due to age differences.
Multiplying these functions with the hours and research avenue relevance functions, we get the updated function for QARYs per scientist-equivalent over time:
The updated cost-effectiveness of each program is as follows:
Program
Build-up stage
Cost (USD)
Benefit (counterfactual expected QARYs)
Cost-effectiveness (QARYs per $1M)
Simple example program
Simple example program
100,000
60
600
NeurIPS Social
Cost and Participants
5200
180
34,000
NeurIPS Social
Pipeline and Equivalence
5200
400
77,000
NeurIPS Social
Ability and Relevance
5200
2100
394,000
NeurIPS Social
Productivity, Staying in AI, and Time Discounting
5200
150
29,000
NeurIPS Workshop
Cost and Participants
110,000
340
3100
NeurIPS Workshop
Pipeline and Equivalence
110,000
710
6500
NeurIPS Workshop
Ability and Relevance
110,000
5200
47,000
NeurIPS Workshop
Productivity, Staying in AI, and Time Discounting
110,000
360
3300
Trojan Detection Challenge
Cost and Participants
65,000
120
1800
Trojan Detection Challenge
Pipeline and Equivalence
65,000
45
690
Trojan Detection Challenge
Ability and Relevance
65,000
360
5500
Trojan Detection Challenge
Productivity, Staying in AI, and Time Discounting
65,000
26
390
The adjustments for productivity, remaining in AI research, and time discounting have a dramatic effect on estimated (absolute) cost-effectiveness. The most important reason for this is that discounting future research reduces its present value considerably.
However, these adjustments have the smallest impact on the ratios of estimated cost-effectiveness between programs (relative cost-effectiveness) of any we have considered. The TDC, NeurIPS Social, and NeurIPS Workshop all see an approximately 14x decline in cost-effectiveness.
Cost-effectiveness in context
The following table compares the cost-effectiveness of the programs considered above, hypothetical implementations of similar programs, and ‘baseline’ programs — directly funding a talented research scientist or PhD student working on trojans research for 1 year or 5 years respectively.
Program
Cost (USD)
Benefit (counterfactual expected QARYs)
Cost-effectiveness (QARYs per $1M)
Trojan Detection Challenge
65,000
26
390
NeurIPS ML Safety Social
5200
150
29,000
NeurIPS ML Safety Workshop
110,000
360
3300
Hypothetical: Power Aversion Prize
50,000
490
9900
Hypothetical: Cheaper Workshop
35,000
250
7000
Baseline: Scientist Trojans
500,000
84
170
Baseline: PhD Trojans
250,000
8.7
35
The “power aversion prize” mirrors the TDC, except with $15k less award funding and a more relevant topic. The change in topic has two effects: work during the prize is 100x more relevant than analogous work on adversarial robustness, and 2% of contenders shift to a 100x research avenue following their work on the prize. (The research avenue relevance of trojans was 10x adversarial robustness, with the same proportion of research shifting.) The “cheaper workshop” is identical to the NeurIPS ML Safety Workshop, except with $75k less award funding.
"Scientist Trojans" and "PhD Trojans" are hypothetical programs, wherein a research scientist or a PhD student is funded for 1 or 5 years, respectively. This funding causes the scientist or PhD student to work on trojans research (a 10x research avenue) rather than a research avenue that CAIS considers to have limited relevance to AI safety (0x). Unlike participants considered previously in this post, the scientist or PhD student has ability 10x the ML research community average. The benefits of these programs cease after the funding period.
The cost-effectiveness of the NeurIPS ML Safety Social is estimated to be nearly 10x greater than that of the NeurIPS ML Safety Workshop, which in turn is nearly 10x more cost-effective than the Trojan Detection Challenge. We do not conclude from this that workshop and prize programs are not worthwhile as part of our portfolio of programs. Intuitively, socials scale much less well than workshops and prizes. Further, the estimates for a hypothetical cheaper workshop and power aversion prize imply that straightforward changes to workshop and prize programs might result in much greater cost-effectiveness.
All of the professional field-building programs are estimated to be more cost-effective than the baseline programs. What factors contribute to this gap between professional and baseline programs?
Cost per participant is the most important factor — coming in at approximately $300, $15, and $200 for the TDC, NeurIPS Social, and NeurIPS Workshop respectively, compared with $500,000 and $250,000 for the baseline programs.
Smaller factors favoring the professional programs we considered include the benefits of professional programs being spread out over many more years and, in the case of the NeurIPS Social and NeurIPS Workshop, the greater level of scientist-equivalence per participant (due to the high proportion of participants who are professors).
Of course, there are powerful offsetting factors. The baseline programs’ treatment effect on research avenue relevance is assumed to be around 100x as large as the largest effect among the TDC, NeurIPS Social, and NeurIPS Workshop, and ability is assumed to be 10x greater.
Finally, while it did not feature prominently in this post, note that research avenue relevance could have had a very large effect on cost-effectiveness differences between the TDC, NeurIPS Social, and NeurIPS Workshop (see the robustness to research avenue relevance section). This suggests the importance of tracking research avenue differences before and after the program, and of accountability mechanisms as a lever for affecting these differences. It also underscores the importance of focusing prizes on the most important research avenues — shifting the hypothetical prize towards a 100x rather than 10x research avenue leads to 10x greater benefits.
Scalability and robustness
Scalability
So far, we've considered a single budget for each program. We might instead be interested in running these programs at a higher or lower cost, with correspondingly different benefits.
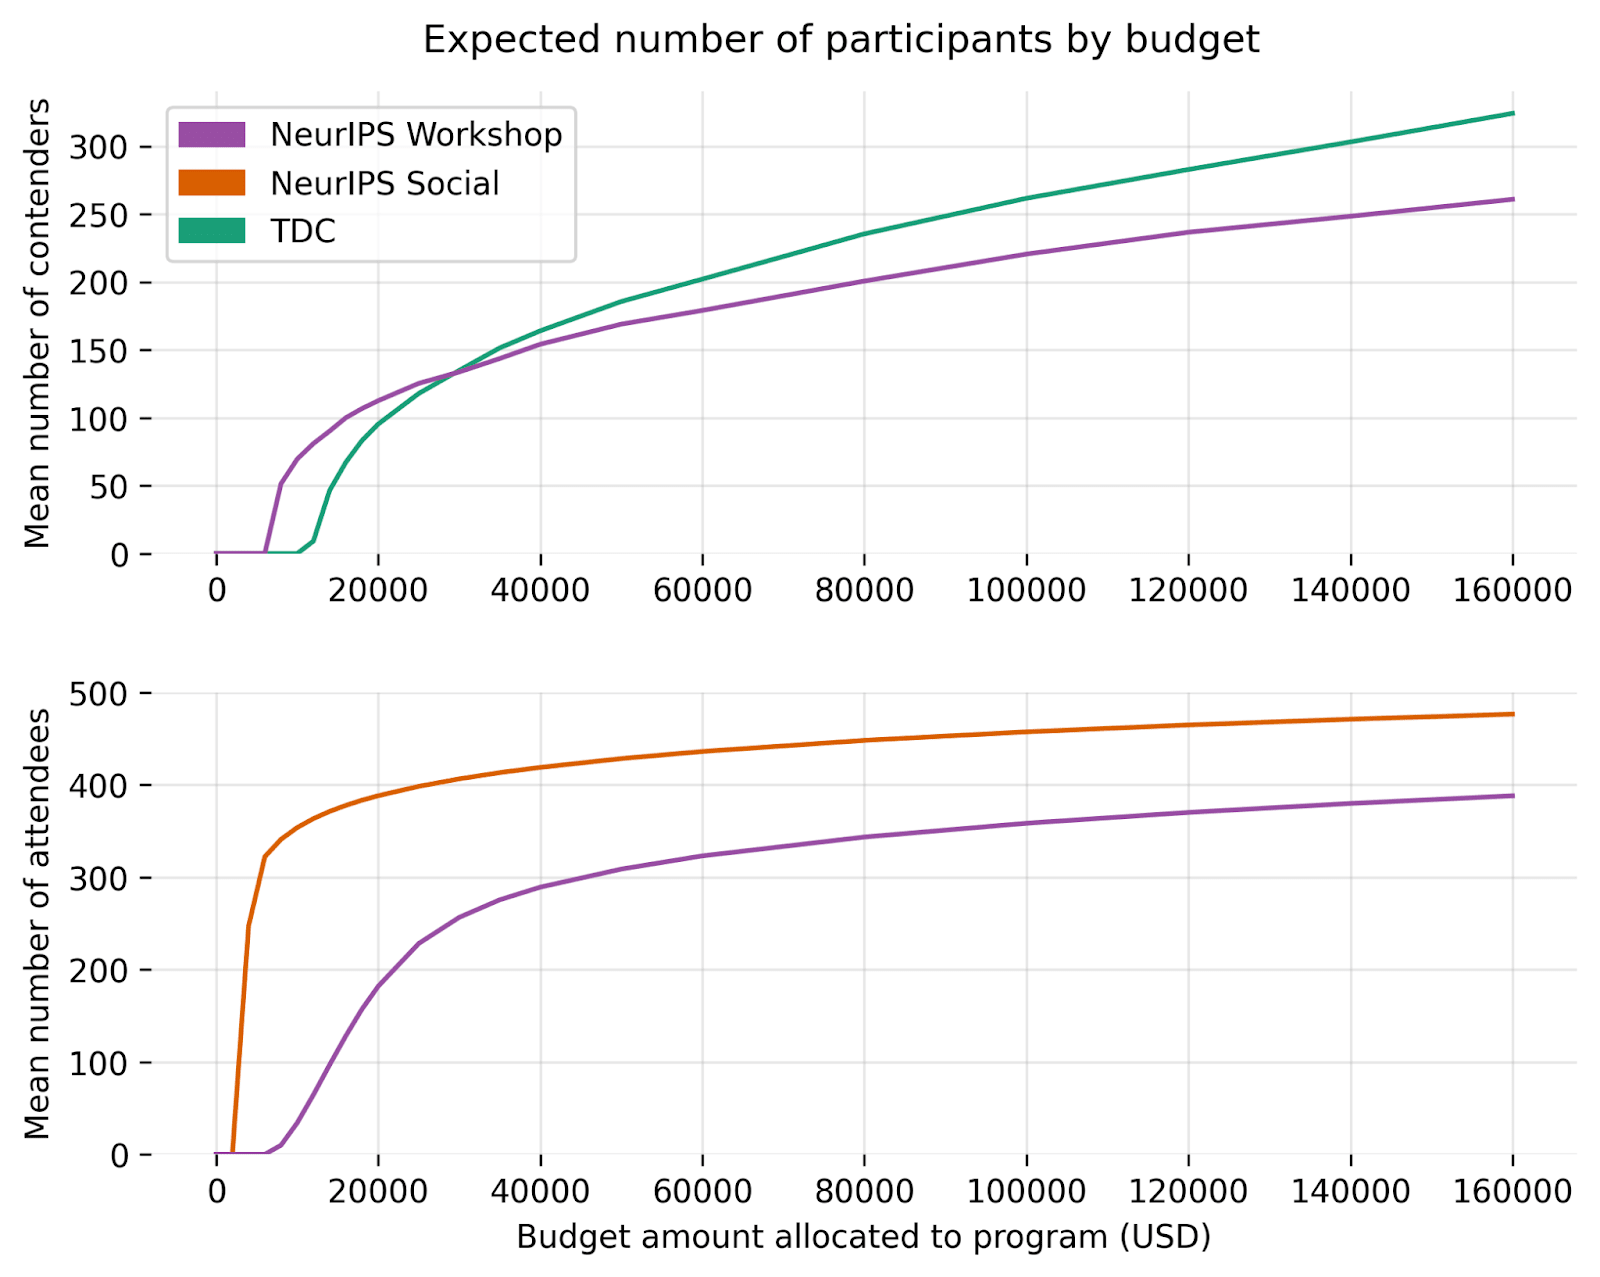
In the model, benefit is linked to cost by having higher variable costs lead to a larger number of participants[7]. Three deep parameters control these ‘scaling’ functions: a curvature parameter, and slope and intercept parameters to transform something like utility to the number of entries or attendees. These parameters are (very informally) calibrated to match survey answers about the number of participants given the default budget, and to match intuition in other cases. Clearly, this is a tricky exercise; you should treat these functions (and therefore estimates of benefit beyond the default case) with healthy skepticism.
Given the scaling parameters we use, the expected number of participants as a function of budget looks as follows:
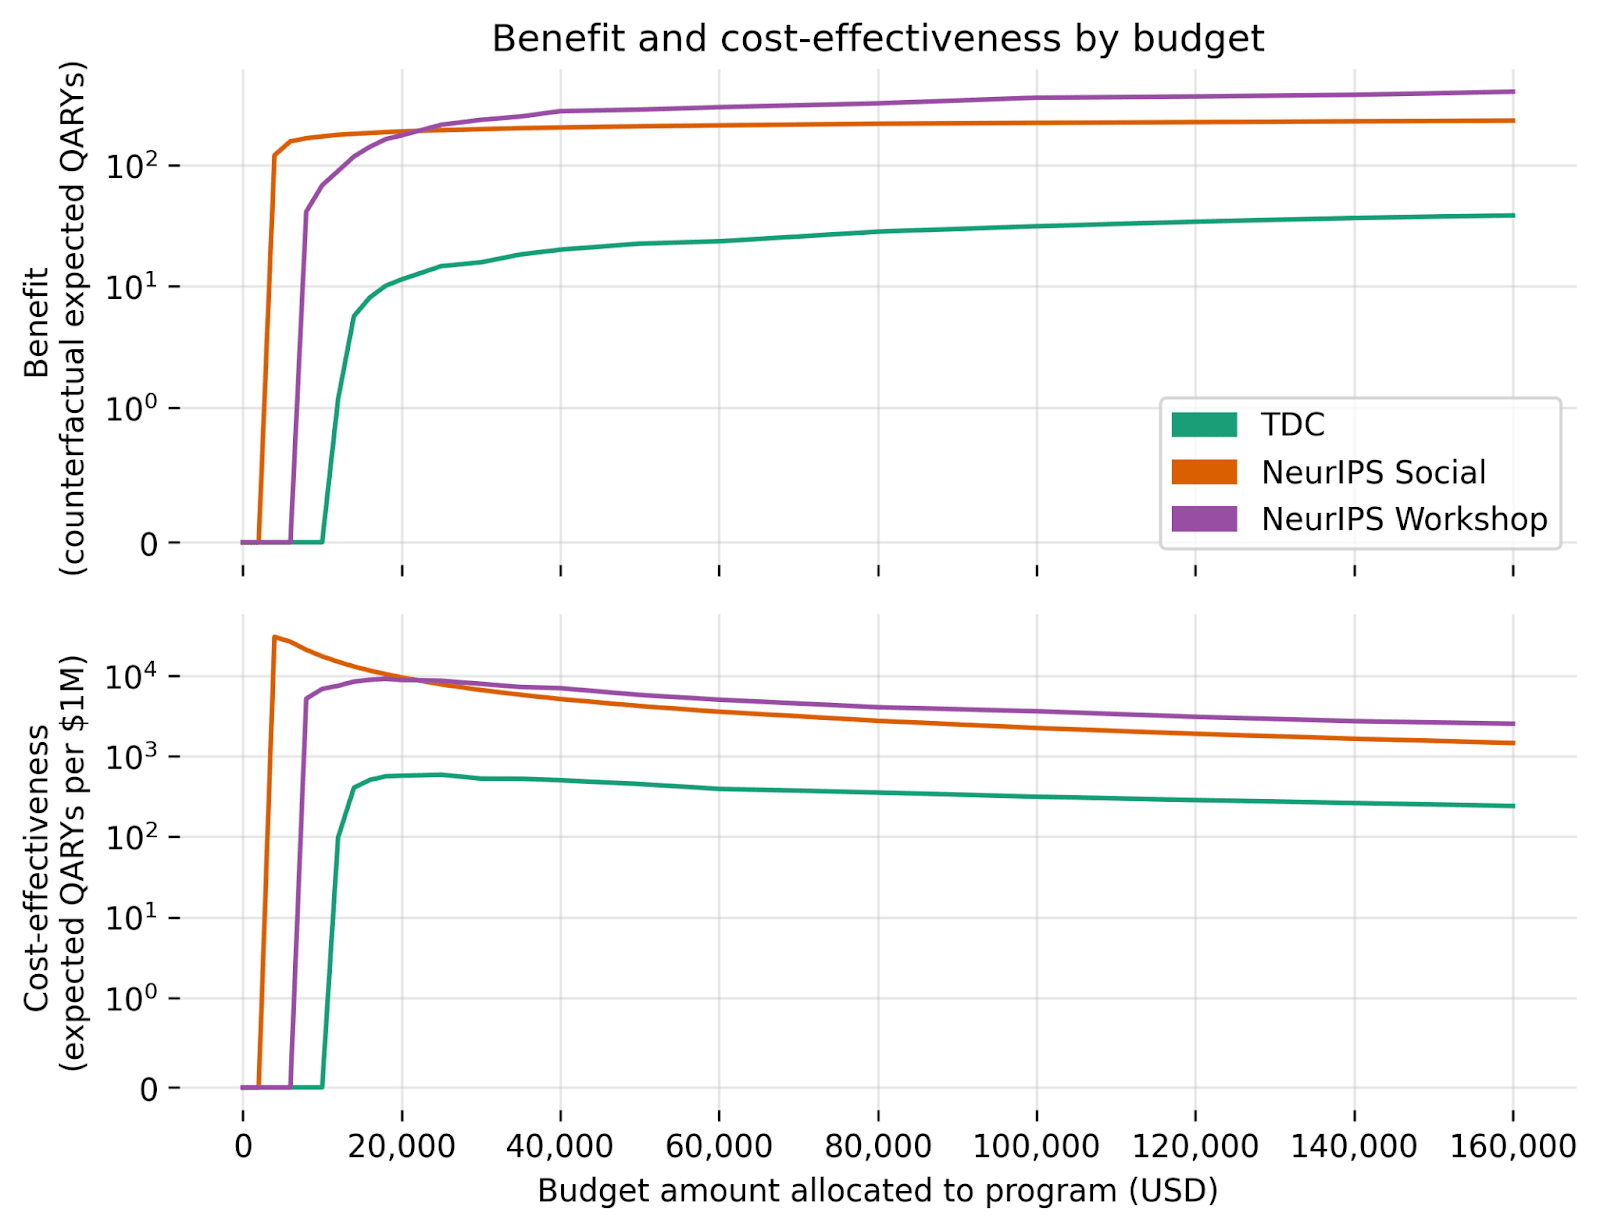
The scaling functions lead to the following expected benefit and cost-effectiveness estimates as a function of budget:
This plot complicates our earlier results using only default budgets.
For instance, although the NeurIPS Social was estimated to be the most cost-effective program at default budgets, it does not scale as well as the NeurIPS Workshop. (Nor would it scale as well as the hypothetical power aversion prize.) The implication is that, if our goal is to maximize cost-effectiveness with access to a sizable budget and only these programs, we would probably want to pursue multiple programs simultaneously[8].
Robustness
Research discount rate
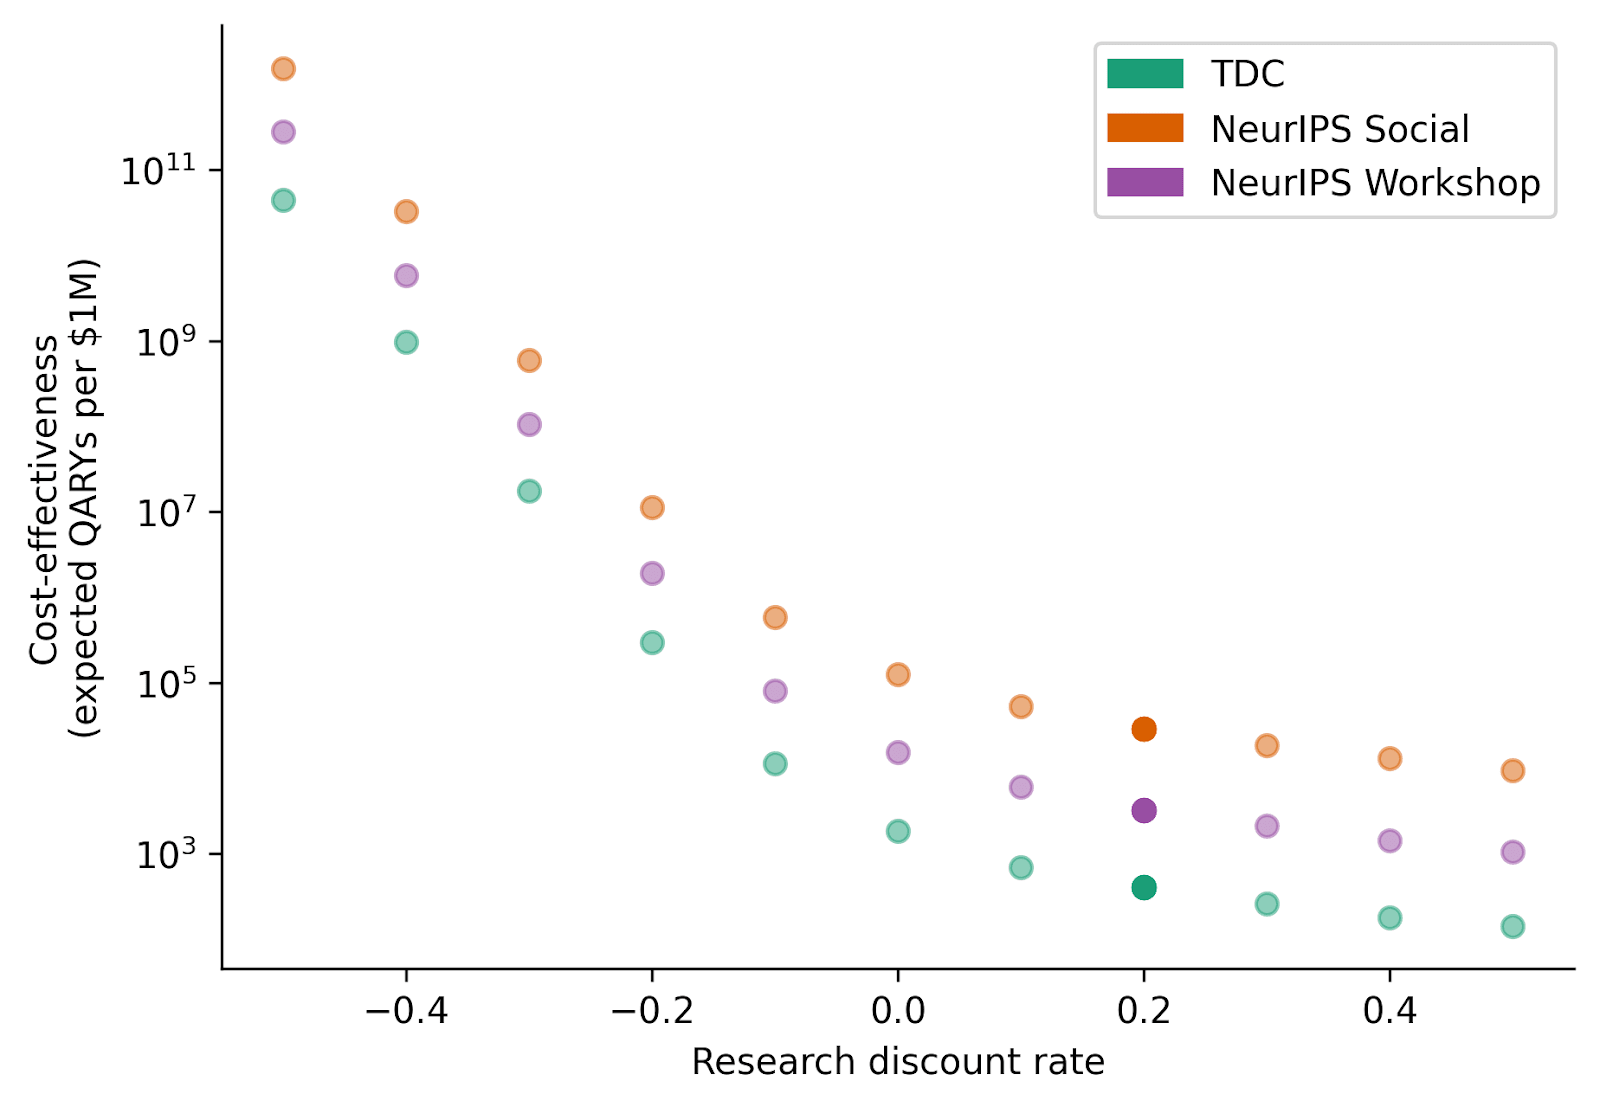
We saw earlier that the research discount rate – the degree to which a research year starting next year is less valuable than one starting now – had an especially large effect on (absolute) cost-effectiveness estimates.
For purposes of this post, research one year from now is considered to be 20% less valuable than research today. The justification for this figure begins with the observation that, in ML, research subfields often begin their growth in an exponential fashion. This means that research topics are often dramatically more neglected in earlier stages (i.e. good research is much more counterfactually impactful), and that those who are early can have an outsized impact in influencing the direction of the field — imagine a field of 3 researchers vs. one of 300 researchers. If, for instance, mechanistic interpretability arose as a research agenda one year earlier than it did, it seems reasonable to imagine that the field would have 20% more researchers than it currently does. In fact, we think that these forces are powerful enough to make a discount rate of 30% seem plausible. (Shorter timelines would also be a force in this direction.)
This view does not reflect a consensus. Others might argue that the most impactful safety work requires access to more advanced models and conceptual frameworks, which will only be available in the future[9].
The plot above shows how cost-effectiveness changes with the research discount rate. 0.2 is our default; negative values represent a preference for research conducted in the future.
For the programs considered in this post, research time discounting strongly affects conclusions about absolute impact, but does not affect conclusions about relative impact.
It is hardly surprising that the research discount rate does not affect the relative impact of professional field-building programs: these are all programs that aim to affect research starting immediately. Relative cost-effectiveness might be less robust when comparing professional programs with student programs — where the trade-off between the malleability of research interests and timing of research is starker — for different values of the research discount rate. (The research discount rate section of our introduction post explores this comparison.)
Research avenue relevance
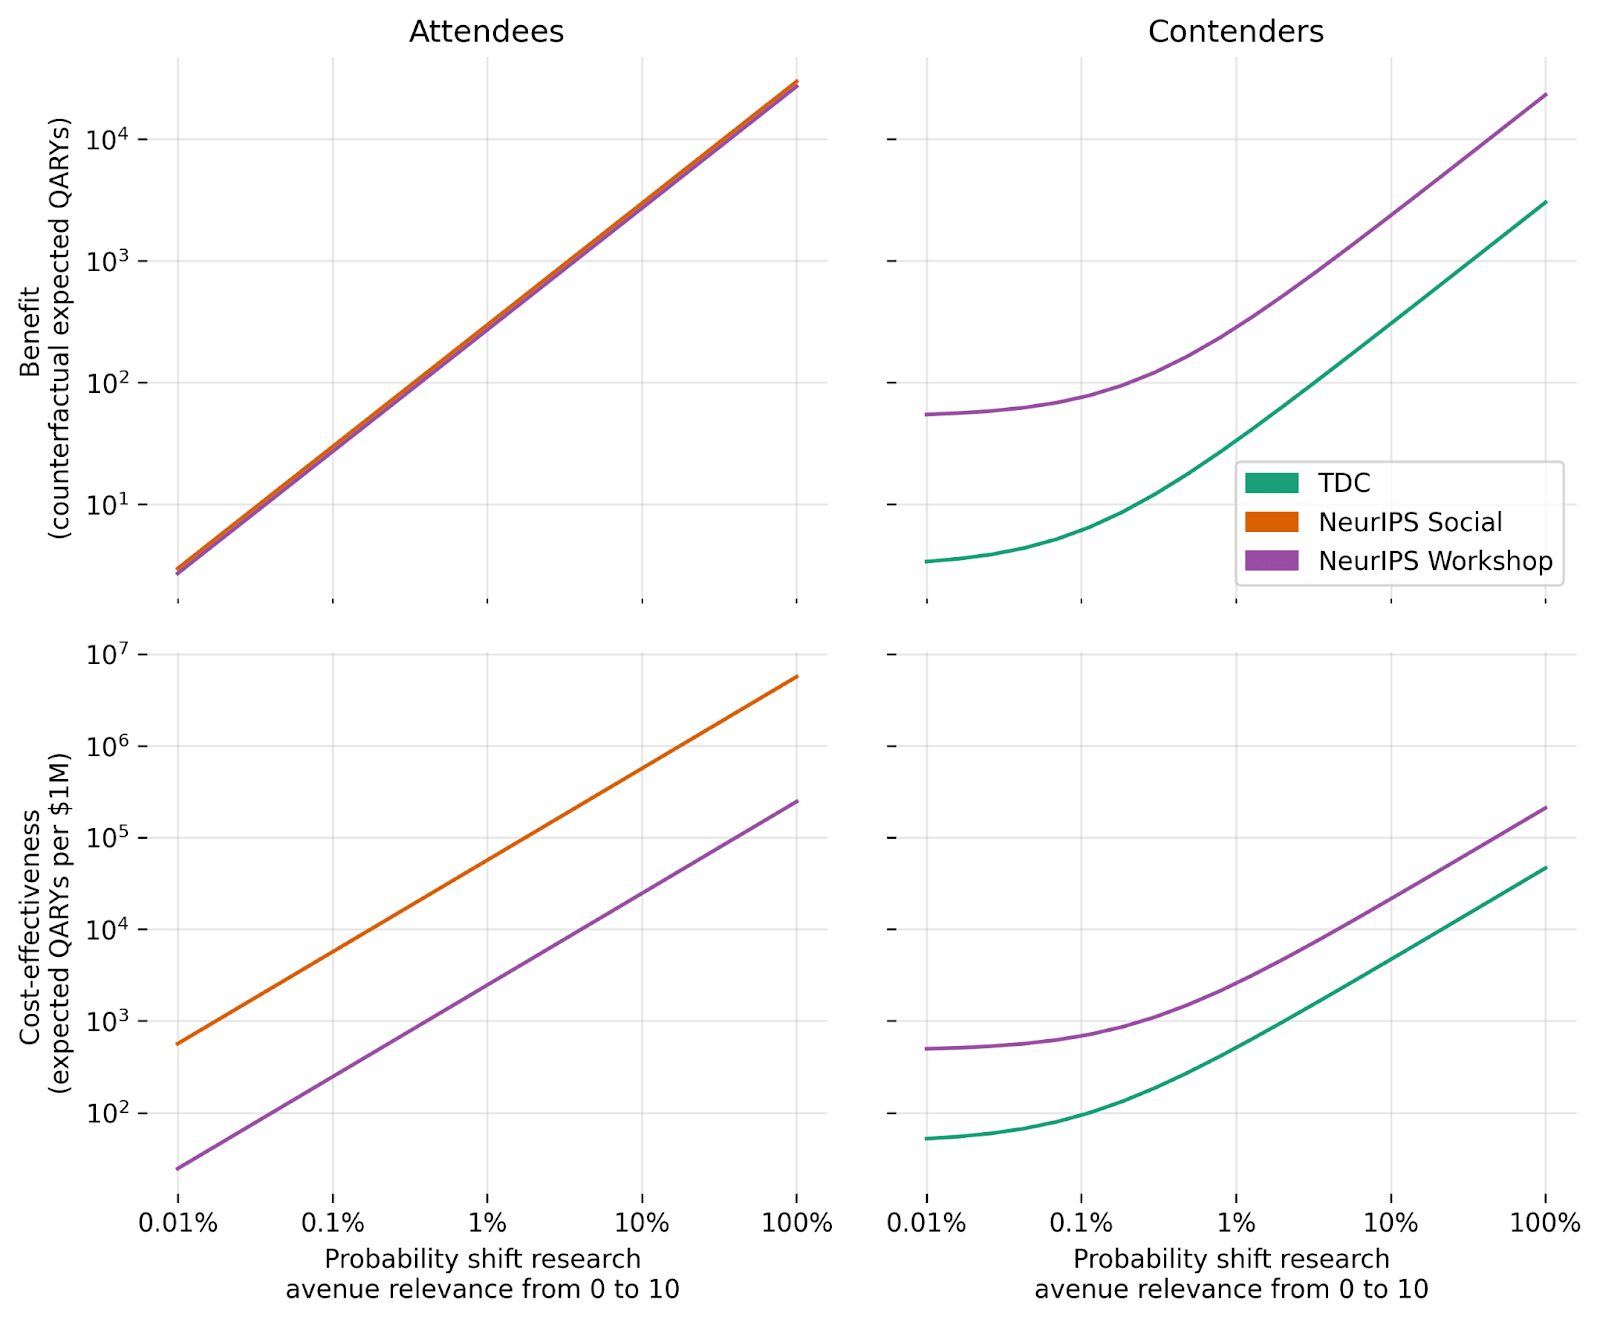
Consider this illustrative scenario. All participants begin the programs considered above pursuing research avenues that CAIS considers to have limited relevance to AI safety (0x adversarial robustness). For programs with an award component, contenders pursue research avenues that are 10x as relevant as adversarial robustness during their direct involvement in the program. For all programs, once the program ends, participants shift from research avenues with 0x relevance to research avenues with 10x relevance with some probability. (This could also be viewed as a proportion of research being redirected towards more relevant avenues.)
The above plot shows how program benefit and cost-effectiveness vary in response to changes in the probability that different types of participants alter their research avenues (with other participant types remaining unchanged).
Notice that differences in research avenue relevance matter a lot for program outcomes. Two alternative, plausible views on research avenue relevance could imply more than 3 orders of magnitude difference in final impact. (To see this from the chart, note that, for the purposes of the model, a 100% chance of moving from 0 to 10 is equivalent to a 1% chance of moving from 0 to 1000 — and that research avenue relevance is unsettled and might be thought to vary by orders of magnitude.)
Although the models’ results will strongly depend on contentious research avenue relevance parameters, we are heartened that these models clarify the effect of alternative views on benefit and cost-effectiveness.
Less contentious background parameters
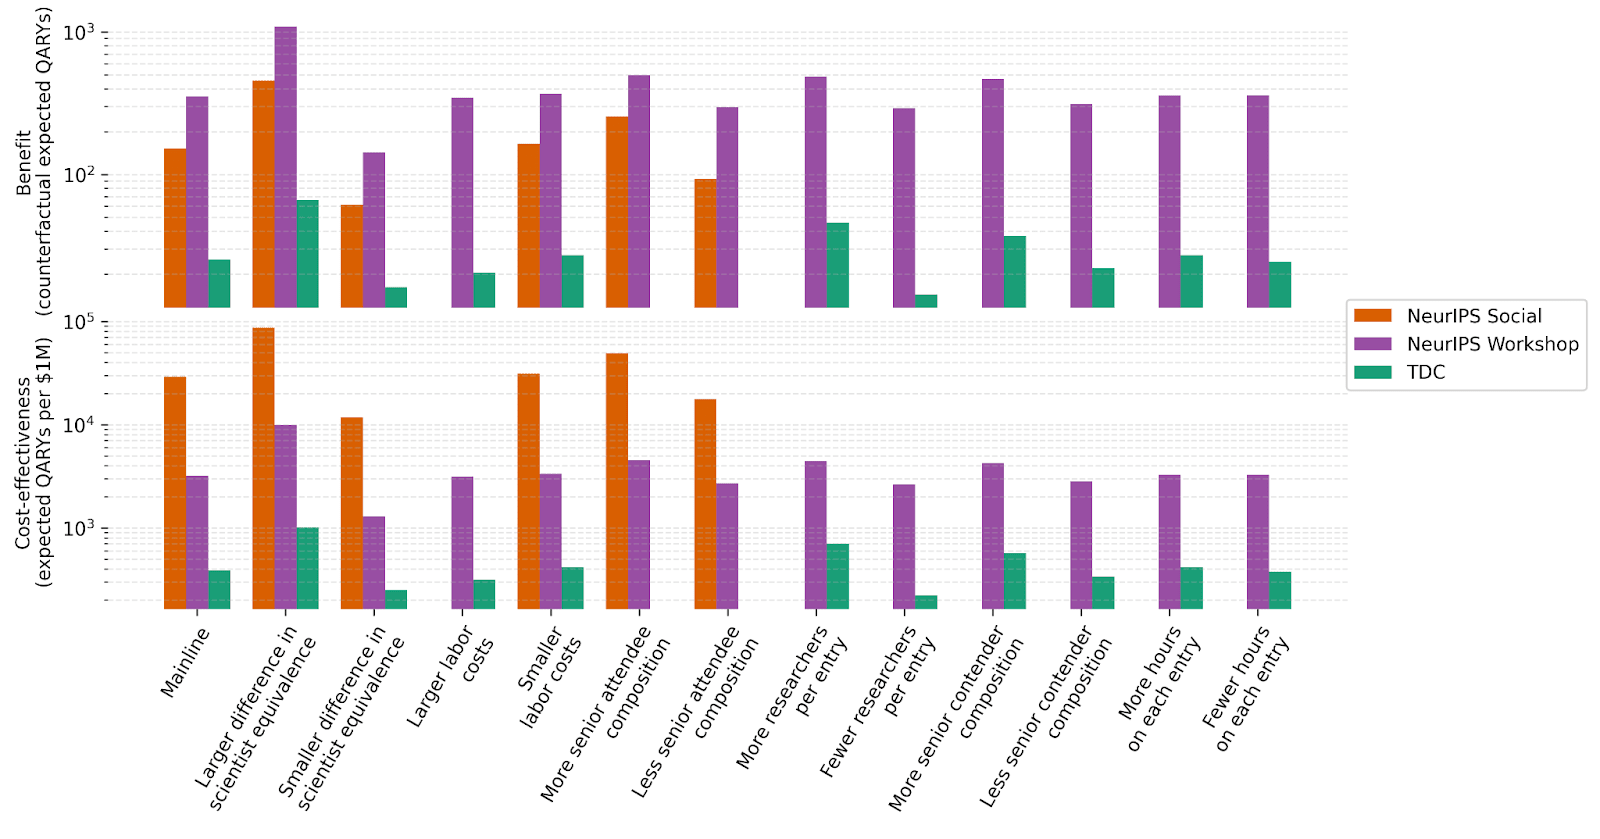
The above plot visualizes the robustness of our benefit and cost-effectiveness results to various scenarios. These scenarios simulate sizeable shocks to default beliefs or empirical parameters:
“Difference in scientist equivalence” inflates or deflates the scientist-equivalence gap between research scientists and other research professionals by a factor of 10^0.5.
“Labor costs” inflates or deflates hours spent working on the program by 10^0.25, and wages by 10^0.125.
“Researchers per entry” inflates or deflates the number of researchers of each type submitting to the TDC or NeurIPS Workshop by a factor of 10^0.25.
“Senior contender composition” inflates the number of research scientists and professors submitting to the TDC or NeurIPS Workshop — and deflates the number of research engineers and PhD students — by a factor of 10^0.25. (Or vice versa.)
“Hours on each entry” inflates or deflates the number of hours spent by researchers of each type on on submissions to the TDC or NeurIPS Workshop by a factor of 10^0.25.
“Senior attendee composition” inflates the average fraction of research scientists and professors attending the NeurIPS Social or NeurIPS Workshop — and deflates the average fraction of research engineers and PhD students — by a factor of 10^0.25. (Or vice versa.)
Results for the TDC and NeurIPS Workshop are somewhat stable (on log scale). Results for the NeurIPS Social are less stable. For a fixed budget of $5,250 — with only $2,600 allocated to variable costs in the default specification — increases in labor costs in particular can prevent the program from having enough budget remaining to support any participants.
Invitation to propose explicit models
This work represents a first step toward explicitly modeling the cost-effectiveness of AI safety programs, taking inspiration from cost-effectiveness models from other causes. To hold each other to a more objective and higher standard, we strongly suggest that people with different views or suggested AI safety interventions propose quantitative models going forward.
Acknowledgements
Thank you to:
Dan Hendrycks and Oliver Zhang for high-level guidance,
Aron Lajko for excellent research assistance,
Anonymized practitioners for help with parameters assumptions,
Miti Saksena, Steven Basart, Basil Halperin, Sam Manning, and Will Hodgkins for feedback, and
The Quantified Uncertainty Research Institute team for creating squiggle, and Peter Wildeford for creating squigglepy.
The model ignores several nuances when counting attendees. What constitutes enough engagement with an event in order to be considered an attendee? Is it enough to enter the physical or virtual event space for any period of time, or must participants reach some time threshold? In practice, we made very rough estimates of the number of people who stayed at the NeurIPS Social for >5 minutes or engaged with the NeurIPS Workshop for >=1 complete presentation.
For workshops, attendees are defined as people attending the workshop and not submitting research to it. This is to avoid double-counting the contributions of contenders who also attend the workshop.
For each program, we estimate relevance levels by asking practitioners for their beliefs about the distribution of research avenues pursued by participants, and how the program might have influenced this distribution, before adjusting for internal consistency. This is not a robust method for estimating such an important parameter. Future assessments should employ a more systematic approach — assessing the pre- and post-program research records of participants compared with some control population.
In the model, all functions over time are specified over a 60-year period from the program’s start. We have truncated the x-axis in our plots for ease of reading. This could only mislead for the probability of staying in AI subplots, where the other side of the sigmoid function is not visible.
There are two nuances here to note. Firstly, although in this post the number of participants has decreasing returns to variable costs, this could change under different scaling parameters. Secondly, cost could also affect benefit if the average ability among participants depends on their number. However, in this post, we assumed that ability is constant, regardless of the number of participants.
Of course, scaling specific program implementations is not the only way to scale. We might be interested in, for instance, running multiple implementations of each program within a research avenue and across conferences, or across research avenues within a single conference. This is an important strategic consideration, but we will not further expand on it in this post.
The extent to which current research will apply to more advanced models is a useful topic of discussion. Given that it seems increasingly likely that AGI will be built using deep learning systems, and in particular LLMs, we believe that studying existing systems can provide useful microcosms for AI safety. For instance, LLMs already exhibit forms of deception and power-seeking. Moreover, it seems likely that current work on AI honesty, transparency, proxy gaming, evaluating dangerous capabilities, and so on will apply to a significant extent to future systems based on LLMs. Finally, note that research on benchmarks and evals is robust to changes in architecture or even to the paradigm of future AI systems. As such, building benchmarks and evals are even more likely to apply to future AI systems.
Of course, it is true that more advanced models and conceptual frameworks do increase the relevance of AI safety research. For instance, we anticipate that once the LLM-agent paradigm gets established, research into AI power-seeking and deception will become even more relevant. Notwithstanding, we believe that, all things considered, AI safety research is currently tractable enough, and that the subfields are growing exponentially such that a 20% or even 30% discount rate is justified.

Thanks for doing this and for sharing the code! It's really great to have reproducible models – I know how much work it can take to do this, and I appreciate you being willing to go through the labor. I have submitted a couple small PR's with documentation improvements.
I wanted to better understand what you were doing, so I looked at the NeurIPS Social. If I understand correctly: the value from this social comes from attendees increasing their research relevance from 0.206 to 0.2574, an increase of ~25%.
At first glance, a 25% increase just from a social seems pretty surprising; digging in further: the major difference appears to be this line:
Which I guess means that you are assuming that 103 participants had an increase of 0.2 QARYs. Is that right? If so I would be interested to hear more about where that number came from.[1]
Also, you are dividing all these numbers by 400, which makes me think that the numerator is the total amount of QARY increase, and there were 400 attendees, so you are dividing by 400 to get the average increase, but the parameters you chose for the gamma distribution result in an average number of attendees around 312. So my guess is that one of these numbers is off?
You give more information on the NeurIPS workshop here, but I didn't see anything about the social – sorry if I missed it
I dug into this a bit more; I am not at all confident that I'm understanding things correctly (my code is here) but I printed out a few sanity checks on the numbers:
It continues to feel surprising to me that a social would cause 0.5 QARYs/attendee, but maybe there's something I'm missing (e.g. maybe you happen to know about a particularly valuable collaboration which was sparked at this event).