Hide table of contents

TLDR: GiveWell can be overestimating AMF net use by about 10 percentage points (90%-80%).

Net use weighted average based on 2020 data: 78%

According to Summary of AMF PDM results and methods [2020] (public) (edited copy) (cited by GiveWell in April 2022), 78.04% of nets of past AMF distributions are hanging (weighted average of “Nets received” and “% hanging” in the “Results: Net presence” tab).

Use of post-distribution survey data to approximate net use

A more accurate result could be obtained by collecting the net usage and distribution size data (and calculating a weighted average for net use percentage) from the AMF post-distribution reports. Post-distribution surveys have not been added to the AMF Distributions page since 2018 (filtering for “Distribution complete”, “Only those with surveys”). However, net usage data should be available for all distributions: “Approximately 5% of the nets distributed are assessed through visits to randomly selected households.” Another document cited by GiveWell suggests that AMF assesses net usage in 1.5% of households (commonly about 25 households per village) (and re-assesses 5% of the 1.5% for data quality).

Net use decrease over time possibility

Net use could decrease over time, as the nets are worn out. Significant decrease could require an integral approximation of net use. However, data shows that bednet use does not decrease significantly over time (using unweighted statistics, net use decreases by about 0.3% per month or by about 0.1% per month, if a 30-month outlier is not used). Thus, net use values from surveys conducted anytime between about 9 and 24 months post-distribution could be used. About 2.7% of nets is worn out between 9 and 11 months post-distribution. Thus, data collected earlier than 9 months post-distribution can approximate average net usage over 24 months post-distribution with the accuracy of low units of percentage points.

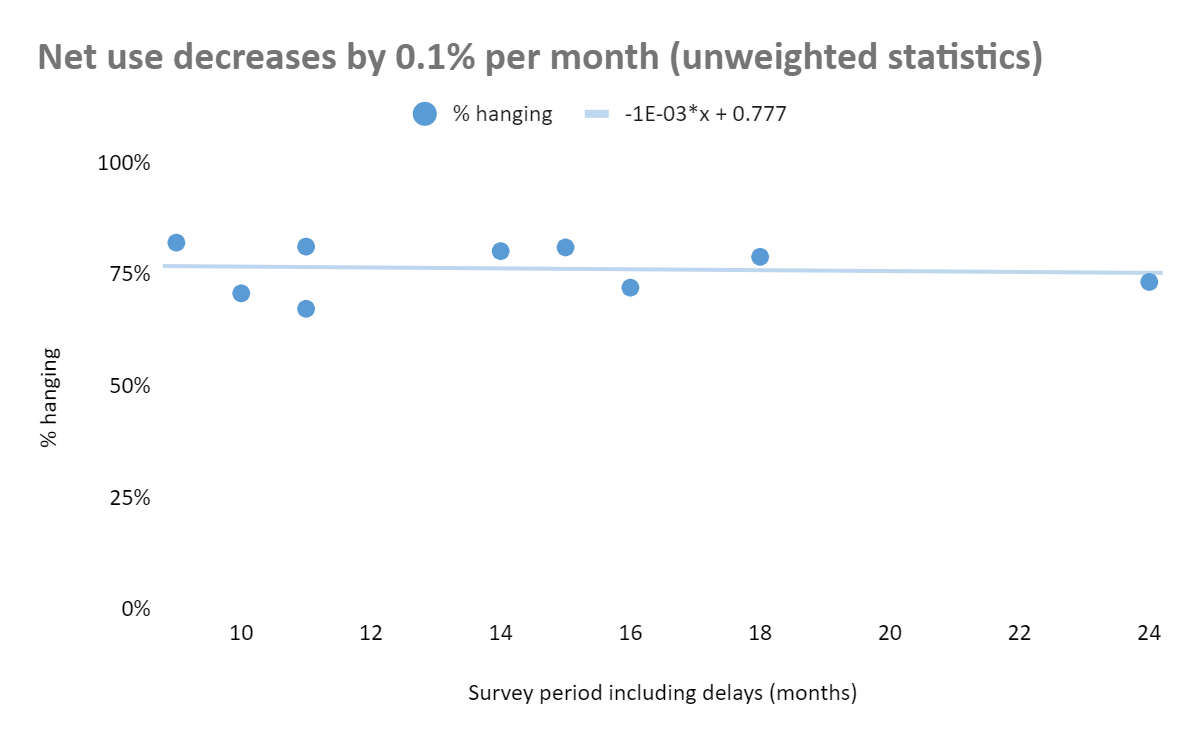
Including a 30-month post-distribution survey outlier.
Excluding a 30-month post-distribution survey outlier.

GiveWell cost-effectiveness analysis net use approximation: 90%

In its cost-effectiveness analysis, GiveWell uses 90% for AMF net use (line 50). Different (including more than 10 years old) resources are cited. Based on my review of some of the studies (not AMF reports), 90% use may be a slight overestimate. However, a more comprehensive and less biased reading of relevant literature, such as by an automated software, can better inform the average net use value, among distributions funded by AMF and by other actors.

Difference between GiveWell approximation and interpretation of empirical evidence

AMF post-distribution reports suggest that about 78% of AMF nets are used (this can be about 2.7% higher before any nets are worn out). Literature values and trends can be further examined. Expected net use based on past evidence and general trends, as well as any programs which can affect use patterns can be incorporated in GiveWell analyses. Currently, it seems that GiveWell can be overestimating net use by about 10 percentage points (90%-80%).

Conclusion

Empirical evidence suggests that GiveWell could be overestimating the AMF net use by about 10 percentage points (90%-80%). Further analysis of AMF post-distribution data, relevant literature, and net use factors is needed to better approximate expected AMF net use rates.

23

0
0

Reactions

0
0

More posts like this

Comments3


Sorted by Click to highlight new comments since:

Jonas here, AMF software engineer.

Thank you for your research! I would really like to publish more of AMF's PDM data to enable this kind of work. Unfortunately, we have to prioritize how we spend our time in the small AMF team, and this task hasn't made it to the top yet.

If you were interested in doing a more in-depth analysis (and have the time required for this) it might be good to let Rob (our CEO) know. This can help in prioritizing this type of task.

Done, thanks.

Hi, brb243! Would you please submit your contest entry via the form here? You can include a link to this post in the form if you like, or submit a Google doc link or upload a Word doc. Full contest guidelines here. Thanks so much for participating!

Best,

Miranda

Curated and popular this week
trammell
 ·  · 25m read
 · 
Introduction When a system is made safer, its users may be willing to offset at least some of the safety improvement by using it more dangerously. A seminal example is that, according to Peltzman (1975), drivers largely compensated for improvements in car safety at the time by driving more dangerously. The phenomenon in general is therefore sometimes known as the “Peltzman Effect”, though it is more often known as “risk compensation”.[1] One domain in which risk compensation has been studied relatively carefully is NASCAR (Sobel and Nesbit, 2007; Pope and Tollison, 2010), where, apparently, the evidence for a large compensation effect is especially strong.[2] In principle, more dangerous usage can partially, fully, or more than fully offset the extent to which the system has been made safer holding usage fixed. Making a system safer thus has an ambiguous effect on the probability of an accident, after its users change their behavior. There’s no reason why risk compensation shouldn’t apply in the existential risk domain, and we arguably have examples in which it has. For example, reinforcement learning from human feedback (RLHF) makes AI more reliable, all else equal; so it may be making some AI labs comfortable releasing more capable, and so maybe more dangerous, models than they would release otherwise.[3] Yet risk compensation per se appears to have gotten relatively little formal, public attention in the existential risk community so far. There has been informal discussion of the issue: e.g. risk compensation in the AI risk domain is discussed by Guest et al. (2023), who call it “the dangerous valley problem”. There is also a cluster of papers and works in progress by Robert Trager, Allan Dafoe, Nick Emery-Xu, Mckay Jensen, and others, including these two and some not yet public but largely summarized here, exploring the issue formally in models with multiple competing firms. In a sense what they do goes well beyond this post, but as far as I’m aware none of t
LewisBollard
 ·  · 6m read
 · 
> Despite the setbacks, I'm hopeful about the technology's future ---------------------------------------- It wasn’t meant to go like this. Alternative protein startups that were once soaring are now struggling. Impact investors who were once everywhere are now absent. Banks that confidently predicted 31% annual growth (UBS) and a 2030 global market worth $88-263B (Credit Suisse) have quietly taken down their predictions. This sucks. For many founders and staff this wasn’t just a job, but a calling — an opportunity to work toward a world free of factory farming. For many investors, it wasn’t just an investment, but a bet on a better future. It’s easy to feel frustrated, disillusioned, and even hopeless. It’s also wrong. There’s still plenty of hope for alternative proteins — just on a longer timeline than the unrealistic ones that were once touted. Here are three trends I’m particularly excited about. Better products People are eating less plant-based meat for many reasons, but the simplest one may just be that they don’t like how they taste. “Taste/texture” was the top reason chosen by Brits for reducing their plant-based meat consumption in a recent survey by Bryant Research. US consumers most disliked the “consistency and texture” of plant-based foods in a survey of shoppers at retailer Kroger.  They’ve got a point. In 2018-21, every food giant, meat company, and two-person startup rushed new products to market with minimal product testing. Indeed, the meat companies’ plant-based offerings were bad enough to inspire conspiracy theories that this was a case of the car companies buying up the streetcars.  Consumers noticed. The Bryant Research survey found that two thirds of Brits agreed with the statement “some plant based meat products or brands taste much worse than others.” In a 2021 taste test, 100 consumers rated all five brands of plant-based nuggets as much worse than chicken-based nuggets on taste, texture, and “overall liking.” One silver lining
 ·  · 6m read
 · 
Cross-posted from Otherwise. Most people in EA won't find these arguments new. Apologies for leaving out animal welfare entirely for the sake of simplicity. Last month, Emma Goldberg wrote a NYT piece contrasting effective altruism with approaches that refuse to quantify meaningful experiences. The piece indicates that effective altruism is creepily numbers-focused. Goldberg asks “what if charity shouldn’t be optimized?” The egalitarian answer Dylan Matthews gives a try at answering a question in the piece: “How can anyone put a numerical value on a holy space” like Notre Dame cathedral? For the $760 million spent restoring the cathedral, he estimates you could prevent 47,500 deaths from malaria. “47,500 people is about five times the population of the town I grew up in. . . . It’s useful to imagine walking down Main Street, stopping at each table at the diner Lou’s, shaking hands with as many people as you can, and telling them, ‘I think you need to die to make a cathedral pretty.’ And then going to the next town over and doing it again, and again, until you’ve told 47,500 people why they have to die.” Who prefers magnificence? Goldberg’s article draws a lot on author Amy Schiller’s plea to focus charity on “magnificence” rather than effectiveness. Some causes “make people’s lives feel meaningful, radiant, sacred. Think nature conservancies, cultural centers and places of worship. These are institutions that lend life its texture and color, and not just bare bones existence.” But US arts funding goes disproportionately to the most expensive projects, with more than half of the funding going to the most expensive 2% of projects. These are typically museums, classical music groups, and performing arts centers. When donors prioritize giving to communities they already have ties to, the money stays in richer communities. Some areas have way more rich people than others. New York City has 119 billionaires; most African countries have none. Unsurprisingly, Schill
Relevant opportunities