I really like the idea behind this post/series. I'd already come across Lindy's Law/delta T and the rule of succession, by reading other people use it in their predictions, but I had already thought that this was a really inefficient way to learn. I skimmed a few statistics textbooks, but I did not come across a lot of techniques that I actually ended up using.
I also liked the examples you gave. I felt like 1-3 explicit practice Problems at the end would also have been nice like:
Tesla was founded in 2003.
How many years from now does tesla have a 25/75% chance to exist?
Or maybe this is silly?
Anyway...
I knew that the Lifetime of something depends on the time it stuck around and had a rough mental image of the distribution, but so far I did not actually bother calculating it explicitly. So thanks for the heuristics.
Your post actually made me think about how very often the lifetime of something is very dependent on the lifetime of something else whose distribution is better known. Often you can just substitute one probability for the other, but sometimes this is more difficult. For example, when someone is 60 and he has been in the same company for 45 years then I don't expect him to stay another 45, because I roughly know when people tend to retire which in turn is dependent on the expected lifetime of someone. The most extreme/ridiculous form of this is of course how every long-term forecast you make can be totally dominated by your timelines for AGI.
Nice post! Found it through the forum digest newsletter. Interestingly I knew Lindy's Law as the "Copernican principle" from Algorithms to Live By, IIRC. Searching for the term yields quite different results however, so I wonder what the connection is.
Also, I believe your webcomic example is missing a "1 -". You seem to have calculcated p(no further webcomic will be released this year) rather than p(there will be another webcomic this year). Increasing the time frame should increase the probability, but given the formula in the example, the probability would in fact decrease over time.
The relationship between Lindy, Doomsday, and Copernicus is as follows:
The "Copernican Principle" is that "we" are not special. This is a generalisation of how the Earth is not special: it's just another planet in the solar system, not the centre of the universe.
In John Gott's famous paper on the Doomsday Argument, he appeals to the the Copernican Principle to assert "we are also not special in time", meaning that we should expect ourselves to be in a typical point in the history of humanity.
The "most typical" point in history is exactly in the middle. Thus your best guess of the longevity of humanity is twice its current age: Lindy's Law.
This is a series of posts for the Bayesian in a hurry. The Bayesian who wants to put probabilities to quantities, but doesn't have the time or inclination to collect data, write code, or even use a calculator.
In these posts I'll give a template for doing probabilistic reasoning in your head. The goal is to provide heuristics which are memorable and easy to calculate, while being approximately correct according to standard statistics. If approximate correctness isn't possible, then I'll aim for intuitively sensible at least.
An example of when these techniques may come in handy is when you want to quickly generate probabilistic predictions for a forecasting tournament.
In this first post, I'll cover cases where you have a lower bound for some positive value. As we'll see, this covers a lot of real-life situations. In future posts I'll use this as a foundation for more general settings.
For those who struggle with the mathematical details, you may skip to the TL;DRs.
The Delta T Argument
We'll use what John Gott called it the "delta t argument" in his famous Doomsday Argument (DA). It goes like this:
Suppose humanity lasts from time 0 to time T.
Let Tp<T be the present time, and p=Tp/T be the proportion of humanity's history which has so far passed.
p is drawn from a uniform distribution between zero to one. That is, the present is a totally random moment in the history of humanity.
The probability that p is less than some value p′ is
Pr(p<p′)=p′=Pr(TpT<p′)=Pr(Tpp′<T)
5. Let t=Tp/p′>Tp. Then humanity's survival function (the probability of humanity suviving past time t) is hyperbolic:
Pr(t<T)=Tpt
6. And the density function for human extinction is given by
Pr(t=T)=−dPr(t<T)dt=Tpt2.
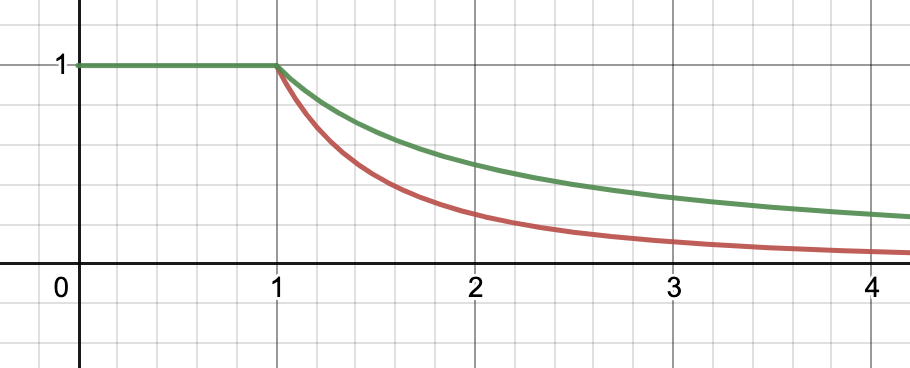
These distributions are illustrated below:
If we choose time units so that Tp=1, then humanity's survival function is given in green, and the extinction density function is given in red.
TL;DR The probability of a process surviving up to a certain time is equal to the proportion of that time which has already been survived. For example, the probability of a house not catching fire after 40 years, given it has so far lasted 10 years without catching fire, is 10/40=0.25.
Lindy's Law
Lindy's Law states that a process which has suvived up to time Tp, will on average survive a further Tp. This is true for the delta t distribution, as long as we interpret "average" to mean "median":
Pr(2Tp<T)=Tp2Tp=0.5
However, the mean lifespan of humanity is undefined:
∫∞TptPr(t=T)dt=∫∞Tptt2dt=∫∞Tp1tdt=∞
On a related note, because our density function decreases with the inverse square of time, it is "fat tailed", meaning that it dies off sub-exponentially. It belongs in Nassim Taleb's Extremistan.
TL;DR A process which has survived x amount of time, will with 50% probability survive another x amount of time. For example, a house which has lasted 10 years without burning down, will survive another 10 years without burning down with 50% confidence.
50% Confidence Intervals
We can thus derive a 50% confidence interval by finding the t values at which humanity has a 25% chance of surviving, and a 75% chance of surviving. The first is obtained from
Pr(t<T)=Tpt=0.25=14
which when we solve for t gives
t=4Tp.
The second is obtained from
Pr(t<T)=Tpt=0.75=34
which gives
t=43Tp
So with 50% confidence we have
43Tp<T<4Tp
which we can remember with the handy mnemonic:
Adding a third is worth a lower quartile bird.
Times-ing by four gets your last quartile in the door.
In the case of human extinction: Homo Sapiens have so far survived some 200,000 years. So with 50% confidence we will survive at least another 60,000 years, and at most another 800,000 years.
TL;DR A process which has survived x amount of time, will with 50% confidence survive at least another x/3 and at most another 3x amount of time.
90% Confidence Interval
By similar reasoning, we can say with 90% confidence that
2019Tp<T<20Tp
But it's hard to muliply by 20/19. So instead we'll approximate it with
2120Tp<T<21Tp
Thus, with about 90% confidence, the remaining lifespan is more than 1/20th of its current lifespan, but less than 20x its current lifespan.
Similarly, we can say that with about 99% confidence the remaining lifespan is more than 1/200th the current lifespan, but less 200x times the current lifespan. And so on with however many nines you like.
So with 90% confidence, humanity will survive at least another 10,000 years, and at most another 4,000,000 years, and with 99% confidence between 1,000 and 40,000,000 further years.
TL;DR A process which has survived x amount of time, will with 90% confidence survive at least another x/20 and at most another 20x amount of time.
The Validity of the Doomsday Argument
A lot of people think the DA is wrong. Should this concern us?
I think in the specific case of predicting humanity's survival: yes, but in general: no.
When you apply the delta t argument to humanity's survival you run into all kinds of problems to do with observer-selection effects, disagreements about priors, disagreement about posteriors, and disagreement about units. For an entertaining discussion of some of the DA's problems, I recommend Nick Bostrom's The Doomsday Argument, Adam & Eve, UN⁺⁺, and Quantum Joe.
But when you apply delta t argument to an everyday affair, such as the time until your roof starts leaking, then you needn't worry about most (or all) of these problems. There are plenty of situations where "the present moment is a random sample from the lifetime of this process" is a perfectly reasonable characterisation.
Let's look at some everyday examples.
Examples
Example 1: Will a new webcomic be released this year?
Your favourite webcomic hasn't released any new installments since 6 months ago. What is the probability of a new installment this calendar year (ie, within next 9 months)?
Answer: The probability of the no-webcomic streak continuing for a further 9 months is
66+9=615
Which is a little over a third. Maybe 35%. So the probability of there being a comic is about 65%.
Answer: 3 years is about 1,000 days, so 30 years is about 10,000 days. The probability that the sun rising streak ends on the 10,001st day is
Pr(t=10,001)=10,00010,0012≈110,001
Which itself is going to be approximately 1/10,000=0.001%. So the sun will rise with 99.999% confidence.
"Real" answer: Laplace's answer to the sunrise problem was to start with a uniform prior over possible sunrise rates, so that the posterior comes out as
Pr(t=Tp+1)=1Tp+2
This is the "rule of succession", and which in our case also gives something very close to 0.001%. Alternatively, we could use the Jeffreys prior and get
Pr(t=Tp+1)=1.5Tp+3
which will be something more like 0.0015%.
Example 4: German Tanks
You have an infestation of German tanks in your house. You can tell they're German because they're tan with dark, parallel lines running from their heads to the ends of their wings. You know that the tanks have serial numbers 1,2,…,N written on them. You inspect the first tank you find and it has serial number n=100. How many tanks are in your house?
Answer: 120-2,000 with 90% confidence. Median is 200.
"Real" answer: If we are doing frequentist statistics, the the minimum-variance unbiased point estimate is 2n−1, so 199. The frequentist confidence intervals are gotten by the same formula as the delta t argument, so we again have 120-2,000 with 90% confidence.
The Bayesian story is complicated. If we have an improper uniform prior over N, then we get an improper posterior. But if we had inspected two tanks, and the larger serial number was 100, then we would have a median estimate of 2n−1=199 (the mean is undefined). If our prior of N was a uniform distribution between 1 and and upper bound Ω, then the posterior looks like
Pr(N|n)=1N(∑Ω−1k=1k−1−∑n−1k=1k−1)
which has approximate mean
Ω−nlog(Ω−1n−1)
So if we have an a priori maximum of Ω=1,000,000 tanks, then the mean will be something like 1,000,000/20=50,000. Weird.
I don't know what happens if you use other priors, like exponential.
Next time...
In future posts in this series I'll cover situations where you need estimating a distribution from a single data point.
Impressions from the 21st Annual U.S. Cluster Headache Patient Conference, organized by Clusterbusters.
On the morning of the last day of the conference, E. was hanging out with other “clusterheads” outside the conference hotel when he started having a cluster headache attack. Before he could go back to his hotel room, J. offered E. his DMT v...
TL;DR:
The movement has an evidence problem. To solve it, for each intervention we need to know:
* What types of evidence that intervention needs
* What types of evidence different sources can give us
In this post, we outline a framework for evidencing an intervention through five stages:
...


I really like the idea behind this post/series. I'd already come across Lindy's Law/delta T and the rule of succession, by reading other people use it in their predictions, but I had already thought that this was a really inefficient way to learn. I skimmed a few statistics textbooks, but I did not come across a lot of techniques that I actually ended up using.
I also liked the examples you gave. I felt like 1-3 explicit practice Problems at the end would also have been nice like:
Tesla was founded in 2003.
Or maybe this is silly?
Anyway...
I knew that the Lifetime of something depends on the time it stuck around and had a rough mental image of the distribution, but so far I did not actually bother calculating it explicitly. So thanks for the heuristics.
Your post actually made me think about how very often the lifetime of something is very dependent on the lifetime of something else whose distribution is better known. Often you can just substitute one probability for the other, but sometimes this is more difficult. For example, when someone is 60 and he has been in the same company for 45 years then I don't expect him to stay another 45, because I roughly know when people tend to retire which in turn is dependent on the expected lifetime of someone. The most extreme/ridiculous form of this is of course how every long-term forecast you make can be totally dominated by your timelines for AGI.