Comments
Summary
Key points:
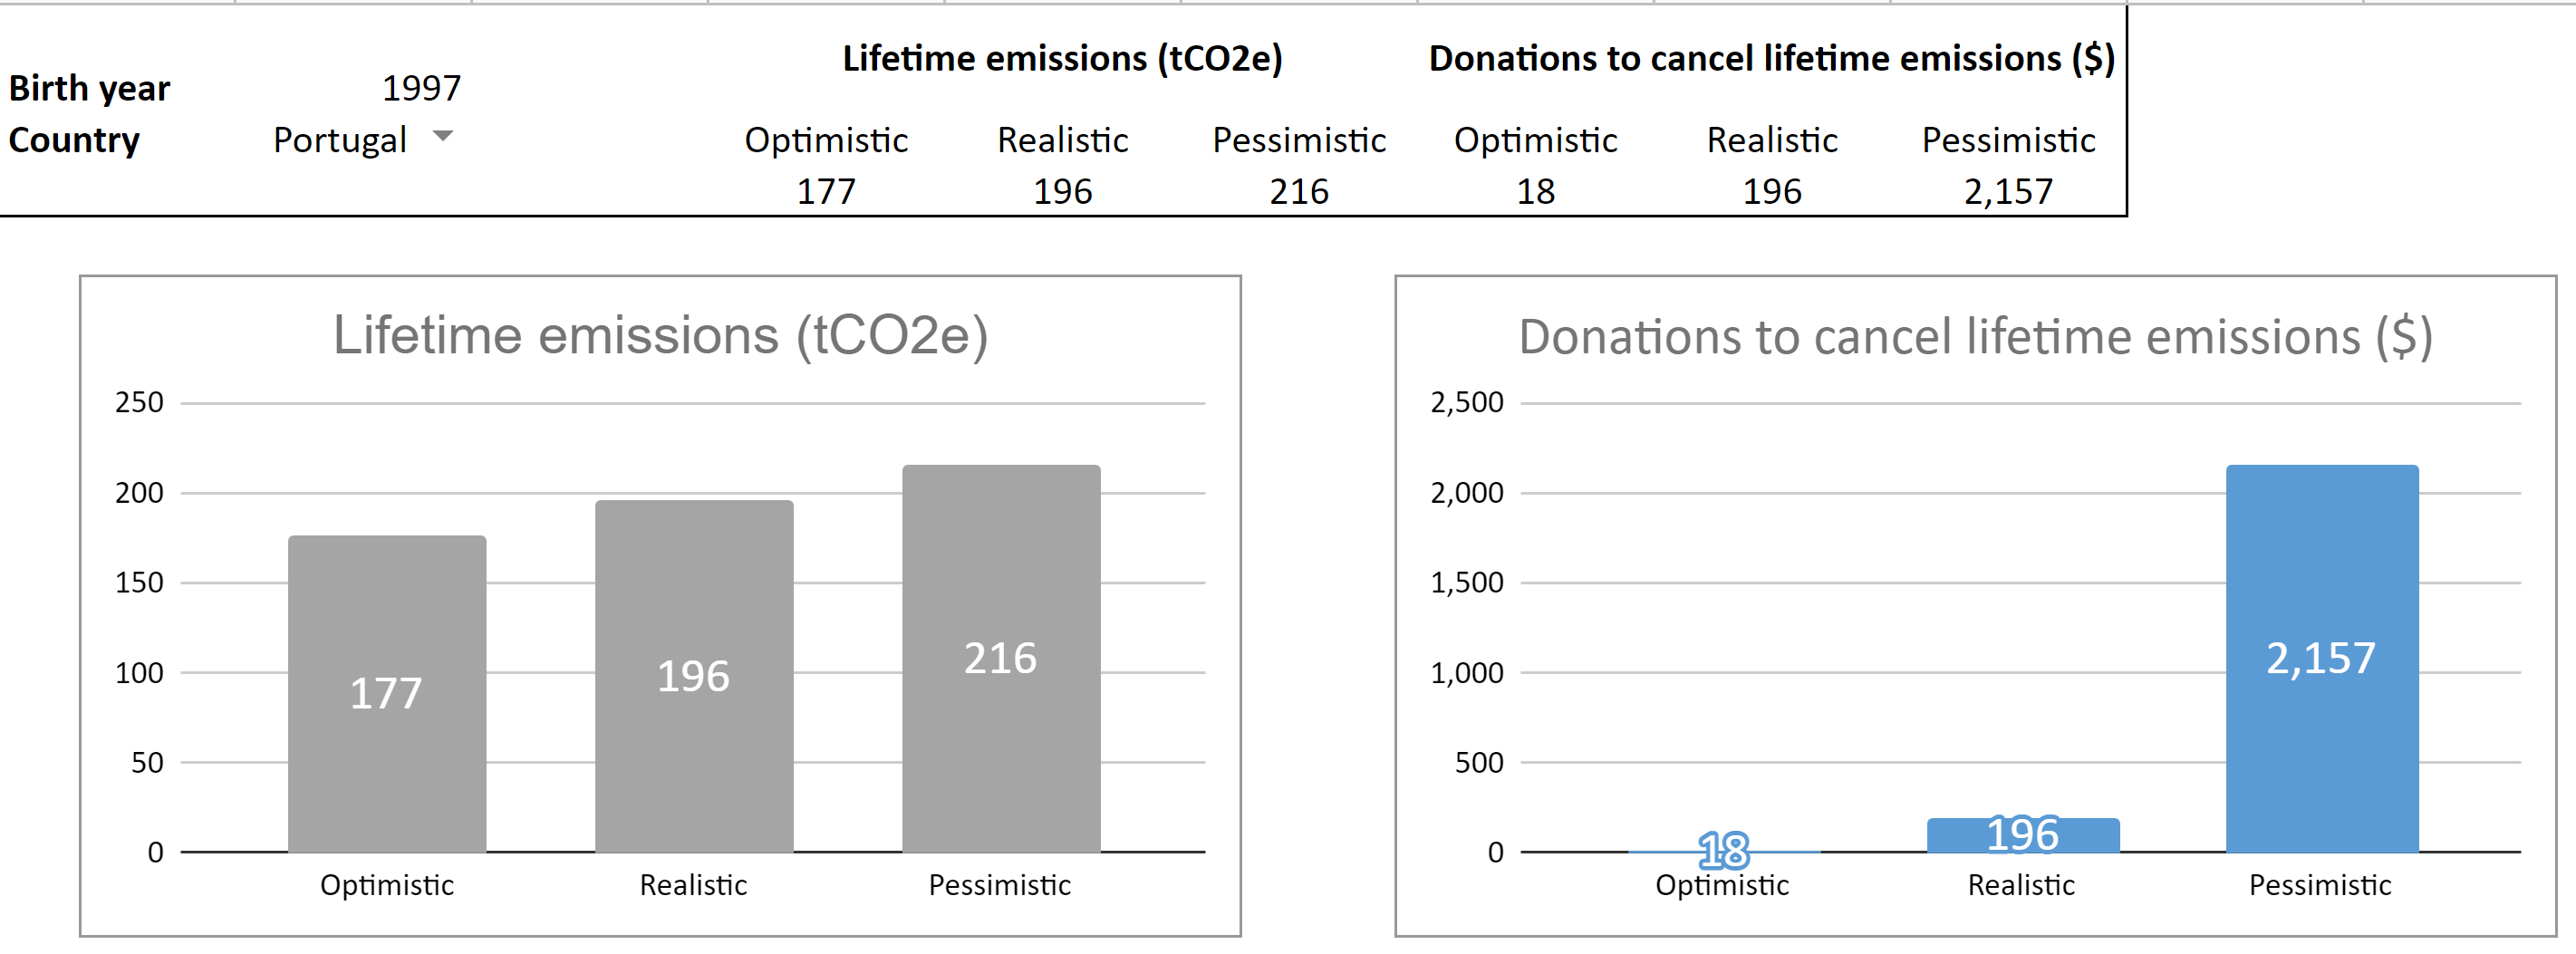
- You could find in this spreadsheet graphs for the lifetime GHG (greehouse gas) emissions, and donations to effective climate charities (e.g. CATF) needed to cancel them, for pessimistic, realistic and optimistic scenarios.
- The results are presented for a selected birth date and country, which could be adjusted by making a copy of the spreadsheet.
- The effective donations needed to cancel the lifetime emissions are about:
- 10 $ to 100 $ for the optimistic scenarios.
- 100 $ to 1 k$ for the realistic scenarios.
- 1 k$ to 10 k$ for the pessimistic scenarios.
- It is worth having these rough estimates in mind when assessing lifestyle choices for minimising GHG emissions (as has been noted before, for example, here).
Disclaimers[1]:
- Effective donations and other lifestyle decisions are often complementary instead of mutually exclusive.
- Effective donations are better seen as a great way of increasing impact. Thinking about donations as a form of offsetting could limit our ambition, and therefore tends to lead to a smaller impact.
- The goal of the calculations described here is not to accurately predict the lifetime GHG emissions and the donations required to cancel them, but to obtain rough estimates.
The methodology I followed to define the cost-effectiveness and estimate the lifetime GHG emissions, as well as some results, are presented below.
Acknowledgements
Thanks to Johannes Ackva for feedback.
Methodology
Cost-effectiveness
For the cost-effectiveness of the donations, I assigned values of 10 tCO2/$, 1 tCO2/$ and 0.1 tCO2/$ to the optimistic, realistic and pessimistic scenarios (but these could be adjusted in the tab "Inputs"). These are reasonable estimates assuming the donations go to effective climate organisations:
- The most recent Founders Pledge report related to climate philanthropy presents a back-of-the-envelope-calculation of the cost-effectiveness of the "work of Clean Air Task Force (CATF) that went into the 2018 reform of a tax credit 45Q" (see section "Conservative impact analysis example of innovation in neglected tech").
- They "conservatively" "estimate the global cost of saved carbon to be approximately $0.11/tonne", assuming:
- "A 5% chance that CATF was essential in moving a CCS incentive policy forward in time by 2 years".
- "A 50% chance that this policy has no effect at all".
- "If the policy has the estimated effects, a 10% learning rate and a 50% cost reduction leading to additional deployment of CCS at 10% of average CCS deployment levels in representative IPCC 1.5 degree scenarios".
- With "effective climate organisations", I refer to organisations whose expected marginal cost-effectiveness is about 1 $/t.
- Besides CATF, these include TerraPraxis (TP) and Future Cleantech Architects (FCA), which received grants from Founders Pledge in November 2021 together with CATF.
Lifetime GHG emissions
To determine the lifetime GHG (greenhouse gas) emissions, including LUCF (land use change and forestry), I used the following methodology:
- The lifetime emissions were estimated as a function of the birth year and country. For each year between the birth date and the year the 2019 life expectancy at birth is reached, the annual emissions are defined from the GHG emissions per capita of the country.
- For years before 1990, I could not find data about GHG emissions per capita by country, and therefore estimated them scaling the 1990 CO2e emissions per capita based on the CO2 emissions per capita, which exclude other GHGs and LUCF.
- For example, if the 1980 CO2 emissions per capita were 80 % of the 1990 CO2 emissions per capita, the 1980 GHG emissions per capita are also assumed to be 80 % of the 1990 GHG emissions per capita.
- For years between 1990 and 2018, the GHG emissions per capita were readily available.
- For years after 2018, the GHG emissions were assumed to decrease linearly from the 2018 levels to zero, between 2018 and the net zero target year.
- This tends to underestimate the lifetime emissions for countries whose GHG emissions per capita have not yet peaked.
- The GHG emissions per capita are assumed to be kept at zero after the net zero target year.
- This tends to overestimate the lifetime emissions for countries which become carbon negative after reaching net zero.
- For the optimistic, realistic and pessimistic scenarios, the time between 2018 and the net zero target year is assumed to be 25 % shorter, equal and 25 % longer than the baseline net zero target year (but these could be adjusted in the tab "Inputs").
Results
Graphs for the lifetime emissions and donations to effective climate charities needed to cancel them for a pessimistic, realistic and optimistic scenario, for a selected birth date and country (which could be adjusted by downloading a copy of the spreadsheet), are presented in the tab "Dashboard". Here is an example:
A table with the above results for the 68 analysed countries, whose net-zero has been achieved or pledged according to OWID (apart from Monaco), is in the tab "Results".
The following table contains the donations to effective climate charities needed to cancel the lifetime emissions, selecting 1997 as the birth year, for the 12 countries whose emissions profile has been the most visited in OWID. The effective donations needed to cancel the lifetime emissions are about:
- 10 $ to 100 $ for the optimistic scenarios (simply, "1 t/yr to 10 t/yr"*"100 years"*"0.1 t/$").
- 100 $ to 1 k$ for the realistic scenarios (simply, "1 t/yr to 10 t/yr"*"100 years"*"1 t/$").
- 1 k$ to 10 k$ for the pessimistic scenarios (simply, "1 t/yr to 10 t/yr"*"100 years"*"10 t/$").
It is worth having these rough estimates in mind when assessing lifestyle choices for minimising GHG emissions. A list of lifestyle choices and respective averted emissions can be found here.
| Country | Donations to effective climate charities needed to cancel lifetime GHG emissions ($) | ||
|---|---|---|---|
| Optimistic | Realistic | Pessimistic | |
| Australia | 59 | 649 | 7,114 |
| Brazil | 20 | 220 | 2,402 |
| Canada | 68 | 743 | 8,088 |
| China | 21 | 245 | 2,807 |
| France | 15 | 166 | 1,814 |
| India | 6 | 72 | 800 |
| Spain | 20 | 216 | 2,372 |
| South Africa | 26 | 292 | 3,223 |
| Sweden | 11 | 112 | 1,184 |
| United Kingdom | 23 | 251 | 2,717 |
| United States | 54 | 600 | 6,577 |
- ^
These disclaimer are very much aligned with what is listed after "What we are not saying" in Founders Pledge Climate & Lifestyle report.