Comments
TL;DR
Weighted factor models (WFMs) are a great tool for considering multiple facets of a problem quantitatively. However, including factors like population size can dominate the calculation if they aren’t properly handled. Normalization with Z-scores is often treated like a silver bullet that fixes this issue, but I demonstrate that it introduces more problems.
Before using any tool, we should understand its strengths and weaknesses and identify how that may impact our results. When your measurement tool has a flaw, that flaw might become your finding.
What is a Weighted Factor Model?
Suppose you are trying to make a decision with options that vary across many dimensions that matter to different extents. A weighted factor model lets you consider all of these factors simultaneously in a more quantitative fashion than reasoning alone.
The general pathway for making a WFM is as follows.[1]
- Decide what options you are considering and what factors you care about.
Let’s compare donating to the fictional charities End Malaria Now (EMN), Malaria Prevention Program (MPP), and Stop Vector Mosquitoes (SVM).
We’ll use the following factors: their estimated cost-effectiveness, the potential scale that the program could reach in 5 years, and the strength of evidence to support their method.
For estimated cost-effectiveness and potential scale, we’ll use estimates of lives saved per $100k and potential lives saved per year. For strength of evidence, we’ll just use a subjective ranking from 0-10. One great part of WFMs is they let you combine hard numbers and subjective estimates in your decision making process.
- Weight those factors according to their importance to your decision.
Estimated cost-effectiveness is most important, so let’s use 60% for that category. Then, let’s give 20% to strength of evidence and 20% to potential scale.[2]
- Rank each of the options on each factor and score the results.
Some made up numbers for each charity are in the following table.
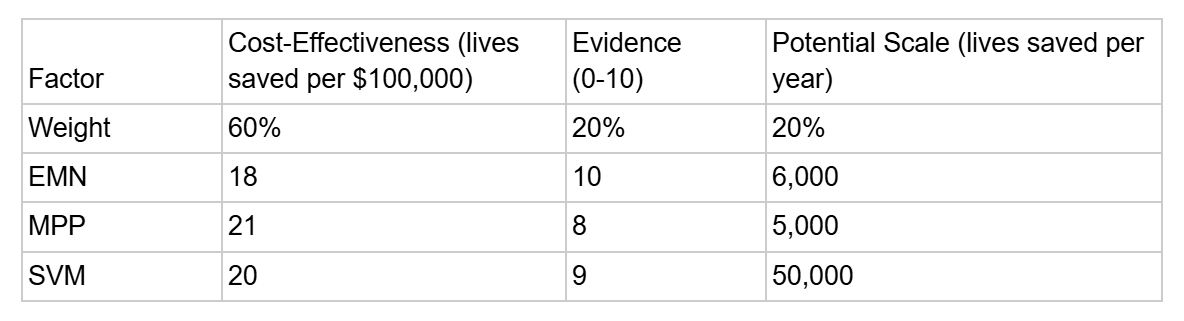
Now, we can create a composite score for each value by multiplying the values in each row by their corresponding weights and adding it up.
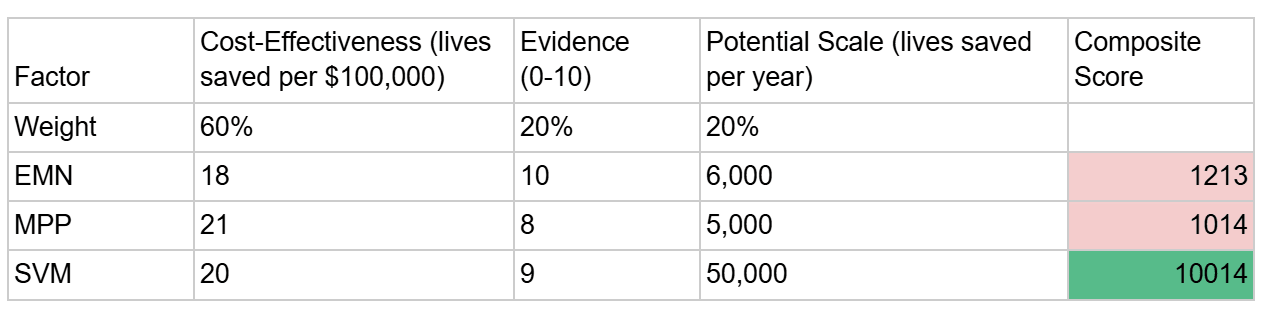
Oh no! It seems our composite ranking is just a measure of potential scale and the other columns got washed away. Luckily, we can fix this.
Help! My Weighted Factor Model is Just a Population Ranking!
Generally, when you use real world data in a weighted factor model, it’s a good idea to normalize the values rather than pasting them exactly. Otherwise, you end up with the size of the factor changing its weight, which distorts the calculation in fairly arbitrary ways. I could have measured “tens of thousands of lives saved per year” (which would have dampened the effect) or “lives saved per $100,000,000” (which would have made cost-effectiveness dominate). This effect often shows up when population statistics appear in WFMs, since they regularly vary by orders of magnitude.
The typical method for normalization consists of using Z-scores, which measure how much a number varies relative to other values in the list. It is generally advised to use Z-scores for all “real” numbers (that is, numbers with a source). You do not need to normalize subjective rankings on a set scale (which are, in essence, already normalized).[3]
The following table shows what the table looks like if you use Z-scores for cost-effectiveness and potential scale.
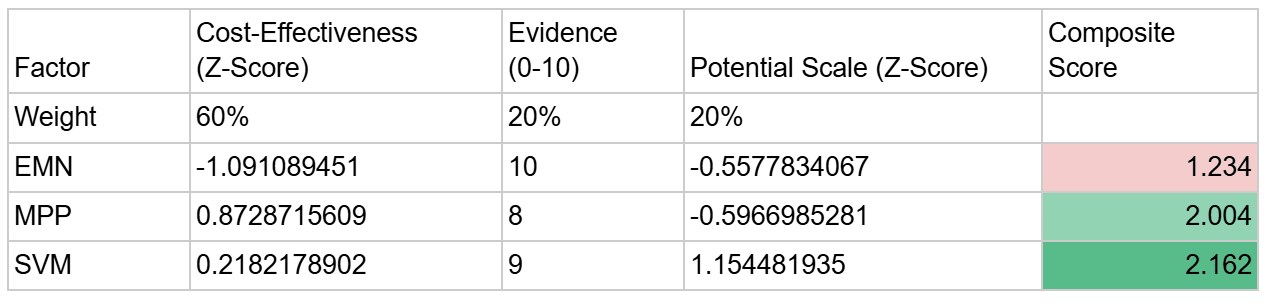
This is much more reasonable. It turns out that Stop Vector Mosquitoes still ranks the highest, but the cost-effectiveness and evidence are relevant to the rankings. Malaria Prevention Program ranks higher than End Malaria Now this time! Thanks to normalization, its larger cost-effectiveness (21 lives per $100,000 vs 18 lives per $100,000) actually plays a role in the comparison.
Now, we have completely solved all methodological issues with weighted factor models, so our work here is done! That’s why there are no more sections to this post.
A Challenger Arises
As I was ready to make my donation to Stop Vector Mosquitoes (thanks to my weighted factor model), a friend told me about a new charity I should consider. They said it had a projected cost-effectiveness of one life saved per $10 - much better than any other charity on my list. I’m immediately excited (though skeptical) and ask them what organization they are referring to.
They tell me about Ask Mosquitoes Politely to Stop (AMPS), an organization that prevents Malaria by having polite conversations with mosquitoes, asking them to stop being a vector for a deadly disease. Thanks to their highly-scalable model, they believe they will be able to end malaria entirely.
Obviously, Ask Mosquitoes Politely to Stop is not going to work, but I’ve already promised my (totally real) friend I’d look into it, so let’s see what happens. Here’s the model without normalization.
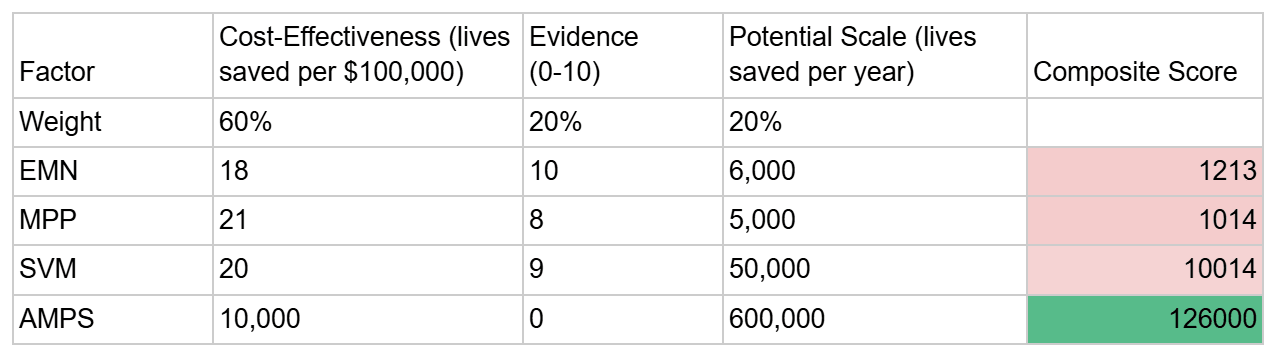
AMPS believes they can scale to stop Malaria entirely, and they believe that their cost-effectiveness will be one life saved per $10.[4] However, they have no evidence to support this. Without normalization, AMPS ends up on top, which is a big problem.[5] Let’s normalize our values…
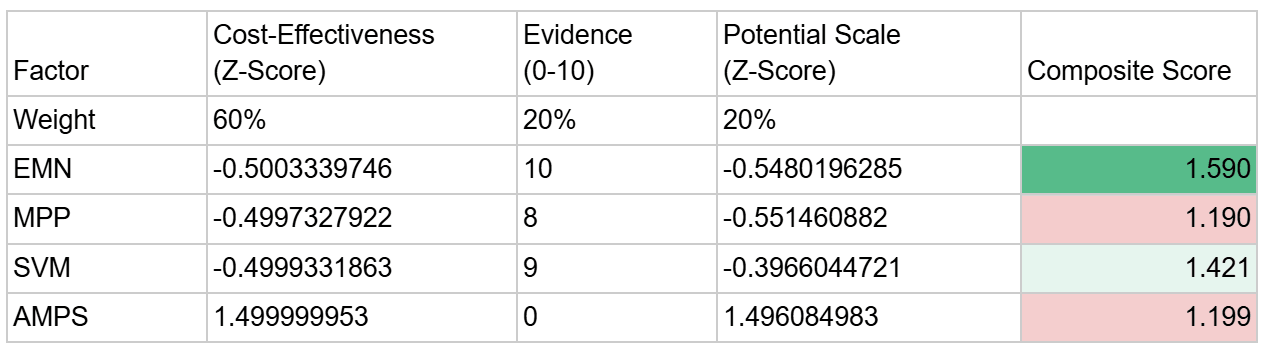
That makes a bit more sense. With values normalized, AMPS drops considerably. The top charity is actually… End Malaria Now? That doesn't make sense. They were at the bottom of the earlier ranking!
Here’s the problem: When setting up a Weighted Factor Model using normalization, your baseline for "normal" is dictated by the options you are comparing. If one of your options is an outlier on one factor, it makes all other differences in that category vanish. In this case, because AMPS was such a big outlier in cost-effectiveness and potential scale, all the other options were only meaningfully compared in terms of evidence. End Malaria Now rose to the top because it was strong in one category that was supposed to be worth 20%.
Including an option such as AMPS is risky not just because you might pick it, but because it will distort your ability to distinguish between the other options.
There are ways around this, such as applying a logarithmic scale or multiplying your data by some linear scaling factor. Each of these options has their own upsides and downsides. As an upside, adding a new option to the list with a logarithmic or linear scale will not distort the rankings of the existing options. As a downside, AMPS would win under both systems.[6]
Conclusion
We could try to make the perfect WFM normalization system, but there is a more important truth here. We are trying to make decisions about a messy world with imperfect information. Any simple system is going to be trading away truth for practicality.
Weighted Factor Models have strengths and weaknesses. So do cost-effectiveness analyses. So does expected value reasoning. So does every other tool. When using any decision making tool, it is important to understand what those strengths and weaknesses are before applying it. When you’re done, consider whether your conclusion is likely to be more reflective of reality or simply the flaws of your tool.
- ^
For a more comprehensive walkthrough, I strongly recommend this article here. The book “How to Launch a High Impact Nonprofit” from Charity Entrepreneurship also has a chapter that goes into greater depth on WFMs.
- ^
These are arbitrary percentages for the sake of this example.
- ^
There may be good reasons to normalize even subjective values. However, this is not commonly recommended and it is not relevant to my core point.
- ^
Obviously, this estimate is wildly inaccurate, but I will take it literally for the sake of argument.
- ^
One common way to combat edge cases like this is to put in hard limits. For example, because we don’t want to invest in an idea with weak support for its efficacy, we could add a hard limit of 5 for strength of evidence. If any idea has weaker evidence than a 5/10, we would then ignore it in our final ranking.
- ^
This is because neither scaling technique constrains values to a fixed range. A big enough number will still distort that category, and AMPS has some very big numbers.
Technically you could choose tiny linear scaling factors for cost-effectiveness and potential scale that would preserve the order and make AMPS lose. However, that system would deprioritize cost-effectiveness and potential scale so much that the ranking would be completely determined by strength of evidence. That’s the exact problem we ran into with Z-score normalization when AMPS was considered, but it would happen even when AMPS is not considered. The worst of both worlds!

Thanks for writing this up :)
When do you think it's best to use WFM vs expected value calculation?
Asking as I tend to use EV for charity choice. As I see it: pro of EV is it captures variables like scale really nicely, pro of WFM is it's more robust to imperfect inputs.
I think EV is one valuable (but incomplete) metric for evaluating charities. WFMs can capture EV as well as other variables that are harder to incorporate quantitatively. However, creating BOTECs to estimate EV is a lot faster than making a full WFM. Which one to use is, in my view, a question of whether the importance of your decision justifies that extra effort or whether your time would be better spent on other decisions/work.
Regardless which one you choose, you should be careful not to rely on just the one tool. EV reasoning is vulnerable to Pascal's Mugging and the Optimizer's Curse. WFM is vulnerable to the issues I talked about in my post and more. The underlying point is that we need to supplement our tools with critical thinking to ensure we're not falling victim to their weaknesses.
Hi Evan.
One can account for priors (information besides the new evidence) to mitigate these issues, as suggested in Holden Karnofsky's post about not taking expected value estimates literally (when they do not incorporate priors; I think GiveWell does take expected value estimates close to literally when they incorporate the vast majority of available evidence).
You are correct that there are ways to mitigate these issues. However, that does not mean that the issues completely disappear or that the method is without weakness.
The fundamental problem remains. Like I mentioned in my original post, any system for decision making is going to be trading away truth for practicality.
A more refined method means that some weaknesses will be less pronounced, though they frequently introduce new types of errors (like the WFM example in my post). We still need to account for methodological bias into our final decision.
You cite GiveWell as an example of an organization that takes EV estimates "close to literally". I assume by this you mean the EV estimates they make with respect to cost-effectiveness. However, GiveWell outlines 5 things they keep in mind when considering cost-effectiveness here, including the following:
In other words, GiveWell seems to believe that cost-effectiveness is a useful tool, but it is not perfect. There are methodological biases with that method, so they acknowledge those limitations and incorporate other factors before making a final decision.
Agreed. At the same time, I struggle to see practical cases where it makes sense to spend significant time on WFMs. I would rather improve cost-effectiveness analyses (CEA). For example, accounting better for priors, modelling more effects, and gathering more evidence to decrease uncertainty in key inputs. GiveWell uses CEAs all the time, but has never included a WFM in their public analyses as far as I know. Gemini did not find any examples either.
Yes. Elie Hassenfeld, GiveWell's CEO, mentioned the following on the Clearer Thinking podcast.
Isabel Arjmand from GiveWell elaborated on the above.
I think that is a reasonable decision. I think WFMs are very useful for certain types of decisions, but not always. I use CEAs much more often. My claim is *not* that more people should be using WFMs. If anything, my post should be seen as a warning to those who do.
My claim is that people should take time to understand their tools and account for their weaknesses. Accounting for weaknesses should happen not just within the tool, but outside of it when making the final decision.
I think GiveWell is a good example of this. If CEAs made up 100% of their decision making process, their decisions would be heavily influenced by the weaknesses of CEAs as a method. However, GiveWell acknowledges these weaknesses and uses CEAs as a primary deciding factor, while also incorporating other factors as well.
Agreed.