Thanks for this post, it's super valuable to get a better sense of this ecosystem.
On the apparent lack of Chinese companies, I think this is a methodological thing; a few possible blind spots:
Most obviously, English-language, web-based search is probably going to miss some Chinese AI-aquaculture innovators that would otherwise meet the paper’s inclusion criteria. Using Chinese-language platforms might be necessary.
AI for aquaculture in China is often embedded within broader, more integrated "smart aquaculture” systems rather than marketed as standalone AI products. e.g. I'm not sure if Limap 励图高科 came up on your search, but it's a huge aquaculture and fisheries innovation company, deploying integrated aquaculture platforms across China, covering over 50 species etc. Some of their products and systems are explicitly AI-enabled & welfare relevant (e.g. computer-vision-based fish health and disease detection, visible in Chinese-language demos and videos), but they might have been excluded/missed because they're so broad.
China's innovation system is more state-led than elsewhere, and a lot of innovation happens through Universities, Agricultural Science and Technology Parks, local government programmes, "demonstration bases" 示范基地 etc. For example, China’s Ministry of Agriculture and Rural Affairs recently released a 主推技术 ("main promoted technology") notice, announcing that AI-enabled “smart aquaculture factory” technologies (including behaviour recognition, automated feeding, inspection robots, and large-model-based decision systems) are being supported through national programmes, implying a state-led deployment process. So you might be missing Chinese AI innovation in aquaculture that's not strictly commercial.
Executive summary: This report maps the current landscape of AI innovation in aquaculture, finding that commercially available AI tools are already widespread, concentrated in stock and growth management for high-value species like salmon and shrimp, and likely to become increasingly embedded in farm operations despite unclear implications for animal welfare.
Key points:
The authors identified 91 companies with AI-enabled aquaculture products that are already on the market and could affect farmed animal welfare.
Stock and growth management is the most common application of AI (59% of products), while feed and feed optimization is the least common (38%) despite feed comprising 50–70% of operating costs.
AI technologies target over 35 species, with shrimp and salmon as the most frequently targeted groups, and 76% of products applying exclusively to fishes.
Company headquarters are most commonly located in the US (16.8%), Norway (15.8%), and Singapore (9.5%), with China underrepresented in the sample despite its dominance in global aquaculture.
The focus on narrow AI reflects near-term relevance, with the authors setting aside AGI and emphasizing tools that farms can deploy today.
The report frames innovation as the first stage of technological change, with subsequent reports planned to analyze deployment patterns and welfare effects.
This comment was auto-generated by the EA Forum Team. Feel free to point out issues with this summary by replying to the comment, andcontact us if you have feedback.
The series evaluates the innovation, deployment, and animal welfare impacts of these technologies to help animal advocates and funders identify which developments should be endorsed and what actions should be taken to prevent increased animal suffering.
Will the series assess the cost-effectiveness of potentially promising interventions? There has been significant discussion about how AI will affect animals, but I do not recall any cost-effectiveness analyses.
Hi Vasco, thanks for your comment! A cost-effectiveness analysis of potentially promising interventions isn't in scope for this series on how AI is affecting farmed aquatic animals, but we're theoretically open to exploring it depending on what we find in the welfare impacts report.
AI Use Note: Main body text entirely human written. Claude (Opus 4.8) helped develop models of animal life histories in the appendix.
Cross-posted from Good Structures.
Executive Summary
* Animal advocates sometimes make claims like “there are X of this animal...
“How long have you been v*g*n?”
This is one of the most common icebreakers at animal protection events. It’s a baseline assumption, and it mostly holds true: if you’re out advocating for animals not to be tortured or abused, realistically these days you are v**n, or close. And it makes for good conversation. It seems fairly safe to assume when you meet strangers.
But this assumption is hurting the movement in a way which we don’t always notice: someone new comes into the sp...
Summary
Back in November 2023 I posted here to launch Spiro and raise our first $198k. Two and a half years later this is an update and a fundraiser for the next step.
The short version: we've now reached over-5,900 people with TB preventive medicine, including over 3,000 children under five years old. Our early results have held up well an...
Rethink Priorities’ How AI is affecting farmed aquatic animals is a three-part series that examines AI technologies being developed to address challenges in the aquaculture industry. As global aquaculture faces economic and technical constraints, this series examines whether and how the industry is turning to AI solutions to facilitate expansion. The series evaluates the innovation, deployment, and animal welfare impacts of these technologies to help animal advocates and funders identify which developments should be endorsed and what actions should be taken to prevent increased animal suffering.
Artificial intelligence (AI) introduces new capabilities to animal agriculture that could alter production methods, economic structures, and animal welfare outcomes. Responding strategically requires an understanding of how quickly such changes will unfold, whether they will benefit or harm animal welfare, and what interventions will remain relevant. In this three-part series, we take a close look at how AI will be used over the next five years in aquaculture, which collectively farms hundreds of billions of animals each year for food.
Part 1: Innovation
This report analyzes the current state of AI innovation in aquaculture, including the operational challenges faced by farmers, the functional problems that AI products are being developed to solve, the species currently targeted by new technologies, and the global R&D hubs leading AI innovation in aquaculture. The two reports that follow will address Deployment and Welfare Effects, respectively.
Key findings from part one of this series:
A time-boxed internet search uncovered 91 companies that have developed AI-enabled technologies for aquaculture applications with potential animal welfare impacts; all identified technologies are already on the market.
More than half of all companies developed technology for stock and growth management, making it the most popular use case in our sample.
Despite feed typically being farmers’ highest operating cost, management of feed and feed optimization was the least common application in our sample.
By a large margin, the top two species groups targeted by AI-aquaculture are shrimp and salmon, followed by trout and tilapia. Around half of AI products target fishes exclusively, while about one-fifth focus solely on shrimp.
Executive summary
This report analyzes the current state of AI innovation in aquaculture. Future reports in this series will provide insights into the rate of technology deployment and the implications for animal welfare.
Global aquaculture expansion faces multiple challenges, including high feed costs, sustainability concerns, disease outbreaks, and high mortality rates.
We expect AI-enabled products to become increasingly embedded in aquaculture operations, in particular to help solve current challenges.
We created a database of AI-aquaculture companies, categorizing the functions that their AI tools perform, where they are headquartered, and the species they target.[1]
We identified 91 companies with commercially available AI tools that could affect animal welfare in aquaculture.
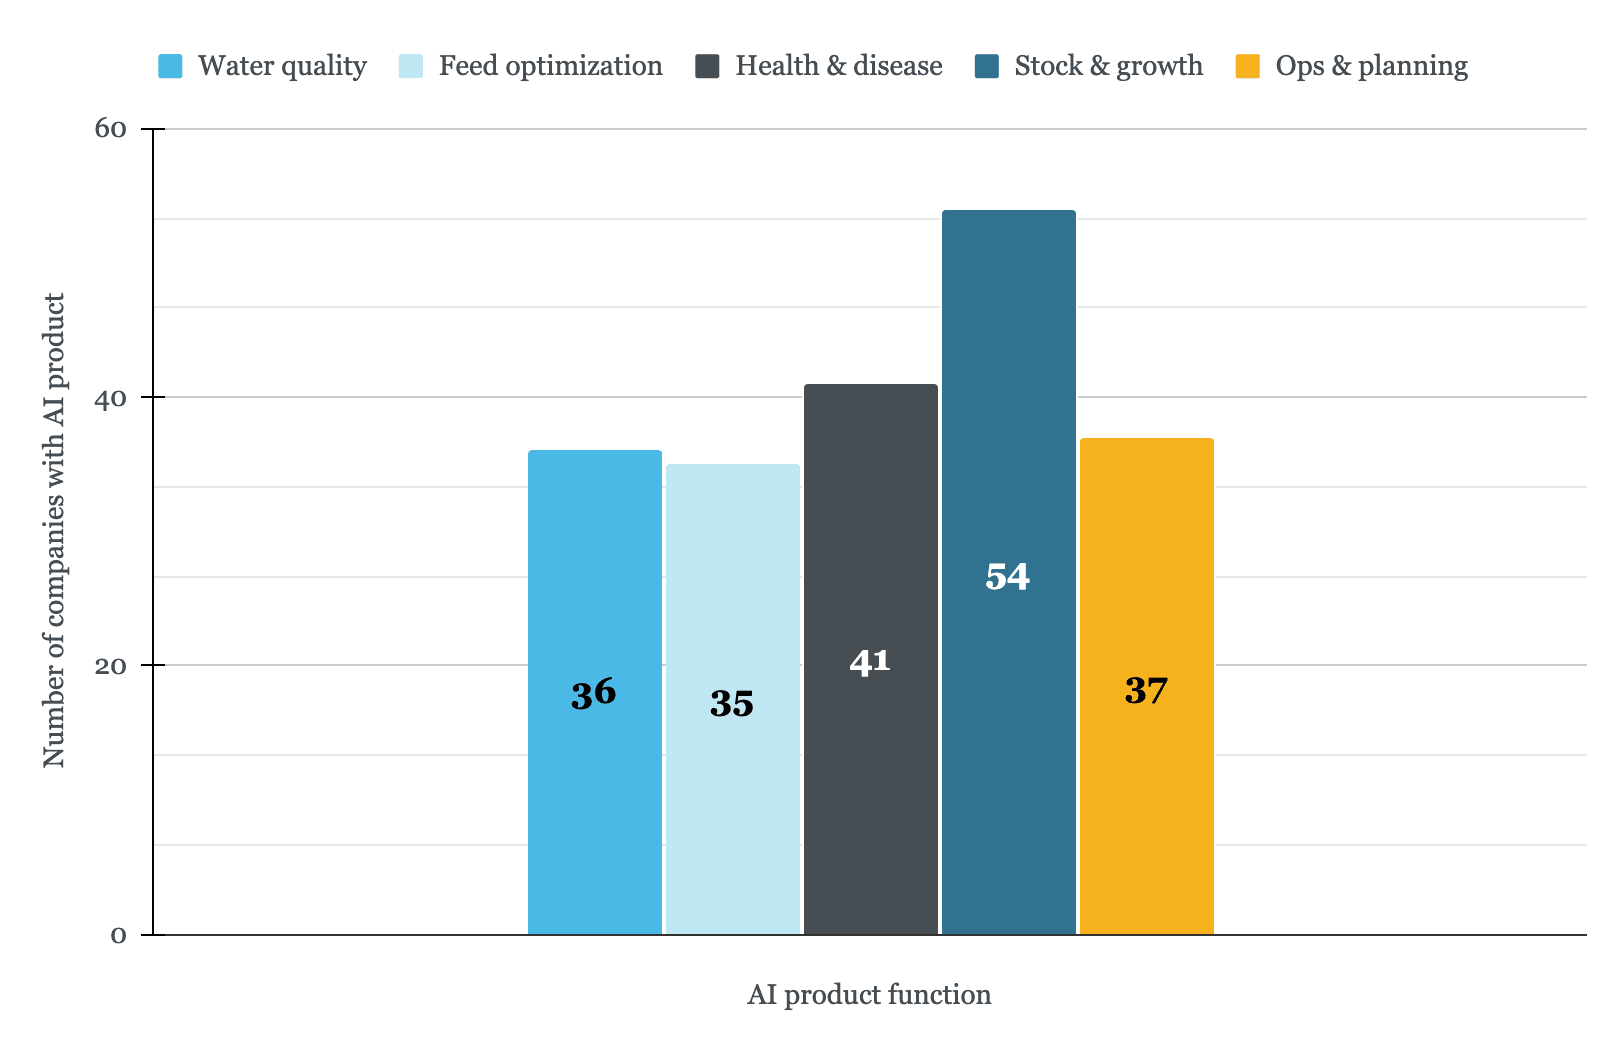
We categorized product function into five groups: water quality, feed and feed optimization, health and disease, stock and growth, and operations and planning.
The most common product function was stock and growth management.
Feed and feed optimization was the least common product function.
We found AI technology applications for more than 35 different species.
Shrimp and salmon (tied) are the top two species groups targeted, followed by trout and tilapia.
Around half of AI products target fishes exclusively, one-fifth focus solely on shrimp, and approximately a quarter of technologies apply to multiple species.
We found companies headquartered in 36 unique countries.
Companies are headquartered most commonly in the US (16.8%), Norway (15.8%), and Singapore (9.5%).
We found very few based in China (3.2%), despite China having the world’s largest aquaculture industry, potentially indicating bias in our search method, or that China is a region to expect rapid growth in AI tools for aquaculture. The low level of innovation in China does not necessarily mean low use of AI tools in aquaculture, as tools innovated elsewhere could be deployed on Chinese farms. We explore deployment in our next report in the series.
Background
Technological change is a multi-stage process
Artificial intelligence (AI) introduces new capabilities to animal agriculture that could alter production methods, economic structures, and animal welfare outcomes (e.g., see Dawkins, 2025 and Simoneau-Gilbert & Birch, 2024). To respond strategically, we must understand what functions AI tools will play, how quickly changes will unfold, and whether they will benefit or harm animal welfare.
Predicting adoption timelines requires knowing where AI technologies currently sit in the development pipeline. Technological change is a messy, iterative process. It can broadly be illustrated in three main stages. It starts with Invention—an idea about how to accomplish something that was previously either impossible or done in a suboptimal way. An early prototype may serve as a proof of concept, and a patent may set the stage for commercialization. Innovation is the process of developing the invention into a viable product. Deployment is the process of scaling up the implementation of the product.
For applications of AI in aquaculture, our best sources of information about inventions that have yet to reach the innovation stage would be academic databases, patent databases, government grants, and interviews with industry insiders about ongoing proprietary research and development. Because our present focus is on AI uses that may diffuse widely over just the next five years, this report focuses only on AI applications that are at least at the innovation stage.[2] In our next report, we will focus on Deployment. Our final report will investigate the potential animal welfare impacts of the innovation and deployment of AI tools in aquaculture.
Our analysis focuses exclusively on narrow AI tools—machine learning algorithms and computer vision systems designed for specific aquaculture tasks. These technologies exist today, and farms can deploy them now. We set aside Artificial General Intelligence (AGI) for now; we hope to explore how AGI and narrow AI would interact on farms in a future report.
To help make predictions about what AI technologies will affect farmed aquatic animals, we first look to the operational and economic challenges that likely drive innovation in aquaculture.
Challenges faced by the aquaculture industry
Aquaculture production has expanded rapidly to meet rising demand, surpassing capture fisheries for the first time in 2022 (FAO, 2024a, Figs. 3, 18, & 40). However, scaling up global aquaculture faces significant challenges.
The challenges faced in aquaculture vary considerably by region. Europe and North America operate highly industrialized, capital-intensive facilities under comprehensive regulatory frameworks, while labor-intensive, small-scale operations dominate Asian aquaculture, with more variable regulatory oversight (Bostock et al., 2010). In Latin America, Brazil, Chile, Colombia, Ecuador, and Mexico combined represent over 85–90 percent of total regional production (Wurmann et al., 2022, Table 7). Chile’s salmon industry and Ecuador’s shrimp sector operate large-scale, capital-intensive, vertically integrated facilities comparable to industrialized operations in Europe and North America, while freshwater aquaculture in Brazil, Mexico, and Colombia is predominantly small- to medium-scale and domestically focused, with over 80% of Brazilian farms smaller than two hectares (Valenti et al., 2021, p. 1). Below are short summaries of the key concerns felt by the industry and ways we think they could influence AI development for aquaculture:
Feed costs and sustainability
Feed accounts for 50–70% of operational costs (Rana et al., 2009, p. 12), and ranks as a top concern among aquaculture producers and farmers (Anderson et al., 2019), as does the quality of feed.
Fishmeal and fish oil (FMFO) are among the highest-priced feed ingredients due to their limited supply and price volatility.
Carnivorous aquaculture species consume over 80% of global FMFO production, raising sustainability concerns about aquaculture’s dependency on wild fish stocks (Glencross, 2023).
Due to the high costs and negative sustainability image, we expect farmers would be highly incentivized to deploy AI tools to improve feed efficiency (see Table 1 below for more detail).
Mortality rates and disease outbreaks
Disease is a major restricting factor for the growth of aquaculture, with disease mortality estimated to cost the industry $6 billion annually (Akazawa et al., 2014, p. 1).
Infectious diseases and injuries from delousing ranked as the 1st and 2nd top causes of mortality and poor welfare in Norwegian salmon farming, contributing to a 15.4% overall mortality rate in farmed salmon in Norway in 2024 (Moldal et al., 2025, p. 10 & 25). These challenges could incentivize farms to adopt AI technologies to better monitor lice infestations, disease, fish health, and reduce injury from handling.
In shrimp production, infectious viruses and bacteria have historically caused major falls in production (Shinn et al., 2018). Around 40% of shrimp may die from diseases (Benchmark Insights, 2019, p. 17).
Together, the high cost of mortality and any regulation around infectious diseases imply that preventing infections and mortality could be a large problem that AI in aquaculture may try to solve.
In other regions, labor availability and the costs of skilled labor are an increasing challenge (Iverson et al., 2020, Fig. 4; Ryba, 2025, Fig. 2).
AI tools could help automate a portion of the labor required in aquaculture facilities, addressing workforce shortages and cutting the costs of wages.
Due to the nature of farming animals underwater, monitoring growth, disease, and fish health is inherently difficult in aquaculture, and conventional methods require removing fish from water—a practice that is both manually demanding and distressing to animals. Computer vision systems could help monitor animals underwater without the need for labor-intensive manual checks that frequently stress animals. We expect that these challenges, among others, have created growing demand for AI-enabled technologies that tackle the industry’s major costs and operational obstacles.
Cost-breakdown examples in aquaculture
Table 1 shows five examples of the cost breakdown of intensive aquaculture across different species and regions, grouped under the labels of juvenile stocking, feed, labor, miscellaneous, depreciation of capital investments, and harvest.[4] Below each cost category is the estimated percentage of total operating costs attributed to that category for each example, according to the cited literature. Readers should note that the breakdown may look different depending on the intensity of the farm and the year in which costs were recorded.
Table 1: Table showing the approximate spend of an intensive aquaculture enterprise across six identified key cost categories. Miscellaneous costs can include utilities, fertilizer, administrative costs, interest, rent, and medicines. *Harvesting costs include packaging. **Harvesting costs include marketing.
Across all examples, feed purchase is consistently the most costly element of operating an aquaculture facility. Miscellaneous costs rank second in most cases, dominated by medicines, electricity, and fuel expenses. Note that the categories used above are not always strictly separable; for example, a large proportion of labor activity may go into dispensing feed, which helps explain why AI could address feed costs on multiple fronts—both through direct feed optimization and by reducing the labor time required for feeding.
Scope
To determine the landscape of AI innovation in aquaculture, we collected information on:
Companies with AI-enabled products for use in aquaculture
Where the company is headquartered
The AI-enabled product functions
The species targeted by the AI-enabled product(s)
Whether the product(s) could impact the welfare of the farmed animals
In the following section, we detail our definitions and categories used to collect data. Our method can be found in the Appendix.
Identification of AI technologies in aquaculture
To create our database of AI-enabled aquaculture technologies, we established a basic framework that the accepted technologies should adhere to. The products needed to (1) use AI, (2) for aquaculture, (3) have an impact on animal welfare, and (4) be available for use. We give our inclusion and exclusion criteria for these four components in Table 2.
Table 2: Technology classification criteria
Definition
A solution is included if…
A solution is excluded if…
(1) AI
The product description contains the phrases:
“AI,” “artificial intelligence,” “computer vision,” “machine learning,” or “deep learning”[6] on a company website or in direct quotes in an auxiliary material (e.g., article) by a company employee.
It does not explicitly reference AI or the accepted synonyms (e.g., computer vision, deep learning).
It is described using only vague terms (e.g., “predictive,” “analysis,” “precision,” “algorithm,” “model,” “smart,” “automatic,” “intelligent,” “IoT”).
The AI functionality is not yet operational (i.e., it is merely planned for future integration).
The product only interfaces with or enables other AI systems, but does not use AI itself.
(2) Aquaculture
Products are clearly applicable in the aquaculture context, with the description or website stating “aquaculture.”
The AI product targets an aquatic species. The analysis remains inclusive regarding the type of water used for farming and the aquatic “seafood” species (fish, crustaceans, bivalves) targeted by the AI product.
The technology is designed for wild-capture fisheries.
The technology is applied to post-slaughter processing.
The primary intent of the solution is conservation (rather than farm efficiency, productivity, or welfare).
It is a general farm management tool lacking documented aquaculture-specific use cases.
(3) Impacts welfare
They have the potential to impact farmed aquatic animal welfare, either through:
Direct intervention in farm conditions or animal handling, or
Decision support that provides farmers with information or recommendations that could influence welfare-relevant management decisions
Its use would not impact the experiences of the average aquatic animal, even if the technology uses AI and is applicable to aquaculture operations.
Examples of excluded technologies include:
Biodiversity monitoring of wild species in surrounding ecosystems
Financial compliance and accounting systems
Consumer demand forecasting and market analytics
Supply chain logistics and distribution optimization
Business management and administrative tools that do not track welfare-relevant parameters
(4) Availability
It is a viable product for market, evidently intended for commercialization.
Technologies must have progressed beyond the pure academic research and ideation phases into either pilot programs or deployment. We sought evidence of implementation, typically demonstrated by partnerships between the technology developers and aquaculture producers.
Consequently, solutions still primarily led by academic institutions for knowledge development were not included in the analysis.
The initiative is restricted to research or prototype phases and is not available at a commercial scale.
The product is offered by a non-operational or inactive company.
For further information on how we defined the producing company, AI-product function categories, the species targeted, and how we decided on whether a product could affect animal welfare, please see the Definitions section in the Appendix.
We have tried to flag major sources of uncertainty in the report and are open to revising our views as more information becomes available.
Results
We found 91 companies with technologies that have direct implications for farmed animal welfare. You can see the database here.
During our search, several technologies were excluded because their functions would not directly influence farmed animal welfare. We note, however, that while these tools are outside the scope of this report, they could influence the trajectory of the aquaculture sector by increasing farm efficiency (e.g., through optimizing and automating regulatory compliance and business operations). That said, the majority of AI-aquaculture companies encountered during our search developed tools that could directly impact aquatic animal welfare.
Stock and growth management leads, with other functions following closely
We found that AI products could broadly be grouped under five major themes. For each, we provide three representative examples below. For more information about the products, see the full database. Further details about how AI product functionalities were grouped under which categories can be seen in Box 2 of the Appendix.
Management of stock and growth
Biomass estimation – Computer vision analyzes camera footage to estimate total weight and population
Weight and size tracking – Machine learning processes images to measure individual dimensions and monitor growth
Automated sorting – Computer vision identifies biological markers to trigger automated sorting systems
Management of fish health and disease
Pathogen detection – AI identifies specific bacteria or pathogens in water or tissue samples for early disease intervention
Visual health assessment – Computer vision analyzes images to detect physical disease indicators, stress, or injury
Behavior monitoring – Machine learning analyzes swimming patterns to detect illness before visible symptoms appear
Management of operations and planning
Predictive analytics – Machine learning forecasts harvest timing and demand to optimize production planning
LLM chatbot assistants – Generative AI provides farm management guidance and answers technical questions
Net damage detection – Computer vision identifies damage requiring repair to maintain infrastructure
Management of water quality
Real-time parameter monitoring – AI processes sensor data for dissolved oxygen, pH, temperature, and salinity to maintain optimal conditions
Weather-based prediction – Machine learning uses weather forecasts to predict water quality changes before they occur
Plankton identification – Computer vision automatically identifies and counts plankton to detect algal blooms
Management of feed and feed optimization
Acoustic appetite detection – Machine learning analyzes underwater sounds to detect hunger and adjust feeding automatically
Real-time appetite detection – Machine learning analyzes fish behavior to determine feeding needs and make automatic feeding decisions
Feed conversion optimization – AI tracks and optimizes feed conversion ratios to maximize growth efficiency
Among the 91 AI-enabled company offerings, the most common product function was “management of stock and growth,” with over half (59%) of the tools in our database falling into this category (see Figure 1). Other product functions appear at relatively similar frequencies, with management of health and disease at 45% and operations and planning and water quality at 41% and 40%, respectively.[7]The least common function was “management of feed and feed optimization” at 38%.
Note that percentages do not sum to 100% because companies may produce multiple products, and/or individual products perform more than one function. Additionally, technologies have been classified by primary functions only, not by second-order effects—for example, less feed waste may consequently improve water quality, but a product targeting feed optimization would not be counted under water quality.
Figure 1: Distribution of AI technologies by product function. Note: technologies may target multiple issues and appear in more than one bar; as such, the total count does not represent the total number of technologies analyzed.
The results suggest that managing stock and growth, which includes tracking growth, automating sorting processes, and optimizing stocking densities, are the main ways AI developers are trying to innovate for aquaculture. Growth rate is a key metric for aquaculture producers, as faster-growing animals can shorten production cycles and increase feed efficiency, which in turn influences the profitability of a farm. Traditional monitoring is challenging, since aquaculture producers cannot easily assess the state of their animals below water. AI-enabled monitoring of stock and growth can provide farmers with real-time data and images that would otherwise be inaccessible. For example, counting technology can be used to precisely calculate feed amounts based on exact shrimp numbers and weight, reducing labor and time, reducing under- or overfeeding risks, and improving harvest forecasts (Waycott, 2024). Similarly, predictive models can be used to provide farmers with forecasts based on biomass change, expected quality, and price so that farmers can compare harvesting sooner versus later (The Fish Site, 2025).
Notably, feed management is the least frequently addressed application among AI products, despite feed being the dominant cost in most aquaculture operations. On the one hand, our results only show innovation, not deployment, so it could be that feed management AI tools are widely deployed, even if only a few exist.[8] On the other hand, this disconnect may reflect several factors: the high cost of feed may be inherent to its production and nutritional requirements rather than driven by inefficiencies that AI could address; existing non-AI solutions (e.g., non-AI-enabled automatic feeders) may already adequately address feeding efficiency, or farmers may be reluctant to entrust automated systems with decisions that could exacerbate their largest expense.
The headquarters of AI innovation are predominantly found in the US and Norway
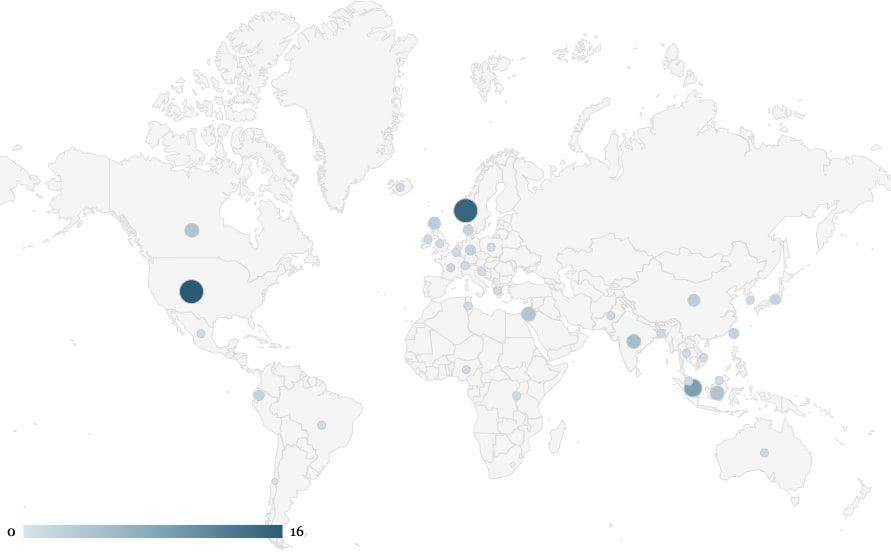
We tracked the location of various company headquarters to get a picture of where innovation is taking place and whether it is concentrated in certain regions. In our next report, we will look at deployment, i.e., where these innovations are being used in practice. Examining the correlation between product function and company headquarters, we found little discernible evidence that specific product functions were reliably innovated in specific regions, with two exceptions. First, North America shows a higher concentration of products targeting stock and growth (37%) compared to other product types innovated there or stock and growth products in other regions. Second, Scandinavia shows lower demand for water quality products (3%) compared to other product types in Scandinavia or across other regions. Since around 14 of the 17 companies we found headquartered in Scandinavia targeted salmon, we interpret the scarcity of water quality tools as potentially reflecting the region’s focus on marine net pen aquaculture production.
Figure 2 shows the density of company headquarters across the globe. Larger, darker circles represent more companies located in a country. We found that the US, Norway, and Singapore formed the top three most common headquarters locations, at 16.8%, 15.8%, and 9.5% of companies, respectively (followed by India, Indonesia, Israel, and Canada).[9] On a regional level (see the Appendix for definitions), we found the highest number of company headquarters in North America (20), Southeast Asia (17), and Scandinavia (17), and the fewest in Africa (3) and Oceania (1). We found 14 companies headquartered in Europe (excluding Scandinavia), 8 in East Asia, 7 in South Asia, and 4 in both the Middle East and South America.
Figure 2: Geographic distribution of AI technology developers in aquaculture by headquarters of the 91 technologies investigated (95 headquarters). Represents 36 unique countries.
Despite China leading global production in aquaculture by tonnage (56% in 2022) (FAO, 2024a, p. 209), we found that China is underrepresented in AI innovation according to our sample, with only three companies.[10] This underrepresentation could reflect genuine low deployment if Chinese aquaculture prioritizes domestically developed AI tools—a pattern observed in other sectors. However, without deployment data, we cannot assume company headquarters represent actual deployment locations. An alternative explanation is that our English-language search may have missed Chinese-language websites and companies. A review of the AI-aquaculture academic literature (Aung et al., 2024, Fig. 3)[11] found that a significant majority of papers were published in China, indicating that AI-aquaculture invention, at least, occurs in China. Overall, we cannot determine whether China truly has low levels of AI innovation or whether our methodology simply failed to capture existing activity.
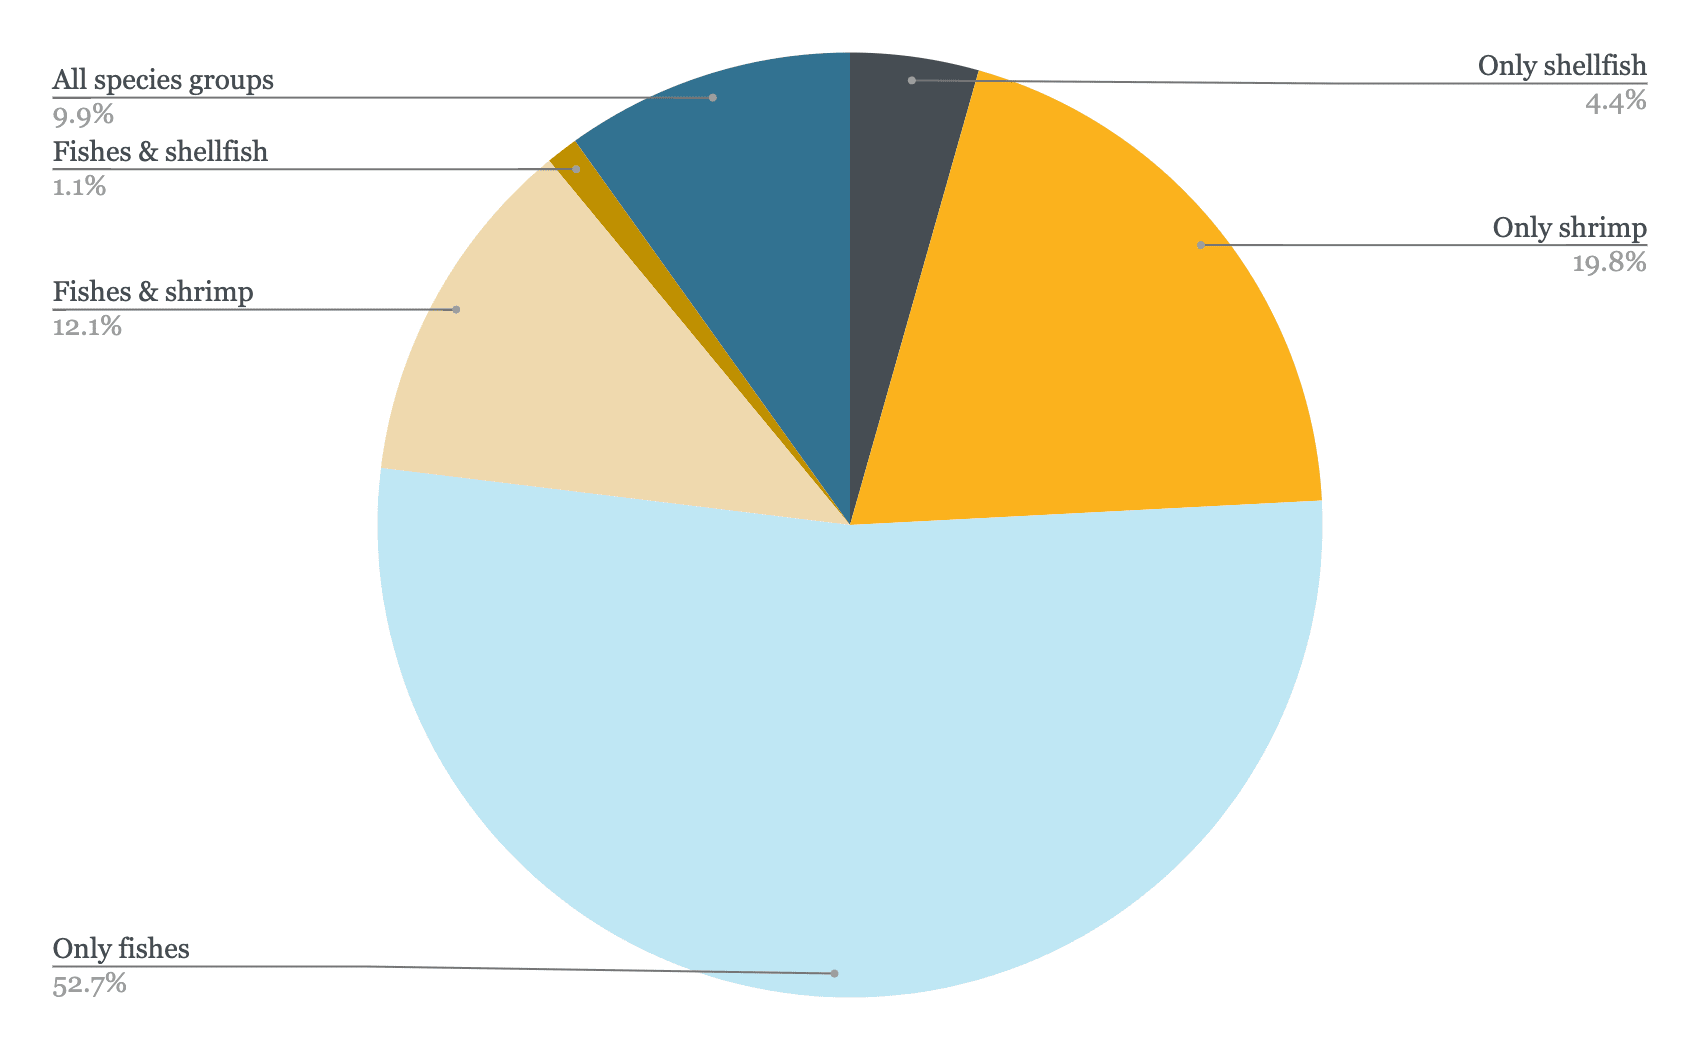
AI technologies predominantly apply to fishes
Figure 3: AI technology applications from 91 companies across fishes, shrimp, and shellfish.
Note. The figure shows the percentage of technologies applied to different combinations of species groups, e.g., an AI technology that has applications on salmon and trout would be counted in the “Only fishes” category and no other category; if it targeted salmon and crabs, it would be counted under “Fishes and shellfish”; if it targeted salmon, crabs, and shrimp, it would be counted under “All species groups.” All technologies are counted only once. Please note that the “Only shellfish” category covers all shellfish excluding shrimp.
AI technologies are currently predominantly targeting fishes (either specific species or “only fishes”), with 76%[12] of technologies falling into this category. This potentially reflects the influence of Norwegian aquaculture in our database, as Norway is both a major developer of AI technologies and the world’s largest producer of farmed salmon (Mood & Brooke, 2024). Of 15 Norwegian-produced technologies, 14 target fishes specifically, with only one dedicated to shellfish.
We found ~42%[13] technologies can be applied to shrimp, and only 15%[14] were applicable to other shellfish species, which included oysters, crayfish, crab, and lobster. Shellfish (excluding shrimp) are farmed in much smaller numbers than shrimp, making these species smaller target markets for AI innovators, which could explain this differentiation.
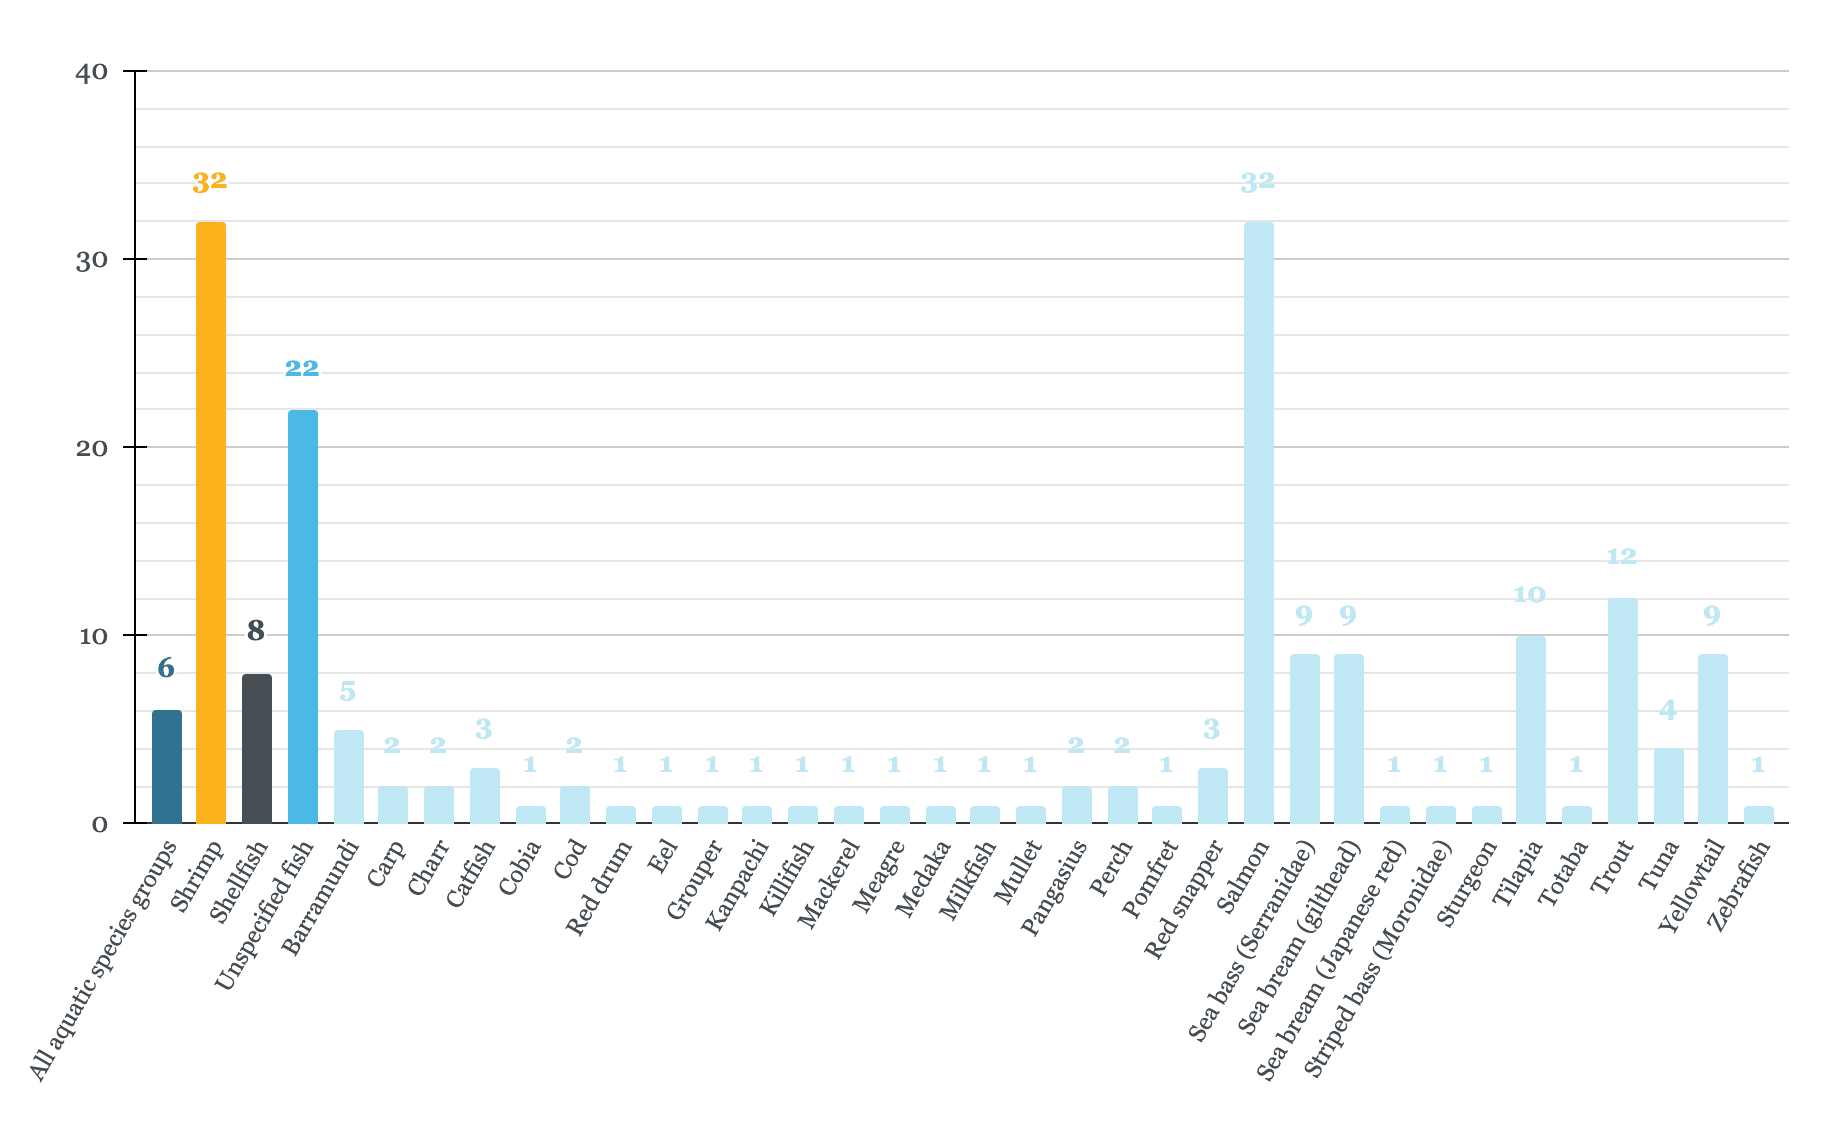
Figure 4: Frequency of species targeted by AI-enabled technologies produced by the 91 companies cataloged.
Note. The dark blue bar, “Unspecified fish,” counts instances where we have found technologies that are focused on fish, but the type of fish is not specified. The equivalent is true for “All aquatic species groups”: it is not a sum of all species groups listed, but rather technologies that are independent of species type or that state that they apply broadly to aquatic animals. Shellfish does not include shrimp.
We found evidence of AI technologies being applied to over 35 individual species, with shrimp and salmon jointly ranking as the most frequently targeted. The seven most commonly referenced species were:
Shrimp and salmon (tied)
Trout
Tilapia
Gilthead sea bream, yellowtail, and sea bass (tied)
Notably, despite carp species accounting for ~25% of global aquaculture production by tonnage (FAO, 2024b, p. 1), we identified only two technologies explicitly referencing work with carp. This disparity may reflect AI development in aquaculture prioritizing large-scale and more intensive production systems, species with higher profit margins, and sufficient capital for upfront investment. Some combination of high production volumes (representing a larger market) and higher profit per production unit is probably important to AI innovators when deciding which species their tools will target.
Conclusions
This first installment of the series How AI is Affecting Farmed Aquatic Animals analyzes the maturing AI aquaculture sector, identifying 91 companies that have commercialized technologies to address challenges faced by the industry. We found that innovation is concentrated primarily in the United States and Norway, and predominantly targets high-value species such as salmon and shrimp. Despite carp representing around a quarter of global aquaculture production by tonnage, we found minimal evidence of technologies targeting this species.
We found that technological innovation most commonly addressed stock and growth management (59% of products), and least commonly addressed feed management (38%), despite feed constituting 50–70% of operational expenses. We found a notable absence of AI development in China, suggesting either (or both) deficiencies in our search method or low levels of AI innovation there.
In our subsequent reports, we will analyze the development and deployment of these AI technologies, and finally, the impact of AI on the welfare of aquatic species.
Acknowledgements
This report is a project of Rethink Priorities (RP)—a think-and-do tank dedicated to informing decisions made by high-impact organizations and funders across various cause areas. Sophie Williamson made the database, did the research, and wrote the report. Hannah McKay managed the project and reviewed the research. William McAuliffe oversaw the project. Thanks to Shane Coburn for copyediting, to Thais Jacomassi for bibliography support, and to Urszula Zarosa for publishing the report online and assisting with dissemination. A special thanks to Isabella Logothetis and Natasha Boyland for sharing their research findings and to Natasha Boyland for feedback. This report was produced by Rethink Priorities between July and December 2025. The project was supported by a Movement Grant from Animal Charity Evaluators (ACE). The views expressed are those of the authors and do not necessarily reflect those of Animal Charity Evaluators. If you are interested in RP’s work, please visit our research database and subscribe to our newsletter.
Appendix
Method
Desk research
Using Google, Claude, and Google Gemini, we spent ~115 hours[15] searching for companies developing AI technologies in aquaculture. Other methods for finding companies included examining exhibitors at aquaculture-related conferences, identifying associated companies of those already found on Crunchbase, Traxcn, and Pitchbook, and reviewing articles on aquaculture trends and innovation. In addition to the criteria outlined in Table 2, we optionally added search terms such as “solutions,” “technology,” “company,” and any combination of country and continent name. It should be noted that no searches were made for technology with a specific function.
We continued searching for companies until the point that our search commands yielded no new results in ~1 hour of searching, or that all results were excluded under our criteria. We then prompted Claude to verify that the company/technology identified met our inclusion criteria and to provide source references. We next prompted Claude to identify the (1) company headquarters and (2) founding year—both according to Box 1, (3) AI-enabled products with description, (4) category of product function according to Box 2, (5) species targeted according to Box 3, and (6) whether the product could influence the welfare of the farmed animals, according to Box 4.
Based on the inclusion criteria outlined in Table 2, we found 91 entries (i.e., a product or multiple products that use AI and are produced by the same company).
Data checking
We sense-checked every entry, i.e., we spent ~20–30 minutes manually checking that the company was still in business, that the technology met our definition of using AI, that the technology had applications in aquaculture, and that references supplied by Claude for target species, available products, and their functions were correct. Furthermore, we carried out sense-checks to verify whether a function listed on the website (e.g., disease reduction) was the primary function of the technology, or a side effect of the primary function (e.g., monitoring stocking density). Where a product had multiple functions, we further double-checked which functions appeared to use AI and which did not (the latter were not included in the database).
We are grateful to Isabella Logothetis and Natasha Boyland at The Jeremy Coller Centre for Animal Sentience (London School of Economics), who shared their own database of AI aquaculture companies under preparation. We cross-checked our findings with their database and added missing companies that fit our own criteria. In addition, 15% of our identified technologies went through thorough peer checking.
Definitions
Attributing companies and recording headquarters and founding dates
For the AI technologies deemed admissible, we logged the company producing it, the founding date, and the location of the company’s headquarters.
Box 1: Criteria used to identify the company developing the AI technology
For ~90% of technologies, identification of the company developing the AI product was straightforward. For more nuanced cases, we followed the conventions below:
Where collaborations were made between multiple companies in different countries to produce AI tech for aquaculture, we noted that each company’s headquarters used the collaboration date as the founding date.
Where collaborations have been made between multiple companies in the same country to produce AI tech for aquaculture, we used the country with all company headquarters as the headquarters, and the collaboration date as the founding date.
Where a company lists multiple headquarters, they are all given in the database.
Where companies rebranded without acquisition or collaboration, the founding date and headquarters of the originally established company are used.
For AI-aquaculture companies that had been acquired since their founding, we assigned the parent company’s headquarters.
If the parent company had not formerly produced AI-aquaculture solutions, we assigned the date of founding as the acquisition date.
If the parent company had previously produced AI-aquaculture products, we used the founding date of the parent company.
Product functions of AI technologies
We found AI solutions being developed to target multiple areas of aquaculture and grouped them under five high-level categories:
Box 2: Categories used for assigning product functions to AI technologies
Management of water quality
Real-time monitoring of chemical (e.g., pH, ammonia, nitrates), physical (e.g., temperature, turbidity, dissolved oxygen), and biological (e.g., bacteria, algae, pathogens) water parameters, predictive water quality modeling, automated treatment systems, circulation optimization.
When a company’s solution spanned multiple categories, only those categories where AI was implemented were included in the analysis. Product functions represent the AI-enabled capabilities across all products from a single company—if a company produces two AI products, one for stock and growth management and the other for water quality, then both product functions were recorded under the same company entry and constituted only one entry to the database.
In addition to these categories, we found four AI applications for onshore slaughter.[16] However, considering the low number (an order of magnitude lower than other product functions), we omitted technologies with this product function alone in the analysis presented below.
Classification of species targeted
We collected species information under the groupings
All aquatic species groups
Shrimp
Shellfish (excluding shrimp)
Unspecified fishes
Fish species, if applicable
The determination of species targeted is defined in Box 3.
Box 3: Framework for deducing the species types targeted by an AI technology
We collected target species where specific species were referenced in product details and/or on company websites, or where applications/partnerships for a specific species type were found in other online resources.
Where no partnerships were found, and no specific language was used (only e.g., “fish farmers,” “aquatic life”), the general category was selected (in this example, “all fishes” or “all aquatic species groups,” respectively).
We only include species that companies currently target, excluding planned expansions that may not materialize.
We classified target species according to common species names, as this was generally what companies used on their websites. We added species categories as we found products targeting them—if a species is not present in the database, it is because we did not find any products explicitly targeting it.
Note that for salmon farming, many companies simply referenced “salmon” as the target species, without differentiating between Pacific and Atlantic types. As such, salmon refers to both Pacific and Atlantic salmon (Salmo salar and Oncorhynchus kisutch); related Family members such as char and trout are listed separately. We collected all shrimp and prawn species under the category “shrimp,” as many companies did not detail specific species.
Criteria for impacting farmed animal welfare
Box 4: Framework for deciding whether an AI technology could impact farmed animal welfare
Technologies that could impact farmed animal welfare refer to AI technology that actively changes the farming environment, directly observes conditions within it, and/or provides insights on how to modify it.
This includes systems that track water quality, monitor animal behavior, detect environmental threats, or automatically control conditions like feeding or aeration within the farming environment.
This does not include AI systems that address variables outside the immediate farming environment, such as supply chain management, market demand prediction, biodiversity monitoring, or regulatory compliance.
Ways in which we could be wrong
How our database could be incomplete or inaccurate
The lists below are non-exhaustive.
Search method to find products and companies:
Due to the location of the researchers in Western Europe and searching for products using English, we accept that search results may well be geographically biased.
While we believe there will still be some linguistic bias, Claude and Gemini returned results in multiple languages, which we then translated.
In order to account for any geographical bias, we occasionally added specific countries to our search terms to try to pick up technologies and companies located elsewhere.
Furthermore, we accept there will likely be a restriction on certain technologies we can identify through desk research alone, due to firewalls and/or lack of company online presence.
We also appreciate the possibility that product descriptions include AI-related buzzwords used purely for marketing purposes. However, without authority to discern the truthfulness behind such claims, all technologies passing or inclusion criteria were admitted to the database.
Logging of species targeted:
Species lists found in company materials or third-party sources may be illustrative rather than exhaustive.
For example, if the text states “we work with aquaculture species such as pangasius and barramundi,” the database records pangasius and barramundi, though the company may serve additional species, or not in fact work with the species mentioned.
Where companies produce multiple technologies and AI technologies, it may not be clear which species are the focus of which technology/AI technology, so a best guess was taken.
While best efforts have been made to make sure the species listed as targeted are current targets, they may instead be intended targets of the AI technologies.
If a company produces multiple AI technologies that each target different species, our data does not capture this detail. For example, if a company has one technology for monitoring water quality in salmon farms and another for optimizing feed in shrimp farms, our database logs both product functions (water quality and feed) and both species (salmon and shrimp), but does not link specific functions to specific species.
Logging product function:
For products with multiple functions, the database may not accurately reflect which specific functions employ AI, potentially attributing AI capabilities to more or fewer functions than the company actually uses.
South East Asia: Singapore, Indonesia, Vietnam, Brunei, Malaysia, Thailand
Bibliography
Akazawa, Noriaki, Adolfo Alvial, Ana Paula Baloi, Philip-Pierre Blanc, Randall E. Brummett, Jose M. Burgos, George C. Chamberlain, George W. Chamberlain, John Forster, Nguyen Van Hao, Rolando Ibarra, Luc Josue, Frederick Kibenge, Khoa Van Le, Donald V. Lightner, Tran Huu Loc, Hamisi L. Nikuli, Isabel Omar, Ralaimarindaza, & Peter M. Van Wyk. (2014). Reducing disease risk in aquaculture. World Bank Group. https://documents.worldbank.org/en/publication/documents-reports/documentdetail/110681468054563438
Almeida, M. S. de, Régio Marcio Toesca Gimenes, Plínio Schmidt Furtado, Luís Henrique Poersch, Wilson Wasielesky Júnior, Geraldo Kipper Fóes, & Juliana Rosa Carrijo-Mauad. (2022). Economic analysis of intensive and super-intensive Litopenaeus vannamei shrimp production in a Biofloc Technology system. Instituto de Pesca. https://doi.org/10.20950/1678-2305/bip.2022.48.e692
Anderson, J. L., Diego Valderrama, & Darryl E. Jory. (2019). GOAL 2019: Global shrimp production review. Global Seafood Alliance. https://www.globalseafood.org/advocate/goal-2019-global-shrimp-production-review/
Aung, T., Rafiza Abdul Razak, & Adibi Rahiman Bin Md Nor. (2024). Artificial intelligence methods used in various aquaculture applications: A systematic literature review. Journal of World Aquaculture Society, 56(1). https://doi.org/10.1111/jwas.13107
Benchmark Insights. (2019). Technologies shaping the future of shrimp production. Benchmark Insights. https://wp-benchmarkplc-2022.s3.eu-west-2.amazonaws.com/media/2021/10/Thought-Leadership-Magazine_Shrimp-Edition_Web.pdf
Bostock, J., Brendan McAndrew, Randolph Richards, Kim Jauncey, Trevor Telfer, Kai Lorenzen, David Little, Lindsay Ross, Neil Handisyde, Iain Gatward, & Richard Corner. (2010). Aquaculture: Global status and trends. PMC PubMed Central. https://pmc.ncbi.nlm.nih.gov/articles/PMC2935128/
Dainichi Corporation. (2022). #03 Establishment of an aquaculture model via the use of an AI feeding machine. https://www.dainichi-ff.co.jp/en/sdgs/sdgs-3/
Dawkins, M. S. (2025). Smart farming and Artificial Intelligence (AI): How can we ensure that animal welfare is a priority? Applied Animal Behaviour Science, 283. https://doi.org/10.1016/j.applanim.2025.106519
FAO. (2024a). Proceedings of the Sixth International Carp Conference – Szarvas, Hungary, 31 August–1 September 2023. https://doi.org/10.4060/cd1566en
FAO. (2024b). The State of World Fisheries and Aquaculture 2024 – Blue Transformation in action. https://openknowledge.fao.org/items/8ab20ccf-1e9d-4ae6-836c-ca770d16da01
Glencross, B. (2023). Sustainability of Marine Ingredients and the Way Forward. IFFO. https://www.iffo.com/sustainability-marine-ingredients-and-way-forward
Hung, L. T. & Ong Moc Quy. (2013). On-farm feeding and feed management in whiteleg shrimp (Litopenaeus vannamei) farming in Viet Nam. FAO. https://www.fao.org/fishery/docs/CDrom/T583/root/12.pdf
Iversen, A., Frank Asche, Øystein Hermansen, & Ragnar Nystøyl. (2020). Production cost and competitiveness in major salmon farming countries 2003–2018. Aquaculture, 522. https://doi.org/10.1016/j.aquaculture.2020.735089
McKay, H. D. & William McAuliffe. (2024). Pre-slaughter mortality of farmed shrimp. OSF. https://doi.org/10.17605/OSF.IO/W7MUZ
Moldal, T., Jannicke Wiik-Nielsen, Victor Henrique Silva de Oliveira, Julie Christine Svendsen, Asle Haukaas, & Ingunn Sommerset. (2025). Norwegian Fish Health Report. Norwegian Veterinary Institute. https://www.vetinst.no/rapporter-og-publikasjoner/rapporter/2025/norwegian-fish-health-report-2024/_/attachment/inline/6b11b72c-ee8f-4529-921f-1a3d85dc419e:2d59843d7c1e34e9200669ae47f2974d8ee51b6a/Fish%20Health%20Report%202024.pdf
Mood, A. & Phil Brooke. (2024). Estimated farmed finfish numbers. Fish Count. https://fishcount.org.uk/estimates/farmedfishes/data01/fishcount_global_farmed_fish_estimate.php?selyear=2022&selcountry=&selspecies=Atlantic%20salmon&selsort=
Rana, K. J., Sunil Siriwardena, & Mohammad R. Hasan. (2009). Impact of rising feed ingredient prices on aquafeeds and aquaculture production. FAO. https://www.fao.org/4/i1143e/i1143e.pdf
Ryba, R. (2025). The economics of fish farming and fish welfare in Europe. Animal Ask. https://www.animalask.org/post/the-economics-of-fish-farming-and-fish-welfare-in-europe
Shinn, A. P., J. Pratoomyot, D. Griffiths, T.Q. Trong, N.T. Vu, P. Jiravanichpaisal, & M. Briggs. (2018). Asian Shrimp Production and the Economic Costs of Disease. Asian Fisheries Society. http://doi.org/10.33997/j.afs.2018.31.S1.003
Siar, S. V. & K. Kusakabe. (2020). Demographic change in Asian fishing communities – Drivers, outcomes and potential impacts. FAO. https://openknowledge.fao.org/items/96741aff-1c2e-4a01-8df1-4d0e242f16ae
Simoneau-Gilbert, V. & Jonathan Birch. (2024). The dangers of AI farming. Aeon. https://aeon.co/essays/how-to-reduce-the-ethical-dangers-of-ai-assisted-farming
Tamm, E. E. (2021). Tracking AI’s explosive growth in aquaculture. This Fish. https://this.fish/blog/ai-guide-tracking-ais-explosive-growth-in-aquaculture/
The Fish Farmer. (2024). Our Mission. https://thefishfarmer.com/about/
The Fish Site. (2025). Manolin unveils AI harvest forecasting and sea lice treatment tools. https://thefishsite.com/articles/manolin-unveils-ai-harvest-forecasting-and-sea-lice-treatment-tools
Wagner C. Valenti, Helenice P. Barros, Patricia Moraes-Valenti, Guilherme W. Bueno, & Ronaldo O. Cavalli. (2021). Aquaculture in Brazil: Past, present and future. Aquaculture Reports, 19. https://doi.org/10.1016/j.aqrep.2021.100611
Waycott, B. (2024). Can AI transform how shrimp farms count their stock? Global Seafood Alliance. https://www.globalseafood.org/advocate/can-ai-transform-how-shrimp-farms-count-their-stock/
Welfare Footprint Institute. (2022). Welfare of Farmed Fish. https://welfarefootprint.org/welfare-of-farmed-fish/
Wurmann, C., D. Soto, & R. Norambuena. (2022). Regional review on status and trends in aquaculture development in Latin America and the Caribbean – 2020. FAO. https://openknowledge.fao.org/items/88819b7c-cdba-43e7-a5c9-a5116834bc72
Young, B. C., Shinn-Pyng Yeh, Winton Cheng, Pai-Po Lee, & Rebecca Hui-Wen Chung. (2015). The status of aquaculture operations and cost analysis in Hondurans tilapia industry. Global Journal of Fisheries and Aquaculture. https://www.globalscienceresearchjournals.org/articles/the-status-of-aquaculture-operations-and-cost-analysis-in-hondurans-tilapia-industry.pdf
This figure excludes deaths during transport, culling, broodstock and larval stages, as well as mortality among cleaner fish and wild fish affected by farm diseases and residues.
Depreciation represents the annual cost of wear and tear on farm assets such as cages, tanks, pumps, and other equipment. This accounting measure spreads the initial purchase cost across the asset’s expected lifespan.
These figures are inline with those reported in (Tamm, 2021), with the exception of applications concerning health and disease, where we find significantly more applications.
We note that our results could be geographically biased since we searched for products while being located in western Europe and used only English. See Appendix for more details on ways in which we could be wrong.
Ace Aquatec (included in the analysis under other product functions), Optimar, Shinkei Systems, and a collaboration between SINTEF, SeaSide AS, and Slakteriet AS.

 Note. The dark blue bar, “Unspecified fish,” counts instances where we have found technologies that are focused on fish, but the type of fish is not specified. The equivalent is true for “All aquatic species groups”: it is not a sum of all species groups listed, but rather technologies that are independent of species type or that state that they apply broadly to aquatic animals. Shellfish does not include shrimp.
Thanks for this post, it's super valuable to get a better sense of this ecosystem.
On the apparent lack of Chinese companies, I think this is a methodological thing; a few possible blind spots: