Author: Stijn Bruers, researcher economics KU Leuven
Short summary
According to a survey among a representative sample of the Belgian population, most people believe that farmed animals like chickens have the same capacity for suffering as humans, and that most farmed land animals (broiler chickens) have negative welfare levels (i.e. experience more suffering than happiness). The average suffering of a farmed land animal, estimated by people, is equal in size to the positive welfare of an average human (in Belgium) whereas the welfare level of a wild bird is zero on average. Given the fact that there are more farmed animals than humans in the world, and that the populations of small farmed animals (chickens, fish, shrimp and insects) are increasing, most people would have to come to the conclusion that net global welfare (of humans, farmed animals and wild animals combined) is negative and declining. People who care about global welfare should therefore strongly prioritize decreasing animal farming and improving farmed animal welfare conditions.
Introduction
How much do farmed animals such as broiler chickens suffer? How can we compare the welfare of animals and humans? These are crucially important questions, because knowing the welfare capacities and welfare levels of humans and non-human animals is necessary to prioritize strategies to improve welfare on Earth. They can also be used to estimate the global welfare state of the world, as was first done by Fish (2023). His results were very pessimistic: net global welfare may be negative and declining, due to the increased farming of small animals (chicken, fish, shrimp and possibly insects). The top-priority to improve global welfare and decrease suffering on Earth becomes very clear: decrease animal farming (or decrease the suffering of farmed animals).
Fish arrived at these pessimistic results using welfare range and welfare level estimates by animal welfare experts at Rethink Priorities (the Moral Weight Project) and Charity Entrepreneurship (the Weighted Animal Welfare Index). However, the calculations by Fish may be criticized on the point that his choice of welfare ranges and welfare levels was too arbitrary, because it first involved the arbitrary choice of source or group of experts, and those experts themselves also made arbitrary choices to arrive at their welfare range and level estimates. Perhaps people believe that the welfare capacities and levels of animal suffering used by Fish were overestimated? Perhaps people won’t believe his results because they don’t believe that animals have such high capacities for suffering?
In order to convince the general public, we can instead consider the estimates of welfare ranges and welfare levels of animals given by the wider public. To do so, a survey among a representative sample of the Flemish population in Belgium was conducted to study how much sentience people ascribe to non-human animals. The estimates of animal welfare ranges by the general public were more animal-positive than those of Rethink Priorities. Most respondents gave higher values of animal welfare ranges than those given by the animal welfare experts at Rethink Priorities. According to the general public, Rethink Priorities may have underestimated the animal welfare ranges. Furthermore, most people estimate that the welfare level of most farmed land animals (chickens) is negative, and in absolute value as large as the positive welfare level of humans (in line with the Animal Welfare Index estimates by Charity Entrepreneurship). Hence, according to the general public, the results of Fish were too optimistic. The global welfare state may be even more dire: more negative and more declining than estimated by Fish.
Methodology
Welfare estimation
The interpersonally comparable, momentaneous welfare of a sentient being is the product of the welfare range and the welfare index or relative welfare level. The lifetime welfare is the momentaneous welfare integrated over the full lifespan of the sentient being.
The welfare range of an animal is the maximally possible intensity of an animals' pleasures (happiness) and pains (suffering) relative to humans' pleasures and pains, whereas the welfare index is the actual welfare level of an individual relative to the maximally possible welfare level obtainable by that individual. For non-human animals, the welfare range is usually between 0 and 1, which means that those animals have a capacity of suffering and happiness that is smaller or equal to the capacity of humans. A welfare range of 0 means the animal cannot have valenced experiences. A welfare range of 1 means the animal has the same welfare capacity as humans. The welfare index can take a value between minus 10 (the worst suffering one can experience) to plus 10 (the highest happiness one can experience).
Survey distribution
An online survey was distributed in May 2024 by a market research company among a panel of Flemish speaking Belgian adults (age above 18 years). The survey ran until at least 100 completed and quality-checked questionnaires were obtained. The quality check involved an easy to answer multiple choice test question at the end of the survey. Quota for gender and age were set to obtain a representative sample of the Flemish population according to gender and age (i.e. 50% male respondents and 50% respondents between age 18 and 50 years). The language was Dutch, the average completion time was 5 minutes. In the introduction, the participants were informed that their data will be processed anonymously.
Survey design
The survey title and introduction didn’t mention objectives of the survey, except that it is about animal welfare.
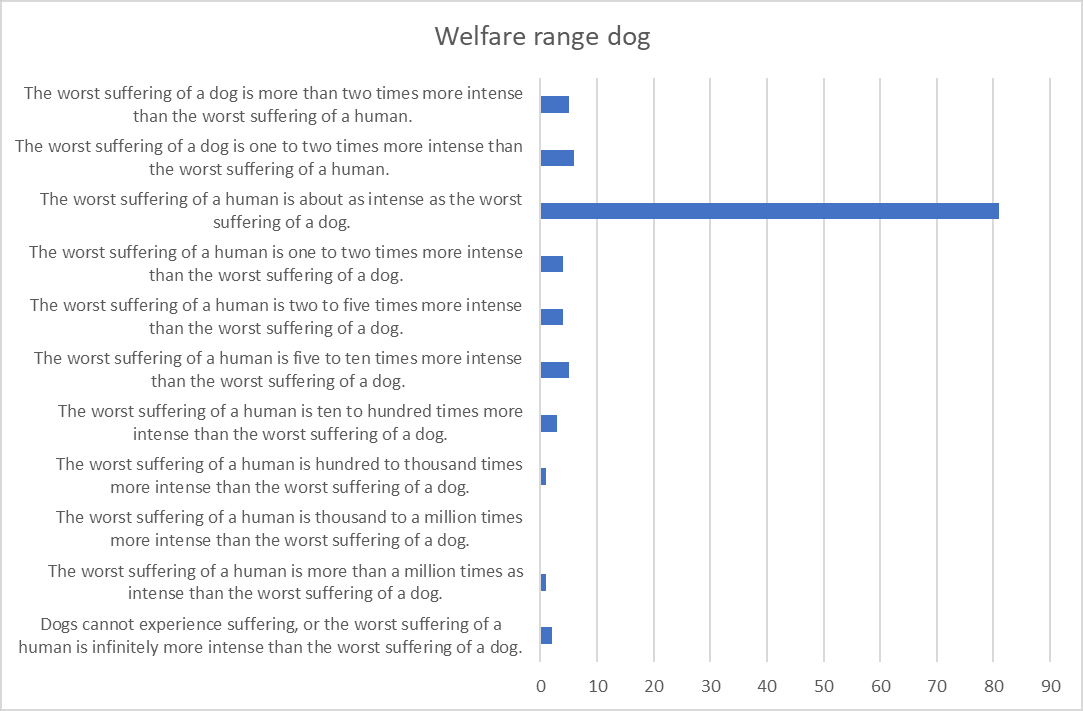
The first set of ten questions are intended to measure the animal welfare ranges. This block was introduced by the text: “The following questions are about the capacity of different animals (a dog, bird, fish, shrimp and fly) to experience suffering. In your opinion, roughly speaking, how strong is an animal's capacity to experience suffering, compared to that of an average human?” These five animals were chosen because either people are most familiar with them (dogs) or they are the most common farmed animals (chickens, fish, shrimp and insects). To avoid mind denial bias due to cognitive dissonance of meat eaters, the word ‘bird’ instead of ‘chicken’ was used.
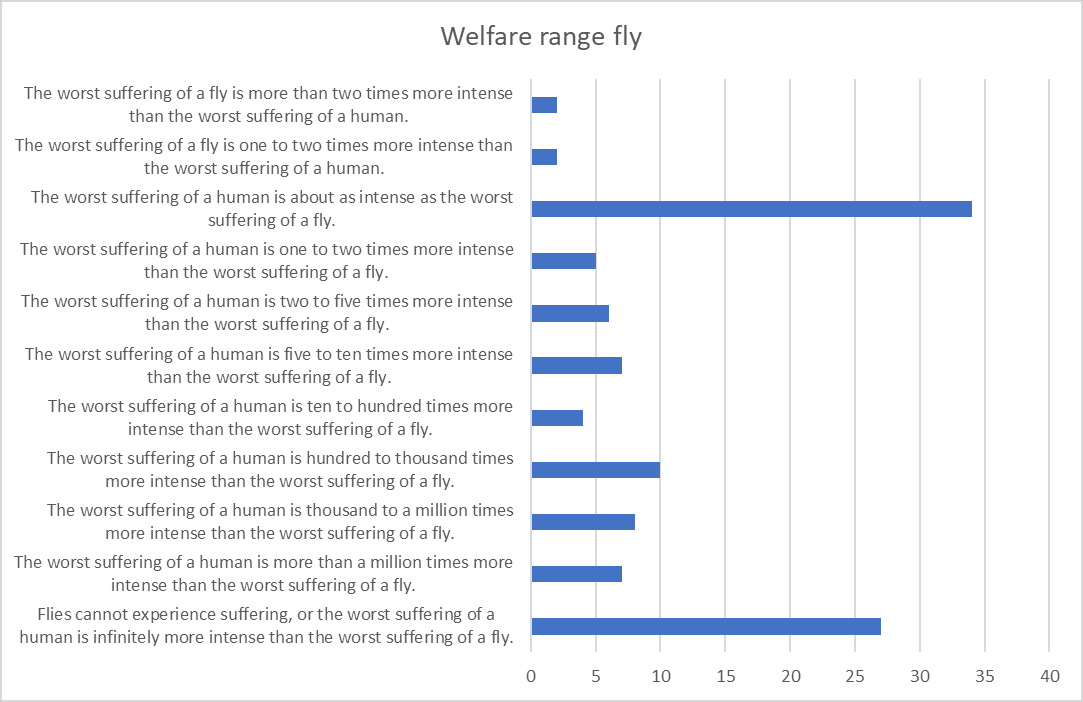
For each of the five animals, the welfare range question was: "Imagine the worst suffering a [dog, bird, fish (for example a salmon), shrimp, fly] can experience. Try to compare this suffering with the worst suffering a human can experience. How intense or severe do you think is the worst suffering of a [dog, bird, fish, shrimp, fly] for an hour compared to the worst suffering of a human for an hour?” The 11 answer options of these multiple choice questions were presented as intervals of welfare ranges:
o [Dogs, Birds, Fish, Shrimps, Flies] cannot experience suffering, or the worst suffering of a human is infinitely more intense than the worst suffering of a [dog, bird, fish, shrimp, fly].
o The worst suffering of a human is more than a million times greater than the worst suffering of a [dog, bird, fish, shrimp, fly].
o The worst suffering of a human is a thousand to a million times greater than the worst suffering of a [dog, bird, fish, shrimp, fly].
o The worst suffering of a human is a hundred to a thousand times greater than the worst suffering of a [dog, bird, fish, shrimp, fly].
o The worst suffering of a human is ten to a hundred times greater than the worst suffering of a [dog, bird, fish, shrimp, fly].
o The worst suffering of a human is five to ten times greater than the worst suffering of a [dog, bird, fish, shrimp, fly].
o The worst suffering of a human is two to five times greater than the worst suffering of a [dog, bird, fish, shrimp, fly].
o The worst suffering of a human is one to two times greater than the worst suffering of a [dog, bird, fish, shrimp, fly].
o The worst suffering of a human is about as intense as the worst suffering of a [dog, bird, fish, shrimp, fly].
o The worst suffering of a [dog, bird, fish, shrimp, fly] is one to two times greater than the worst suffering of a human.
o The worst suffering of a [dog, bird, fish, shrimp, fly] is more than twice as intense as the worst suffering of a human.
To avoid order effects, respondents were randomly given one of two versions of the survey. In one version, all answer options of the welfare range questions were in ascending order of severity, in the other version the answer options were in descending order. Each of the five welfare range questions was followed by a confidence level question, with a slider on a scale from 0 to 100: “How confident are you in your answer? (100 means 100% certainty, as if you would bet everything on it. 0 means you don't know at all.)” The order of the five animals was not randomized: respondents always first answered to question about the dog. The motivation to put the dog first is that people are most familiar with dogs, so the dog serves as a reference or “anchor” type of animal.
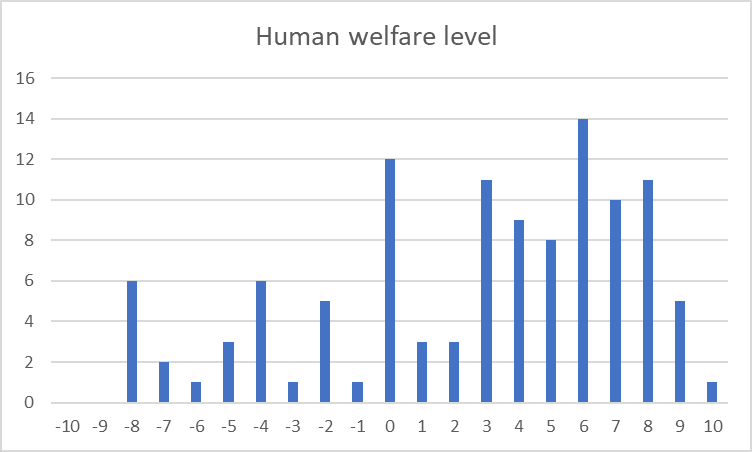
The second set of five questions are intended to measure the welfare index or relative welfare level, i.e. the individual welfare of a human or animal relative to the highest and lowest welfare the individual could possibly experience. The first question asks about the respondents own welfare: “Think back to your own life over the past month. What was your well-being (on average over that month) on a scale from minus 10 (the worst suffering you can experience) to plus 10 (the highest happiness or well-being you can experience). A value of 0 corresponds to a neutral month, for example a life without positive and negative experiences or with equally strong positive and negative experiences.” Respondents could choose their answer with a slider on a scale from minus 10 to 10.
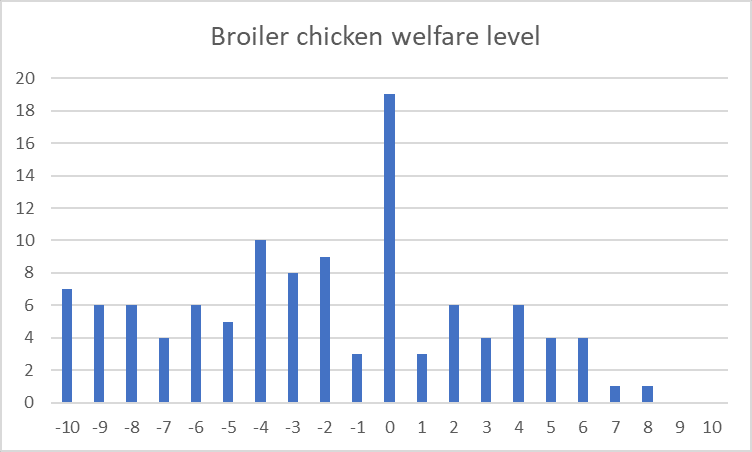
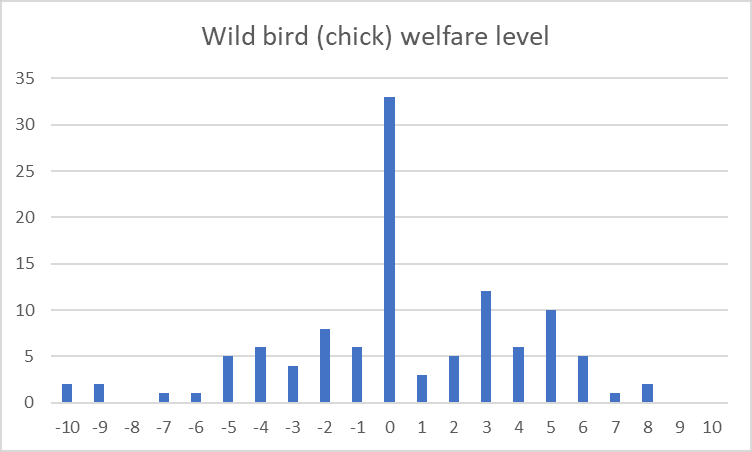
This question was followed by similar questions about two animals: a broiler chicken and a chick in nature that dies prematurely. These animals were chosen because they are both birds (which means they have the same welfare range), they have short lives and they are most common: most farmed land animals are broiler chickens and most wild animals die prematurely. The two questions were phrased as: “Think of any [meat chicken in the most common poultry farming in Flanders, bird in nature that dies prematurely as a chick]. How high do you think the well-being of that [chicken, chick] is (averaged over its life) on a scale from minus 10 (the worst suffering a [chicken, chick] can experience) to plus 10 (the highest happiness or well-being a [chicken, chick] can experience)? A value of 0 corresponds to a neutral life, for example a life without positive and negative experiences or with equally strong positive and negative experiences.” Each of these questions was directly followed by a confidence level question, just as in the first part of the survey.
The survey concludes with demographic questions (age, gender, education level), how actively involved the respondent is in animal welfare or animal rights, and whether the survey affects the respondent’s future meat consumption (i.e. whether it makes the respondent want to eat more, the same amount or less meat).
Data analysis
A confidence-weighted median is the preferred measure of the welfare range. There are three reasons in favor of the median above the arithmetic mean for the welfare range.
First, the median is not sensitive to extreme outliers. The welfare range data are very skewed, with some extreme outliers because the welfare range is unbounded. For example, people could indicate that the worst suffering of a human is infinitely more intense than the worst suffering of an animal. Taking the arithmetic mean of a googolplex zeros and only one infinitely large term, gives infinity, but the median stays zero.
Second, choosing the median is not arbitrary, whereas choosing the arithmetic mean of the welfare range ratios is arbitrary. The welfare range is expressed as a ratio: the welfare range of an animal relative to the welfare range of a human. But this relative welfare range depends on the choice of reference: in this case the human. One could equally choose the animal as reference and express the welfare range of the human relative to the range of the animal. The arithmetic mean of the welfare range of an animal relative to the welfare range of a human equals the inverse of the harmonic mean of the welfare range of a human relative to the welfare range of an animal. Hence, instead of using an arithmetic mean, one could equally use the harmonic mean. But especially for skewed distributions (like the welfare range distribution), the arithmetic and harmonic means are very different. For example, the arithmetic mean of ten 1’s and one million equals 90910, whereas its harmonic mean equals 1.1. In contrast, the median estimate is not dependent on the choice of reference: the median of the welfare range of an animal relative to the welfare range of a human equals the inverse of the median of the welfare range of a human relative to the welfare range of an animal.
Third, the multiple choice options of the welfare range questions involve intervals, which means these are ordinal instead of cardinal data. One can take the median of ordinal data, but not the mean.
A further justification for the median estimate, is the median voter theorem. Suppose each welfare range estimate is a candidate in an election, and people can vote for their preferred welfare range estimate. According to the median voter theorem, the welfare range estimate preferred by the median voter is the one that is preferred over every other welfare range estimate by a majority of the people.
To improve reliability, a confidence-weighting is chosen, using the confidence level questions. The confidence-weighted median is the median after multiplicating the data by the confidence levels which are measured on a scale from 0 to 100. For example, the indicated answer of a respondent who claims to have a confidence level of 67 counts as 67 votes for that answer option, as if there were 67 respondents choosing that answer.
Next to the unweighted and confidence-weighted median, the unweighted and confidence-weighted geometric means of the welfare ranges are calculated. First, the extreme responses, that the animal cannot experience suffering or that the worst suffering of a human is infinitely more intense than the worst suffering of the animal, are excluded. These responses correspond with a welfare range of 0, and including a 0 in a geometric mean results in a zero mean (because of the multiplication of the data points). Second, each of the ten remaining answer options is associated with the geometric mean of the boundaries of the interval presented in that option. Third, the geometric mean of the responses is calculated as the exponent of the arithmetic mean of the logarithms of the associated values of the answer options. Confidence-weighting can be done in the same way as with the median. In contrast with the arithmetic mean, the geometric mean is not arbitrary, as it does not depend on the arbitrary choice of reference. The geometric mean of the welfare range of an animal relative to the welfare range of a human equals the inverse of the geometric mean of the welfare range of a human relative to the welfare range of an animal.
The preferred measure for the welfare indices (relative welfare levels), is the confidence-weighted arithmetic mean. First, the welfare indices are bounded between minus ten and ten, which means there are no extreme outliers. The data of the welfare indices is less skewed, as a result of which the median and arithmetic mean are close to each other. Second, the reference value of the welfare index corresponds with the welfare extrema: the worst suffering and the highest welfare that can be experienced. This choice of reference value is more natural or less arbitrary than the choice of reference (human or animal) in the welfare range questions. Third, the welfare level data are cardinal values instead of ordinal values, which means that averages can be calculated. Fourth, the arithmetic mean allows to calculate the total value, as the arithmetic mean multiplied by the number of individuals. For completeness, the unweighted and confidence-weighted medians of the welfare indices are also calculated.
Results
Demographics
120 respondents completed the survey, of which 112 were retained as they answered the test question correctly. 56 respondents identified as male, 54 as female and 2 as other gender. 58 respondents were younger than 50 years, 54 were older. 58 said they are not actively involved with animal welfare or animal rights, 35 were little active (e.g. sign a petition every now and then, eat a little less meat), 15 were fairly active (e.g. eating almost no meat, donating money to an animal organization) and 4 were very active (e.g. not eating meat, participating in animal rights campaigns, volunteering at an animal organization).
Welfare range
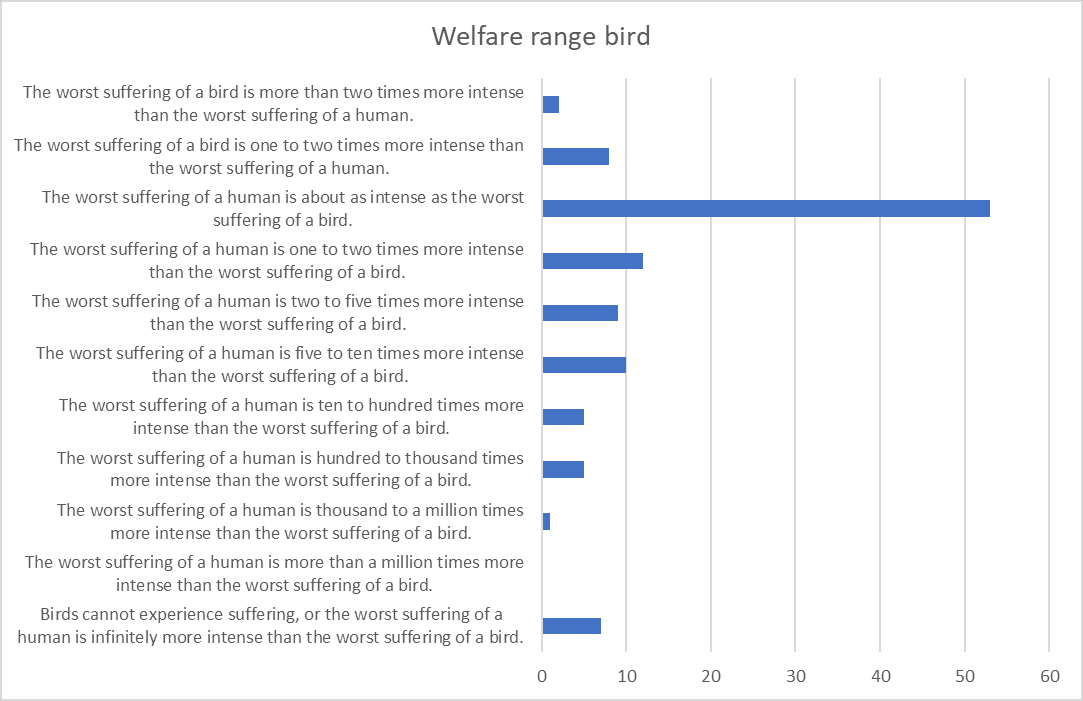
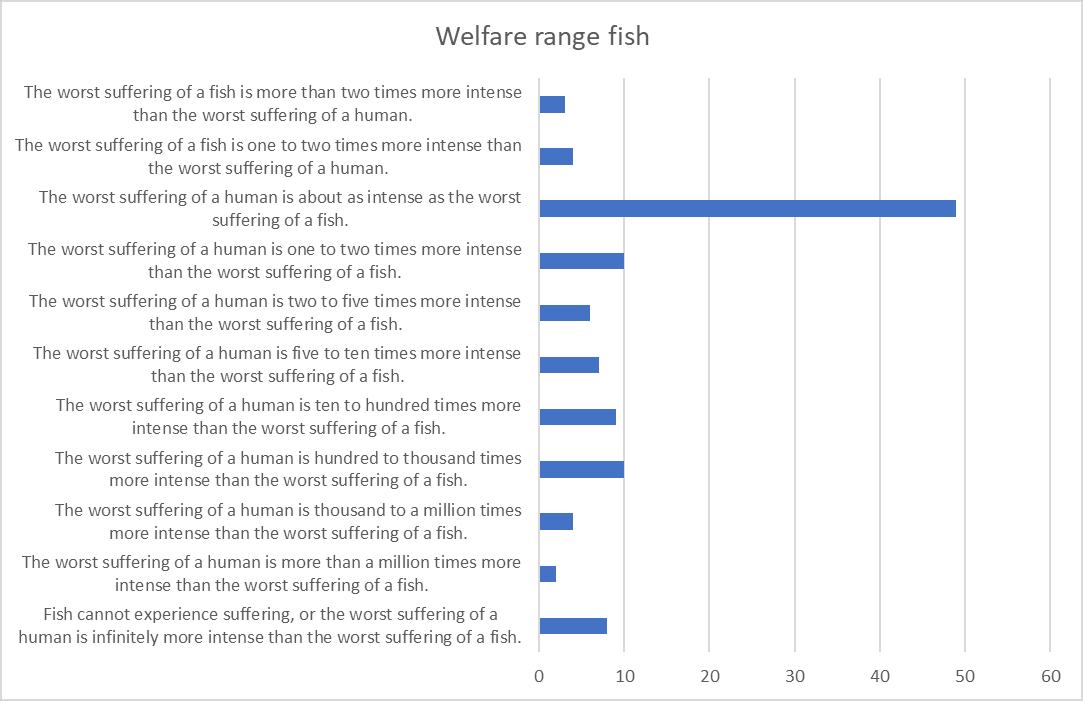
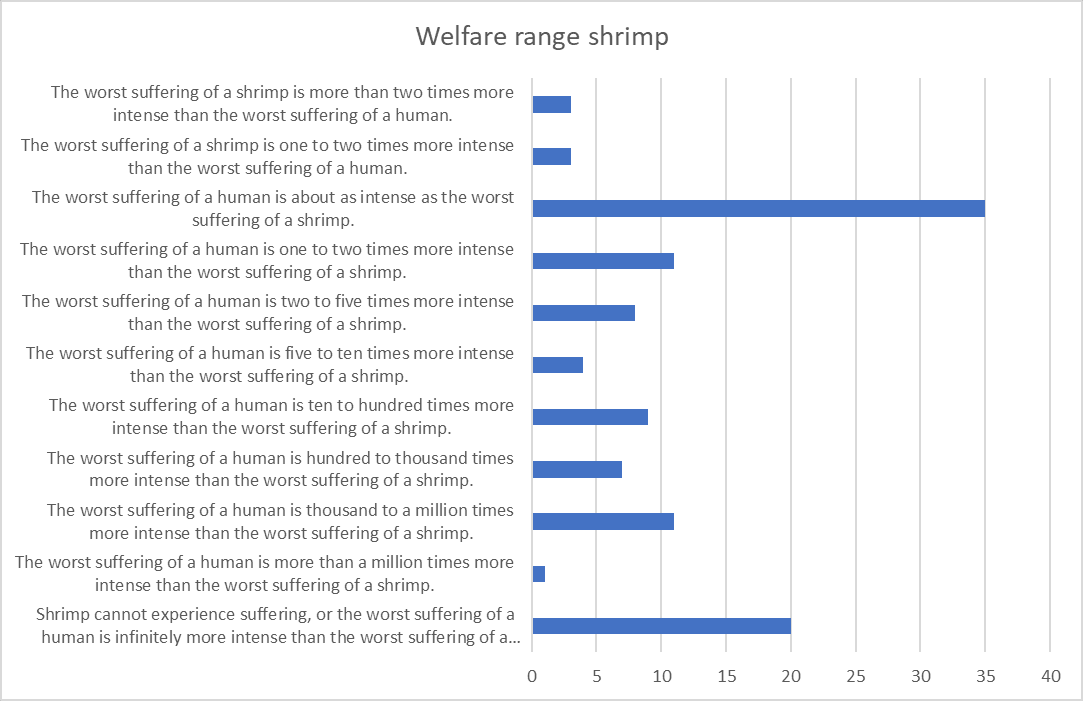
The median and confidence-weighted median estimates of the welfare range of dogs and birds are 1, which means that most people believe that dogs and birds have the same (or more) capacity of suffering as humans. Shrimps and flies have a lower capacity, but still most people (three quarters) believe that also flies can experience suffering.
According to the geometric mean, birds have a welfare range close to 0.5. This means that two birds in extreme suffering is the equivalent of one human in extreme suffering. All welfare range estimates according to the survey are higher than the Rethink Priorities median estimates. This means Rethink Priorities underestimated the animal welfare ranges according to most people. Of all the calculated estimates, the geometric means are closest to the Rethink Priorities median estimates.
| Geometric mean | Confidence-weighted geometric mean | Median | Confidence-weighted median | Rethink Priorities median estimate | |
| Dog | 0.699 | 0.770 | 1 | 1 | 0.515 |
| Bird | 0.463 | 0.491 | 1 | 1 | 0.332 |
| Fish (salmon) | 0.203 | 0.243 | 0.5 - 1 | 1 | 0.056 |
| Shrimp | 0.144 | 0.156 | 0.2 - 0.5 | 0.2 - 0.5 | 0.031 |
| Fly | 0.089 | 0.093 | 0.01 - 0.1 | 0.001 - 0.01 | 0.013 |
Welfare index
On the scale from minus 10 to plus 10, the average welfare of a human (in Belgium) over the past month is 2.6. Hence humans reached on average one quarter of their full potential of happiness in the past month. But the average welfare of a broiler chicken (in Belgium), according to the confidence-weighted arithmetic mean and median, is close to minus 3. This means that most people believe that the amount of suffering of a chicken is at least as much as the amount of happiness of a human. Broiler chickens reach more than one quarter of their full potential of suffering in an average month. Charity Entrepreneurship also estimated broiler chicken suffering to be equal in size to human happiness. Wild birds (chicks that die prematurely in nature) have a zero welfare. The (confidence-weighted) arithmetic mean of wild bird welfare is not significantly different from 0 at 0.05 significance level. The standard errors of the arithmetic means of broiler chicken and wild bird welfare are 0.4. Hence, the difference in absolute values of the arithmetic means of human and broiler chicken welfare is not statistically significant at a 0.05 significance level.
| Arithmetic mean | Confidence-weighted arithmetic mean | Median | Confidence-weighted median | Charity Entrepreneurship estimate | |
| Human | 2.6 | 2.6 | 4 | 4 | 6 |
| Broiler chicken | -2.1 | -2.9 | -2 | -3 | -6 |
| Wild bird (chick) | 0.4 | 0.6 | 0 | 0 | 0 |
Discussion
Combining the welfare range and welfare index
The interpersonally comparable welfare of an individual is the product of the welfare range and the welfare index (relative welfare level). The median estimate welfare range of a bird is 1, which means the welfare index of a chicken is directly comparable to the welfare index of a human. However, the interpersonally comparable welfare might be a biased estimate when the welfare range correlates with the welfare index. According to the survey, the correlation between the welfare range of a bird (measured on an ordinal scale) and the welfare index of a broiler chicken (on a cardinal scale) is 0.06 and not significantly different from 0 (p-value>0.05).
Representativeness and subgroup estimates
The survey was conducted among a representative sample of the Flemish adult population according to age and gender. However, the results are very insensitive to population composition. The median welfare range estimates are the same for men and women, for younger and older people and for people with no active involvement and at least some involvement in animal welfare issues. No statistically significant differences in distributions of welfare ranges were observed between different subgroups according to gender (male or female), age (younger or older than 50 years) and animal welfare involvement level. Kolmogorov-Smirnov and Mann-Whitney tests for equality of distributions always had p--values higher than 0.05. Hence, the welfare ranges are not biased in favor of vegans, animal rights activists or people who tend to care more about animal welfare.
When it comes to the welfare index, sometimes significant differences in means of broiler chicken welfare according to gender, age and animal welfare involvement level were observed. Women, older people and people who are not involved in animal welfare issues have a more negative estimate of the broiler chicken welfare index (t-test p-values are lower than 0.05). Especially the latter may be surprising: it indicates that people who care less about animal welfare and people who eat more meat, are more pessimistic about the welfare conditions of broiler chickens.
| Broiler chicken welfare index | Arithmetic mean | Standard error |
| Involved in animal welfare | -1.07 | 0.55 |
| Not involved in animal welfare | -3.22 | 0.66 |
| Men | -1.04 | 0.59 |
| Women | -3.33 | 0.63 |
| Younger than 50 | -1.31 | 0.63 |
| Older than 50 | -2.96 | 0.60 |
Order effects
The response options of the welfare range questions were presented in either ascending order (from “The animal cannot experience suffering” to “The worst suffering of the animal is more than twice as intense as the worst suffering of a human”) or descending order. Respondents who saw the welfare range response options in descending order had the same median as respondents who saw the options in ascending order. No statistically significant differences in distributions of welfare ranges were observed between response options presented in ascending and in descending order (Kolmogorov-Smirnov and Mann-Whitney tests for equality of distributions always had p--values higher than 0.05). Hence, the order of the response options of the welfare range questions do not matter and did not bias the results.
Note also that the answer options are asymmetric: eight options indicate a higher welfare capacity of the human than the animal, two options indicate a higher capacity of the animal. This asymmetry was chosen because of the expectation that only a few people believe that a non-human animal has a higher welfare capacity than a human. However, this asymmetry might bias the results and underestimate the welfare range of the animal. As there are more answer options corresponding to a welfare range lower than 1, a slight randomness in people’s responses would result in a slightly higher probability of indicating a welfare range lower than 1.
Welfare asymmetry
The conclusion drawn in the above results section, that most people believe that the amount of suffering of a chicken is at least as much as the amount of happiness of a human, implicitly assumes welfare symmetry. A unit of positive welfare is assumed to be the same in size as a unit of negative welfare.
This assumption may be invalid: perhaps negative experiences can be more intense than positive experiences. The welfare range questions only asked about the intensity of suffering, not the intensity of happiness. Hence, they only measure the welfare range on the negative side of the welfare scale. It may be possible that the positive welfare range is different from the negative welfare range.
The welfare index is measured on a scale from minus 10 (the most intense negative welfare) to plus 10 (the most intense positive welfare). This may give the impression that valence symmetry is assumed: that the range of negative experiences (negative welfare) is as wide as the range of positive experiences, namely ten units of welfare. Valence symmetry means that positive and negative experiences of the same intensities have symmetrical impacts on welfare. However, the scale from minus 10 to plus 10 does not necessarily mean that the most intense negative welfare is as intense as the most intense positive welfare, because a unit on the negative side of the scale not necessarily equates a unit on the positive side of the scale. The survey did not mention that the units were equal in size. If negative experiences can be more intense than positive experiences, and all units on the welfare index scale are the same in size, then the negative side of the welfare index scale would be wider than the positive side. It would run from for example minus 100 to plus 10 if suffering could be ten times as intense as happiness. In the survey, the negative side of the scale is rescaled to have the same width as the positive side.
Some people believe and some evidence suggests that severe pains can be more intense than severe pleasures of the same nominal value. If humans and animals have such a negative-dominated welfare asymmetry, a minus 3 for a broiler chicken corresponds with a more intense state than a plus 3 for a human on the welfare index scale from minus 10 to plus 10. In that case, the results of the present survey, which assume welfare symmetry, underestimate the amount of animal suffering of broiler chickens.
Survey effect on personal meat consumption
At the end of the survey, respondents were asks whether the survey affects their future personal meat consumption. 2% of respondents said the survey makes them want to eat more meat, whereas 11% said it makes them want to eat less meat. Hence, in net terms, the survey makes 9% of the respondents want to decrease their meat consumption. Several respondents wrote that the survey gets them thinking.
Conclusion
According to animal welfare estimates of most people (in Belgium), the total welfare of all farmed animals is negative and is larger than the total positive welfare of all humans, whereas the welfare of wild animals may be close to zero. This means most people believe that due to animal farming, the total welfare in the world may be negative and declining further as animal farming expands. Most people believe that farmed animals such as chickens have a welfare capacity roughly equal in size as that of humans, and that most broiler chickens experience suffering at a level higher than one quarter of the maximum suffering that a chicken or a human can possibly experience. People who want to increase total welfare or minimize total suffering in the world should therefore prioritize decreasing animal farming and improving the welfare levels of farmed animals.
Nice post, Stijn!
This is roughly line with my estimate that the mean suffering per time of a broiler in a reformed scenario is 64.2 % of the mean happiness of a human[1] (globally). In the same analysis, I calculated the annual suffering of all farmed chickens is 1.74 times the annual happiness of all humans. Including all farmed animals, I got a ratio of 4.64. These values highlight the meat-eater problem, and suggest saving a random human life may well increase suffering nearterm, which is one reason to prioritise helping animals over humans, especially in high income countries where there is a higher consumption per capita of animals with bad lives.
There is not so much to worry about in low income countries. Without accounting for higher future consumption, I calculated the cost-effectiveness of GiveWell's top charities only decreases by 8.72 % accounting for negative effects on farmed animals. On the other hand, I estimated corporate campaigns for chicken welfare, like the ones supported by The Humane League (THL), are 1.44 k times as cost-effective as GiveWell's top charities. So I still think the best animal welfare interventions are way more cost-effective than the most cost-effective ways to save human lives at the current margin (relatedly).
Chickens are the most farmed land animal.
Very interesting results. They seem surprisingly animal-friendly/considerate to me.
"The survey title and introduction didn’t mention objectives of the survey, except that it is about animal welfare".
To check, could people see this before deciding whether or not to take the survey? If they could, I'd expect that to skew the participation substantially towards people who already care disproportionately about animals, or think them to be closer in capacity to humans etc.
If so, did you collect any demographic information that wasn't filled based on quotas and can be compared to wider Dutch demographic data that might give insight into this? E.g. rates of vegetarianism? Or even if you found that survey participation was filled more quickly by women than by men, I'd take that as a relevant indication, given correlations between gender and various measurements relevant to caring about animals.
(Even if these aspects are similar to the wider population, or you only shared that it was about animal welfare later on after people signed up, I'd expect social desirability bias to influence the results somewhat.)
Participants could see the title of the survey in their mail, before opening the survey. The participants get rewarded with a small value coupon when completing the survey, so I don't expect a pro-animal welfare selection bias. There was a question about active involvement level on animal welfare issues. Half of the respondents indicated to are not involved with animal welfare at all, 4% indicated high involvement, meaning e.g. eating no meat. Others had involvements like occasionally signing animal welfare petition. These statistics seem to be right, representative to the Belgian population. The survey was short, so not much difference between completion times. No significant differences in welfare range estimates were observed between people with more or less involvement, men or women,... Only relevant (statistically significant) difference: people with less active involvement had smaller negative estimates of broiler chicken welfare. I expect this to be a fluke, but again this indicates that the survey does not really have a pro animal welfare bias. Could be some social desirability bias, although I expect this to be small in anonymous online surveys of members of a marketing research company panel.
Thanks for sharing this.
I'm not sure that the question about the worst suffering alone is adequate to establish a welfare range or justifies the headline claim (which adds valence symmetry, scale linearity and the assumption that the human and broiler chicken are being rated on the same scale, rather than an entirely separate 'most possible happiness for a chicken' scale. I think it's likely that a major factor behind animal welfare enthusiasts rating the suffering of farmed animals lower than people uninterested in animal welfare is the animal welfare enthusiasts are much more likely to consider the happiness ranges similar or equivalent to human ones...). If you'd asked about the other end of the welfare range - the happiest humans/birds/shrimp/flies in existence - I don't think you'd have got the same confidence weighted median responses either.
Once you dispense with assumptions participants apparently weren't asked to make, survey responses are broadly consistent with the view that "torturing animals is bad because they can experience a lot of pain" and "battery chickens' lives are pretty uncomfortable compared with free range chickens but really not that bad or at all comparable to the lives of humans who eat them" which seems more representative of what the average member of the public thinks than human-chicken equivalence, especially given the revealed preference of most Belgians for eating poultry.
Good criticism, David. Although not entirely clear to me yet, especially the part in brackets. I'd say if we give up the assumptions of valence symmetry and scale linearity, matters are even worse for the chickens, because I expect most people to have a more negative skewed welfare scale (i.e. the negative side of the scale having a wider range than the positive side). If negative experiences can be 10 times as intense as positive experiences, a -3 welfare of a chicken would actually be a -30, i.e. 10 times larger in magnitude than a +3 welfare of a human. Also the answer options of the animal welfare range are skewed in favor of animals having a welfare range lower than 1. Hence, many aspects of the survey indicate that the suffering of broiler chickens is underestimated.
I don't think the revealed preferences of consumers are good indicators of people's estimates of the welfare levels of farmed animals, because of many reasons
Thank you for your post!
I'm happy to see that the survey got a significant proportion of people thinking. It's also fascinating that meat-eaters would be more pessimistic than others on farmed animal suffering.
Executive summary: According to a survey of the Flemish public in Belgium, the suffering of a farmed animal like a broiler chicken is equal in magnitude to the happiness of a human, suggesting that global animal farming results in net negative welfare.
Key points:
This comment was auto-generated by the EA Forum Team. Feel free to point out issues with this summary by replying to the comment, and contact us if you have feedback.